Automate release validation
- Latest Dynatrace
- Tutorial
- 6-min read
- Published Sep 29, 2024
Business-critical services require thorough validation before any changes are deployed to production. The goal is to prevent potential faults that negatively impact overall stability, performance, and resilience. Site Reliability Guardian (SRG) and Workflows can help you extend your delivery process by automatically validating the impact of a change. You can also automatically validate your key health objectives during the delivery and change process. A guardian can validate up to 50 dimensions of health on Dynatrace data, whether it's logs, metrics, traces, events, and business data.

For example, an infrastructure configuration change or an application deployment can trigger your guardian through a workflow. The workflow triggering events represent changes that Dynatrace automatically detects or events sent from your delivery pipeline or change management process.
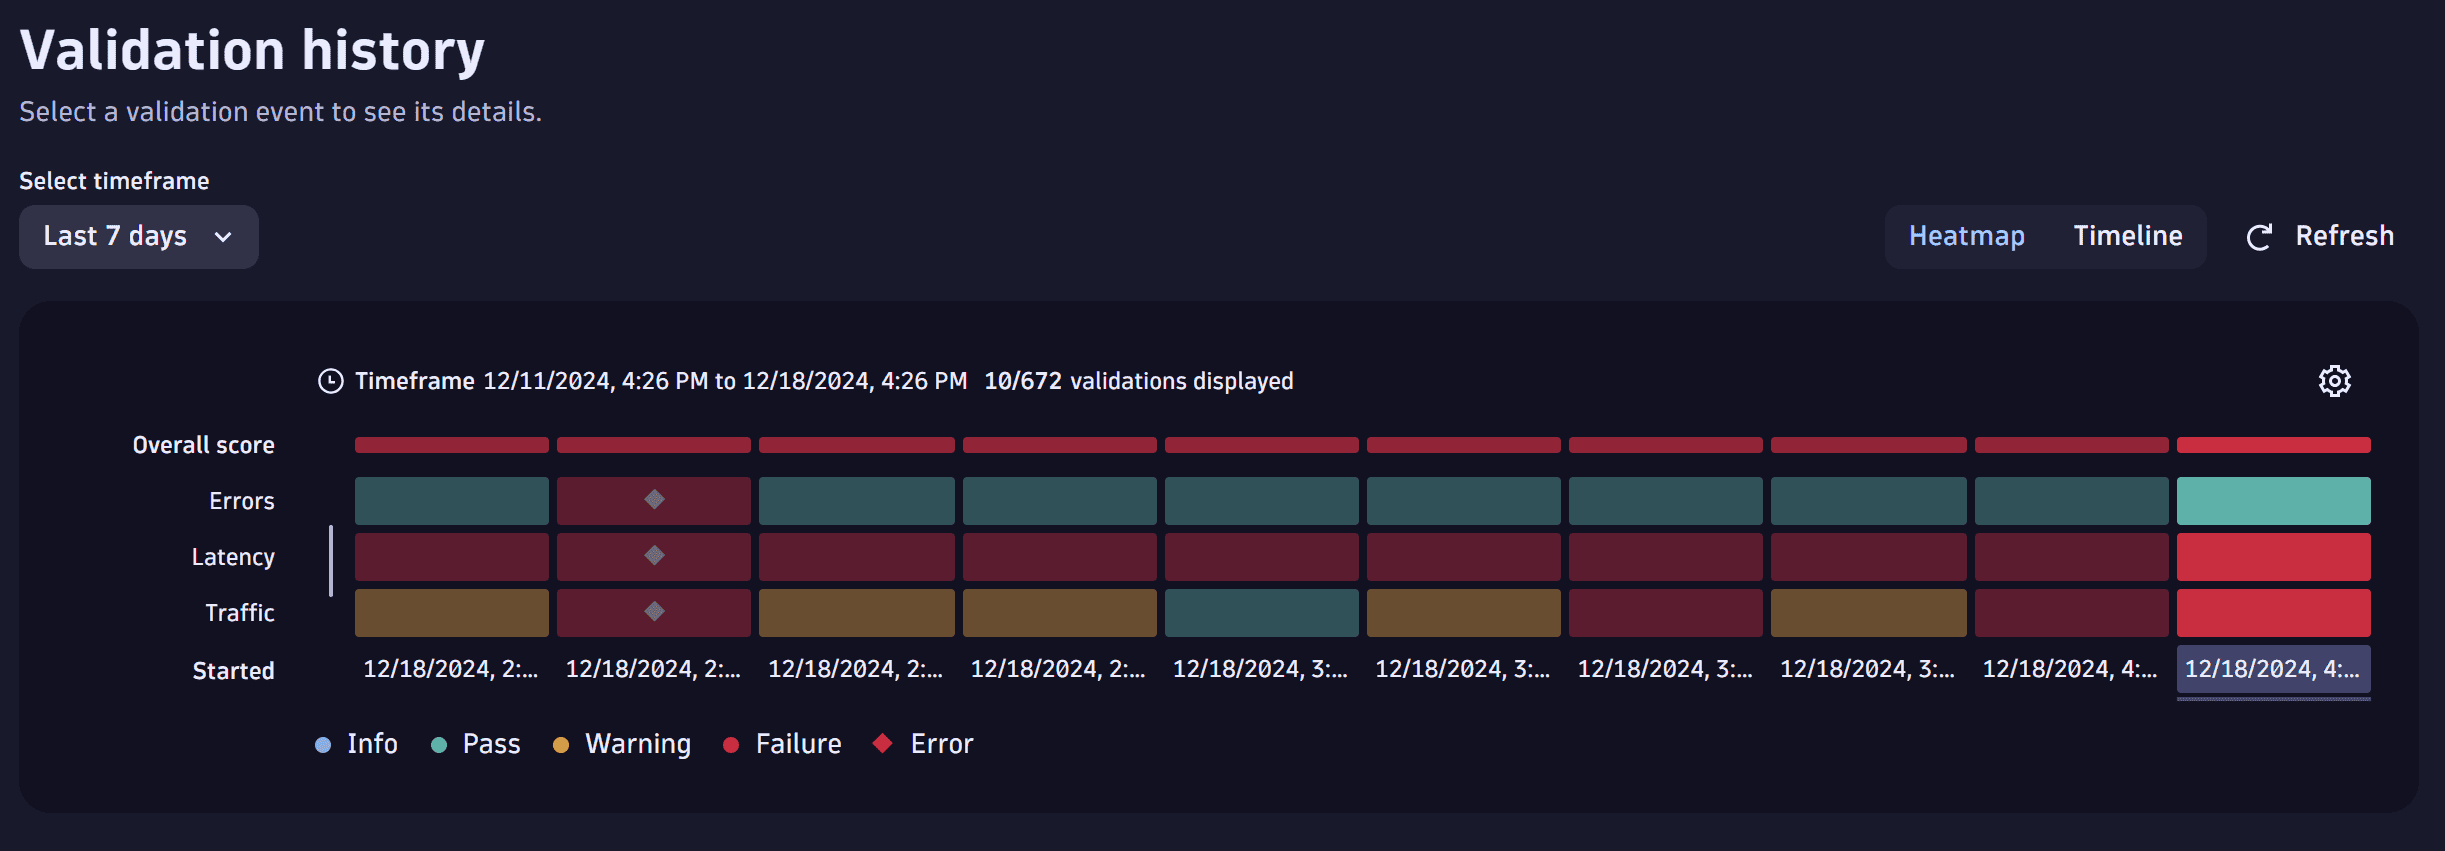
As part of the workflow execution, your guardian validates all your objectives and gives you visual feedback through a heatmap, where red is Failure, yellow is Warning, and green is Pass. The same guardian result is also available as a data point in Dynatrace, which can be sent to other tools or trigger further workflows, for instance, to send notifications about the result.
We have prepared a hands-on release validation demo tutorial on GitHub for you. In the GitHub hands-on tutorial, you'll learn how to:
- Ingest data from an application that you'll deploy in an environment that Dynatrace monitors.
- Create a workflow that triggers a guardian when a change happens.
You'll go through a scenario of multiple app deployments. For each deployment change, the guardian, triggered by a workflow, validates the health of your environment based on a set of defined health objectives. Experience the benefit of integrating the Dynatrace guardian and workflows into your software delivery and change process and see how the guardian classifies if a change as red (Failure), yellow (Warning), or green (Pass).
Target audience
This page is intended for application developers, DevOps engineers, and product managers looking for a mechanism to automatically ensure the quality of software they deliver.
What will you learn
You'll learn how to use a guardian to automatically detect negative impacts on your application after a new release in your environment.
In this tutorial, you will learn how to
- Create a Site Reliability Guardian.
- Automatically trigger the guardian via a pre-release load test.
- Provide an automated decision, based on automatically baselined metrics, whether or not to release.
You can see how Site Reliability Guardian in the playground works.
Prerequisites
You've completed the release validation demo tutorial and would like to know how to apply it to your environment.
Steps
Setup steps
Before you can run this use case, you need to complete several setup steps:
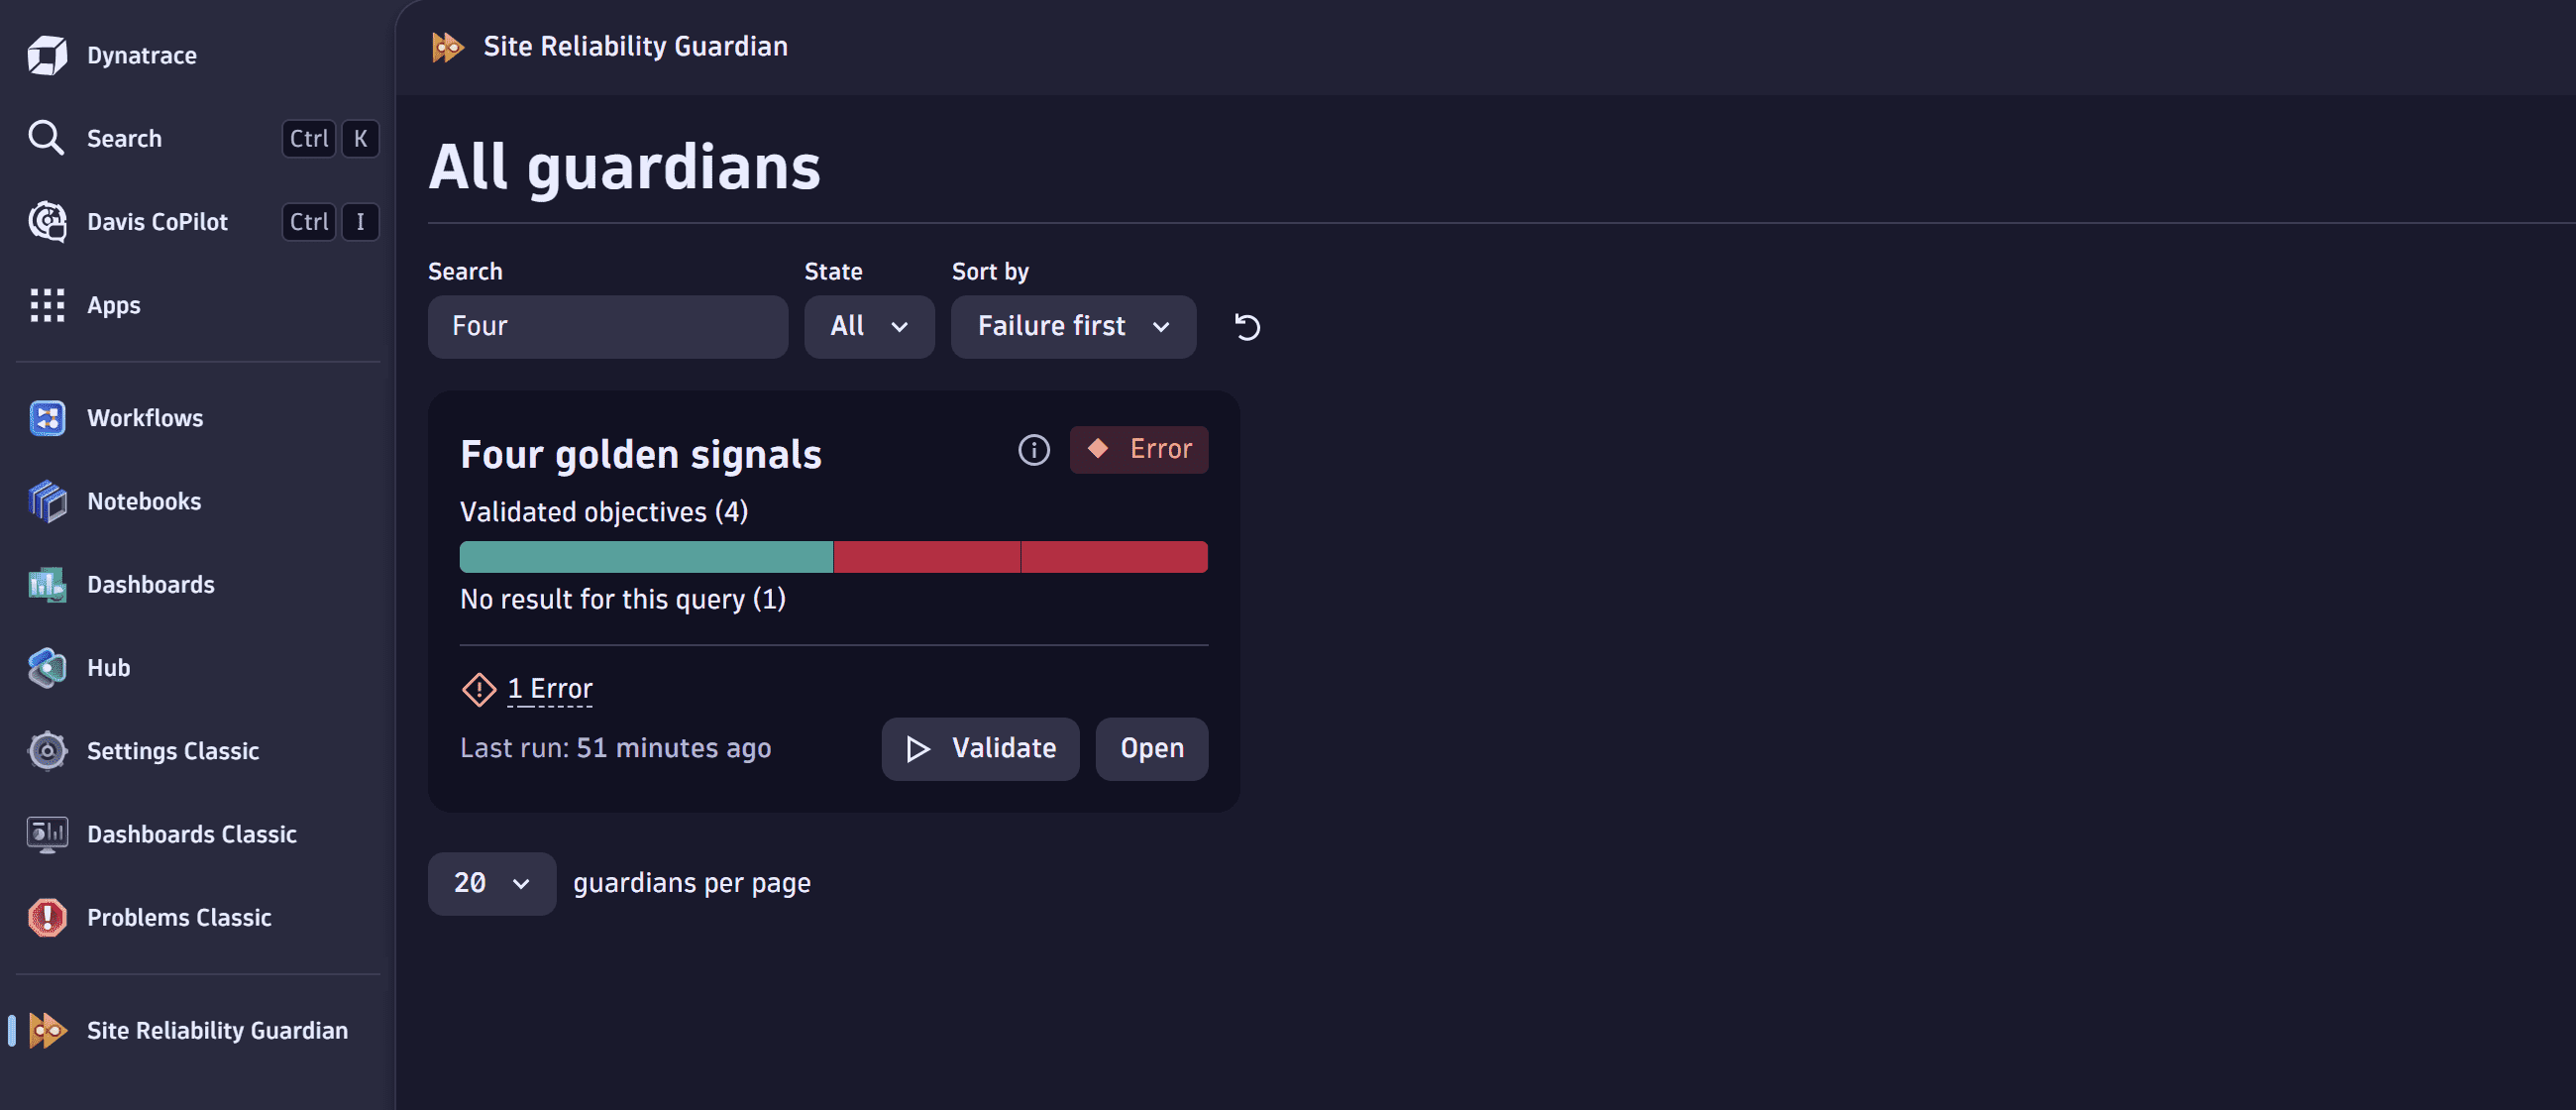
Create a guardian using a template
To create a guardian using a template
- Create a guardian using the Four golden signals template.
- Select the service you want to monitor.
- Select Save.

For a more detailed explanation, see Create Site Reliability Guardian - GitHub tutorial.
You can automatically create a Site Reliability Guardian to scale using Configuration as Code overview.
Create a workflow to trigger the SRG automatically
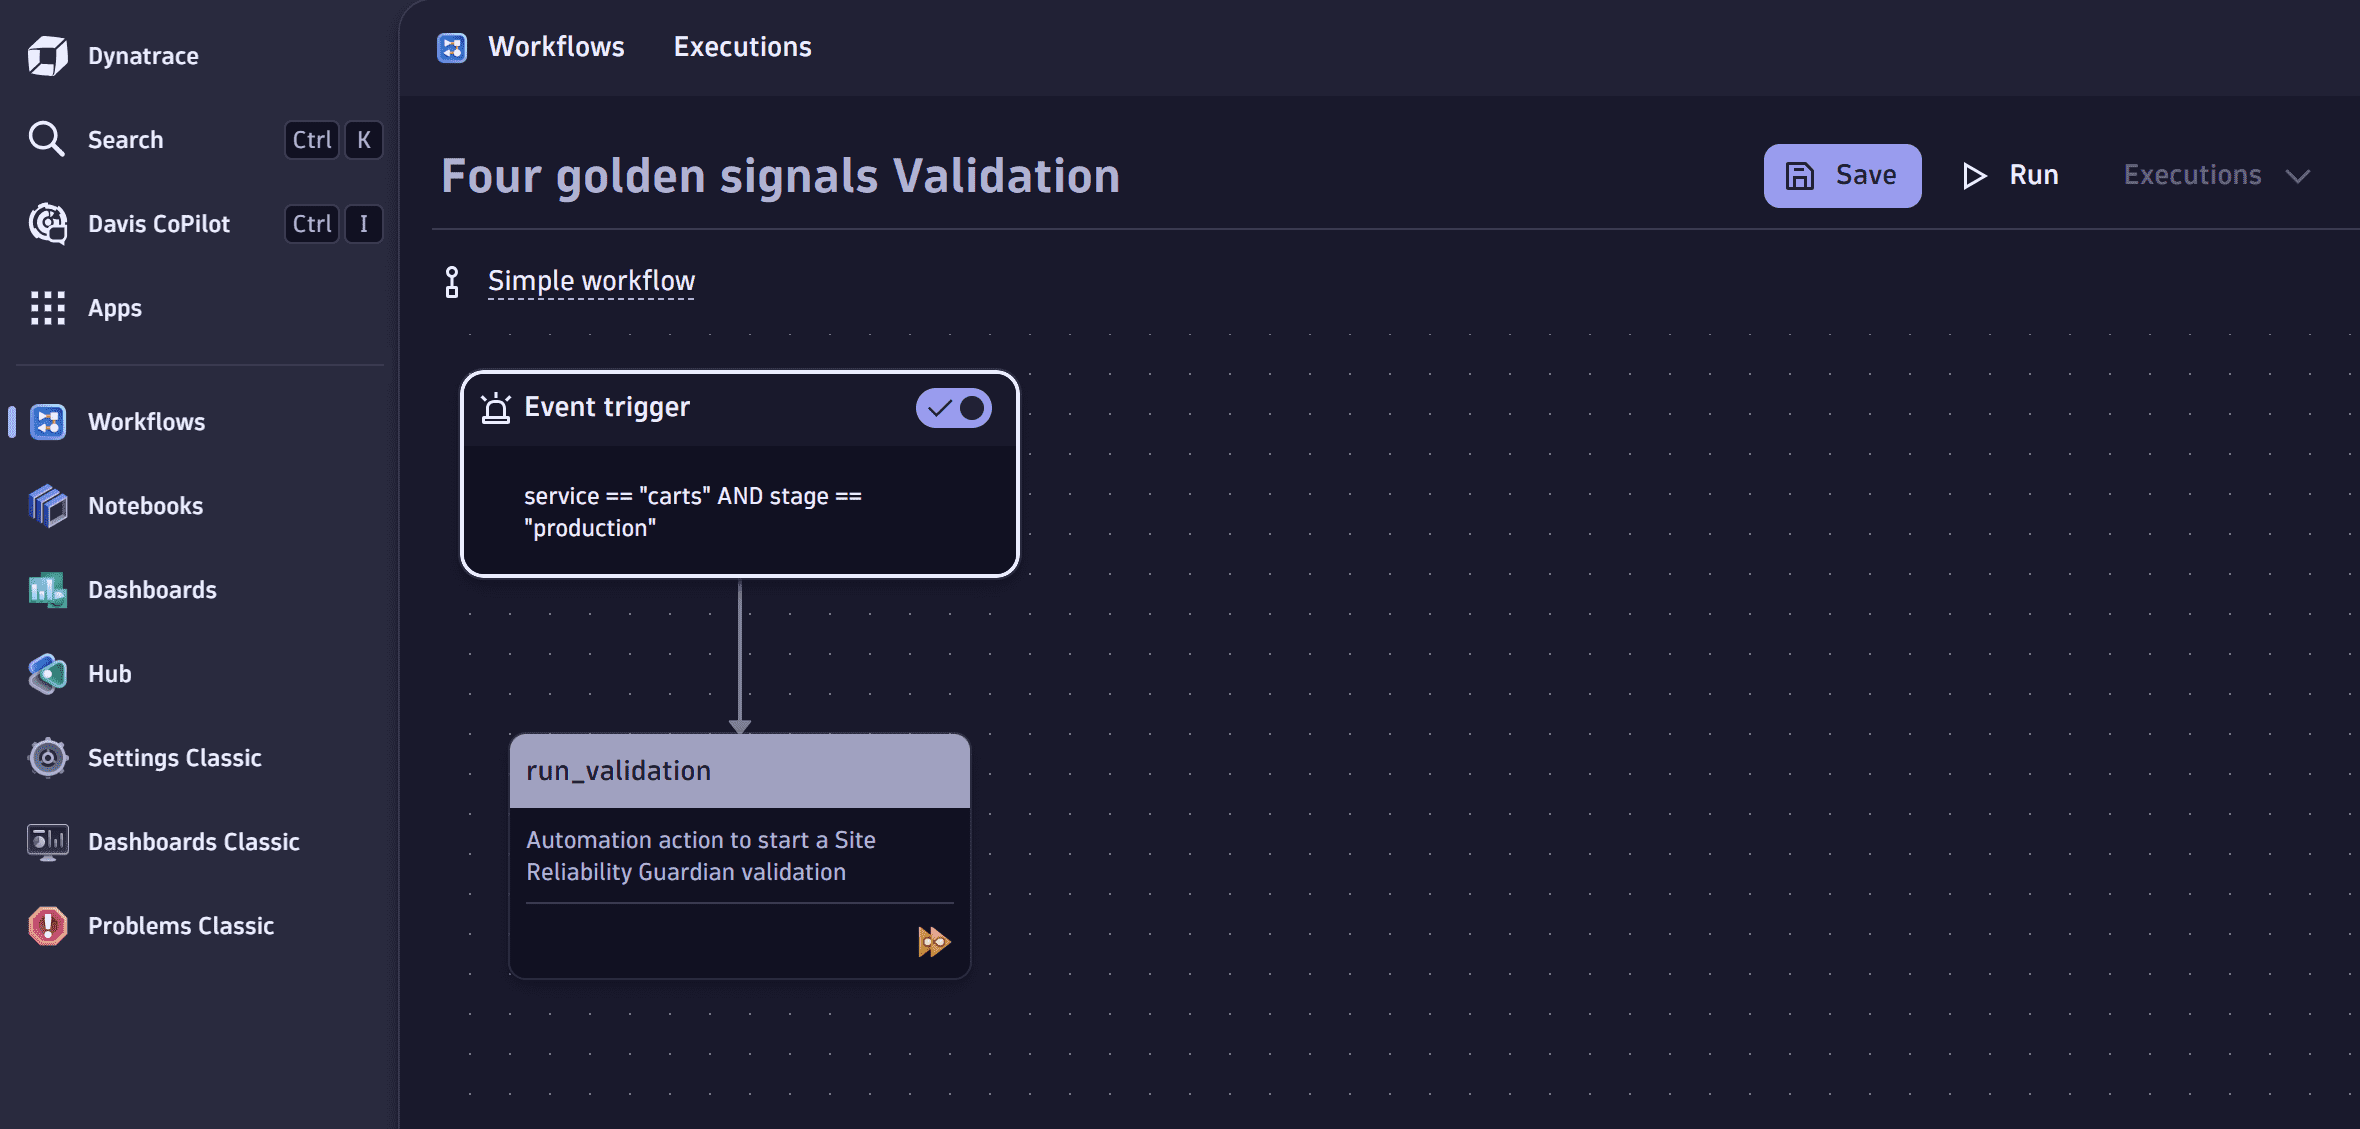
You can trigger your SRG automatically using a workflow.
To create a workflow for this guardian
-
Go to your guardian.
-
To automate the trigger for your guardian, on the All guardians page, hover over your guardian or open it, and then select Automate. Workflows
 opens in a new browser tab.
This step creates a new workflow for your guardian.
-
In your workflow, in the Event trigger pane, set Event type to events.
-
In Filter query box, copy and paste the following filter query and replace "your service name":
event.type == "CUSTOM_INFO" anddt.entity.service.name == "your service name" -
Select Query past events.
-
Go to the run validation task. This task will start your Site Reliability Guardian validation.
-
In the From field, replace
event.timeframe.fromwithnow-{{ event()['duration'] }}. -
In the From field, replace
event.timeframe.towithnow. -
Select Save next to the name of the workflow.
Now, you have a new workflow connected to the guardian of the same name, which is triggered whenever Dynatrace receives the right event.
For a more detailed explanation, see Automate the Site Reliability Guardian - GitHub tutorial.

Baseline your SRG
Objectives set to Auto-adaptive thresholds in the guardian require five runs to enable the baseline. In a real-life scenario, these test runs will run over hours, days, or weeks, providing Dynatrace time to gather sufficient usage data. To enable the baseline, you'll trigger five load tests, one after another. After baselining, you can view the completed training runs by selecting Workflows and Executions. You should see five successful workflow executions.
You could use this DQL query to see the Site Reliability Guardian results in a notebook:
fetch bizevents| filter event.provider == "dynatrace.site.reliability.guardian"| filter event.type == "guardian.validation.finished"| fieldsKeep guardian.id, validation.id, timestamp, guardian.name, validation.status, validation.summary, validation.from, validation.to
You can also view the status of your guardian, as well as the five completed runs, in Site Reliability Guardian.
Automate the release validation steps
To automate the release validation, you need to run your guardian and then enable a new feature and run the load test.
Run your trained guardian
Remember, the workflow is currently configured to listen for test finished events, but you could easily create additional workflows with different triggers, such as On demand or Cron schedule trigger.
Different triggers allow you to continuously test your service, for example, in production.
After you train the guardian, you should run it by triggering a load test. In the Validation history panel of your guardian, select Refresh . Your Heatmap will show some errors.
Informational-only objectives
It is possible to add an objective that is informational-only and doesn't contribute to the pass / fail decisions of the Site Reliability Guardian. They are useful for new services where you're trying to get an idea for the real-world data values of your metrics.
To set an objective as information-only
- Select the objective to open the side panel.
- In the side panel, scroll down to Define thresholds.
- Select No thresholds.
Conclusion
The techniques described here work with any metric from any source. You're encouraged to use metrics from other devices and sources such as business-related metrics like revenue. Learn more about Site Reliability Guardian and follow the learning modules to create guardians for your applications and infrastructure.