Monitor releases with Dynatrace
- Dynatrace Classic
- How-to guide
- 4-min read
Once you configure environment variables for version detection and, optionally, integrate your issue-tracking system and configure dynamic queries, you can start analyzing data related to each release version of your software.
List releases
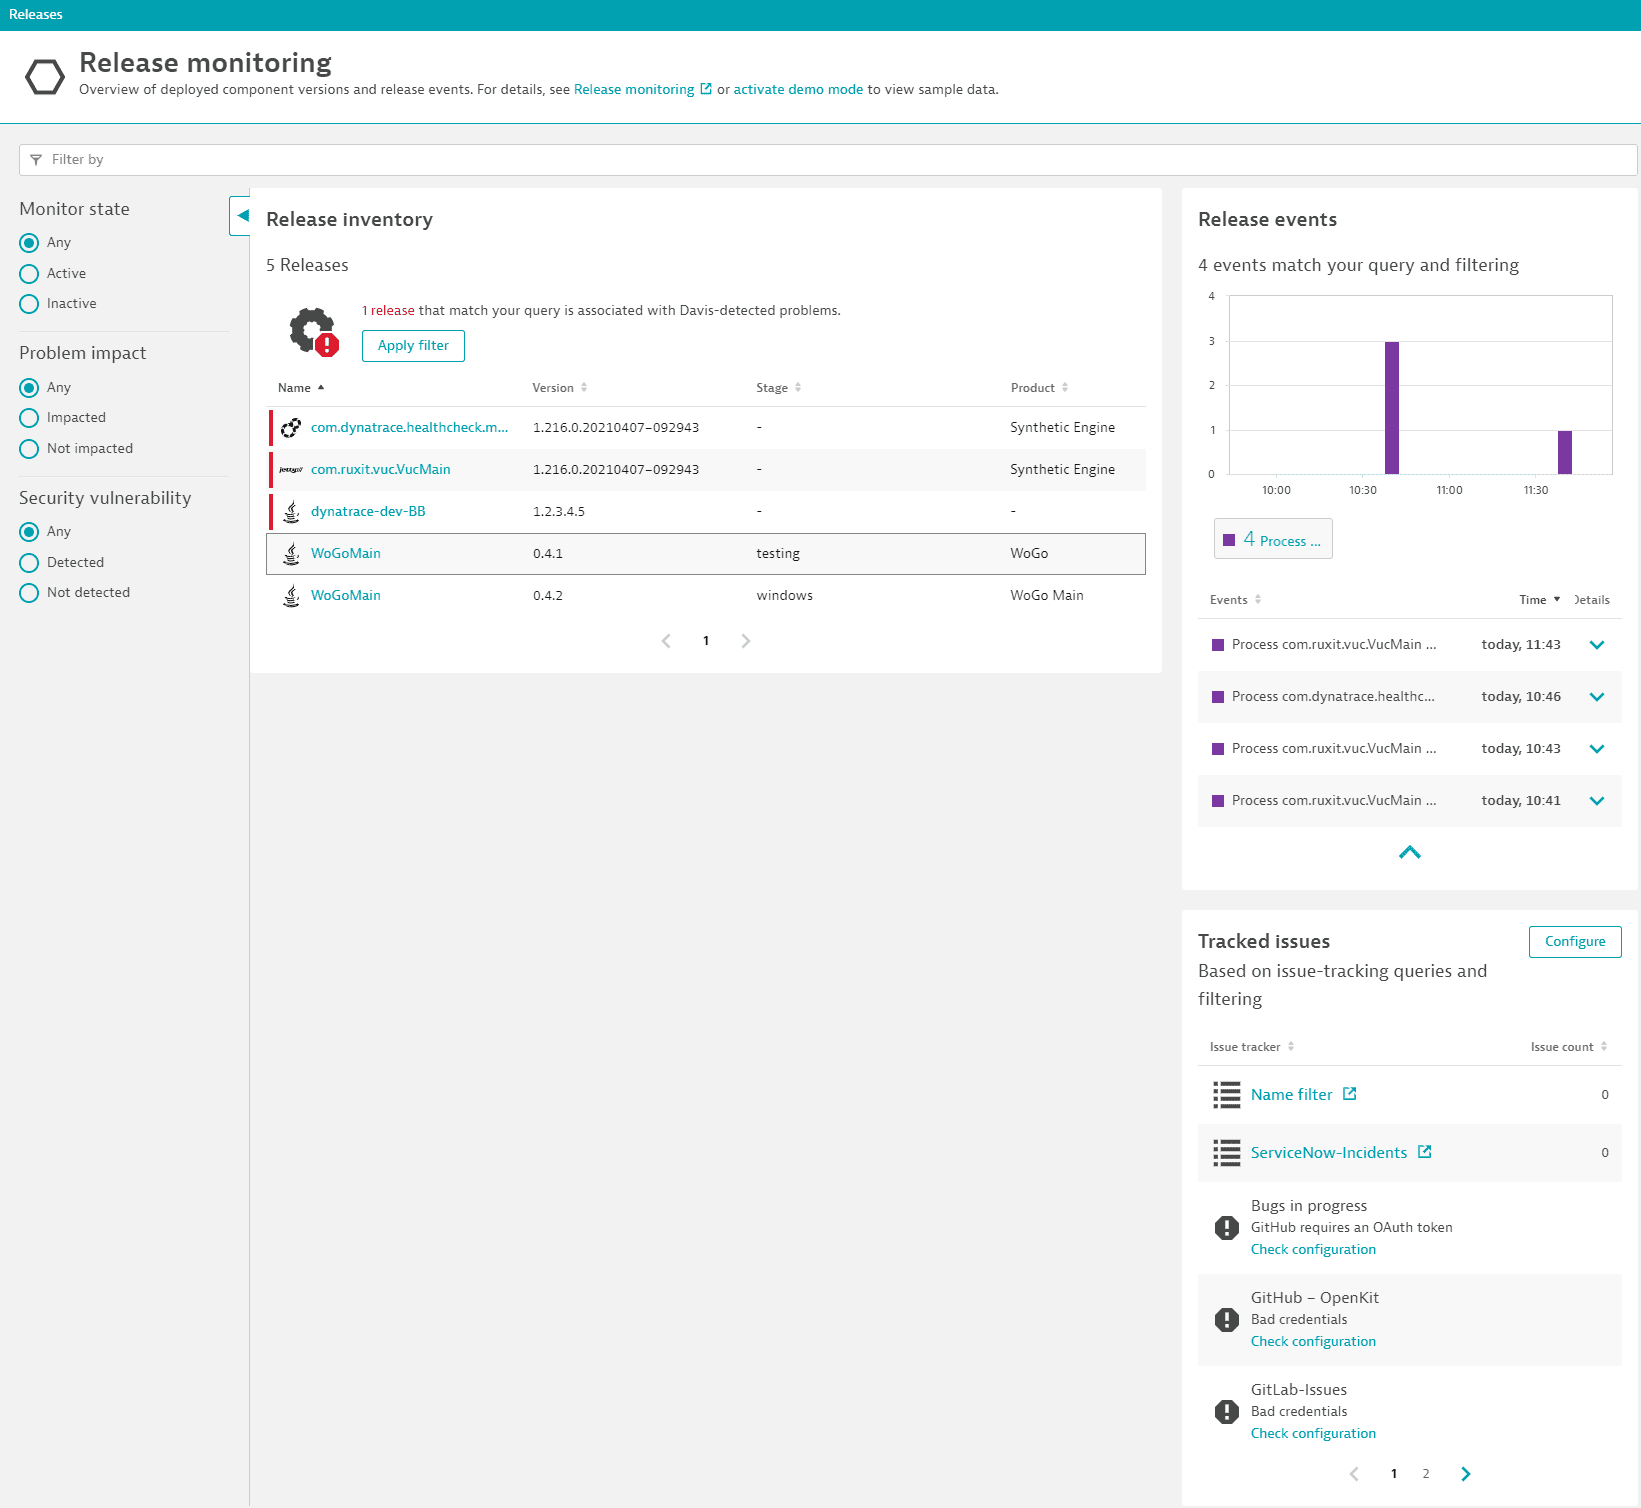
To list the software releases in your environment, go to Releases.
Example Releases page

Release version sorting uses lexicographic (string) sorting rather than semantic version sorting. In lexicographic sorting, numbers are treated as individual characters, and the ordering is determined based on these characters' ASCII or Unicode values. Release version sorting uses lexicographic sorting because there's no pattern for the release versions, and users can enter any value.
The Releases page displays the following information about the listed releases:
Release inventory
Shows all detected releases. Each entry represents processes, process group instances, grouped by release and build versions, stage, and product to which they logically belong.
Release events
Shows all events corresponding to the releases, such as process restart and deployment events.
Tracked issues
Shows issues from the external issue trackers related to the releases.
Filters
- To set simple filters, use the quick filters on the left side of the page.
- To set more detailed filters, use the filter bar above the table.
For example, you can use thetagfilter to search by the tag of a process group instance. - To see only releases that are impacted by problems, select Apply filter above the Release inventory table.
- Filtering for a specific release shows an overview of stages and product contexts in which the release is deployed.
- Filtering for a stage shows an overview of all releases deployed at that stage.
List release details
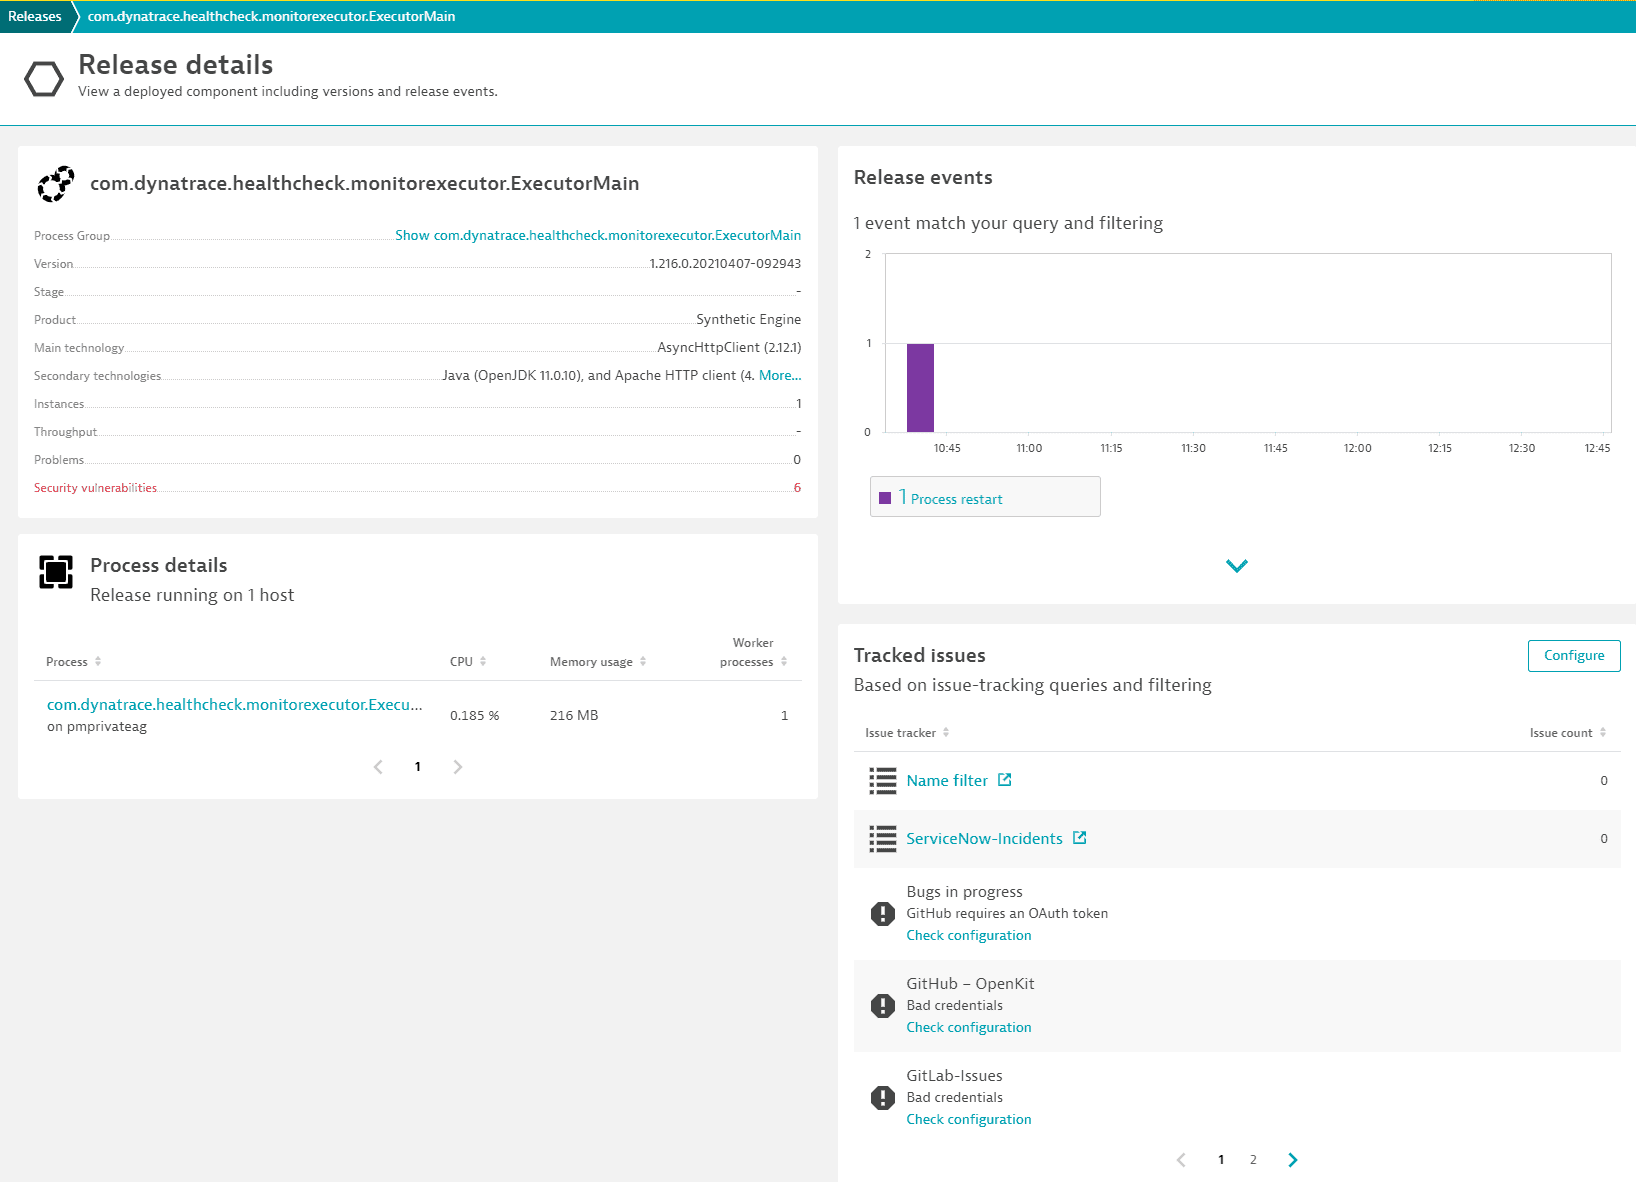
To see details about a release, select a link in the Name column of the Releases page.
Example Release details page

The Release details page displays the following information about the selected release:
Release name
Shows a summary of captured metadata (process group name, version, stage, product, technologies, instances, throughput, problems, and third-party vulnerabilities) and links to the process group where the release is deployed.
-
Instances shows the number of deployments of this release in a specific stage in the context of a specific product.
-
Throughput shows how much traffic is routed to the selected release.
-
Problems shows the number of open impacted problems related to the process group instance of the release.
If Dynatrace detects problems in the release, Problems is displayed in red. Select it to display the Problems page and gather more information. See Problem overview for details.
-
Third-party vulnerabilities shows the number of third-party vulnerabilities related to the selected release. This helps you check if, for example, a new release would introduce a known vulnerability and, based on this, decide on its impact on and relevance to your release schedule.
If Dynatrace detects vulnerabilities in the release, Third-party vulnerabilities is displayed in red. Select it to display the Security page and gather more information. See Application Security monitoring for details.
Process details
Shows hosts with basic metrics where the release is deployed and links to the host page for further analysis.
Release events
Shows all events corresponding to the selected release, such as process restart and deployment events.
Tracked issues
Shows issues from the external issue trackers related to the selected release.
Release validation
To optimize the release inventory table, when no Cloud Automation instance is provisioned, the column to display a release validation result is not shown.
Lists release validations detected within the global timeframe.
- You can sort the list by score and evaluation end time.
- Select any release validation in the list to navigate to the heatmap of the corresponding evaluation on your Cloud Automation instance.
In addition, a graph displays the latest 20 release validation results:
- The y-axis displays the score
- The x-axis displays the end time of each quality gate evaluation
- The bar color indicates the quality gate status (
Failed,Warning, orPassed)
 Releases