Manage alerts from logs with Dynatrace Intelligence
- Latest Dynatrace
- Tutorial
- 4-min read
Triggering an alert on every log record where the status is marked as “ERROR” can create thousands of alerts, often lacking context. This flood of alerts not only overwhelms monitoring teams but also makes it challenging to discern critical issues.
To address this challenge, Dynatrace integrates Log Events and Dynatrace Intelligence. With Log Events and Dynatrace Intelligence you can reduce the number of alerts and put logs in context of detected problems and topology.
Introduction
This guide describes the approach for leveraging the combined capabilities of Log Events and Dynatrace Intelligence to optimize your log monitoring and troubleshooting workflows effectively. This integration eases the log monitoring process, and helps with gaining deeper insights into the root causes of encountered issues.
Target audience
This article is intended for entry level site reliability engineers (SRE) who are responsible to maintaining the health of the digital ecosystem by proactively monitoring, diagnosing, and resolving issues that may impact the system's operation.
Scenario
As the SRE responsible for maintaining the reliability and availability of the infrastructure, you are tasked with implementing a proactive monitoring and anomaly detection system for log events. This system aims to identify potential issues and trigger timely alerts for prompt resolution. To achieve this, you need to set up automated processes to monitor log events and detect anomalies, covering both the identification of specific error patterns and the detection of irregularities in log metrics.
By integrating log event monitoring with anomaly detection capabilities, you can ensure efficient infrastructure monitoring, enabling your team to maintain peak performance and mitigate any emerging issues. See the methods you can choose from to set up a monitoring procedure.
Prerequisites
Make sure all of these are true before you start:
- Ingest Logs using OneAgent to get logs in context.
- You have log data ingested in the system, either through OneAgent, or GenericIngest/DataFirehose/OpenTelemetry Protocol (OTLP).
- Knowledge of:
- Ingesting log data into Dynatrace, particularly using the Dynatrace API (Log ingestion API) or similar data ingestion methods.
- Basic understanding of Dynatrace Query Language and how to use DQL queries.
- Make sure the following permissions are enabled.
- Grail:
storage:logs:read. For instructions, see Assign permissions in Grail.To access permissions, go to the Settings menu in the upper-right corner of the Workflows app and select Authorization settings.
- You should have the necessary permissions to configure and access monitoring tools within Dynatrace.
- You should have permissions to ingest log data into Dynatrace.
- You can integrate Dynatrace with various bug tracking tools and frameworks used in your pipeline.
- Grail:
Methods
To fulfill the presented scenarios, you can choose either to open new problems based on log events, or detect anomalies based on log metrics.
Use log events when you have a single log recod that you are certain it should open a new Problem.
Use events based on log metrics when:
- You want to detect anomalies in the metric value. For example, the record has the
response_timeattribute, and you want to open a problem when this is above average. - You want to trigger an alert when the metric value is above the threshold. For example, you can trigger an alert when you get more than 1000 error logs.
Learn more by acessing the Metric events page.
Choose one of the following methods to fulfill the presented scenarios.
Open new problems based on log events
The team wants to open a new Problem when a specific log record is ingested. This process has the following steps:
- Build and run a DQL query to retrieve logs that trigger an alert.
- Create a log processing rule to extract the additional information from the log content.
- Build an alert by creating a log event.
- Check if there are logs that match your alert.
Learn more by accessing the Set up alerts based on events extracted from logs page.
Detect anomalies based on log metrics
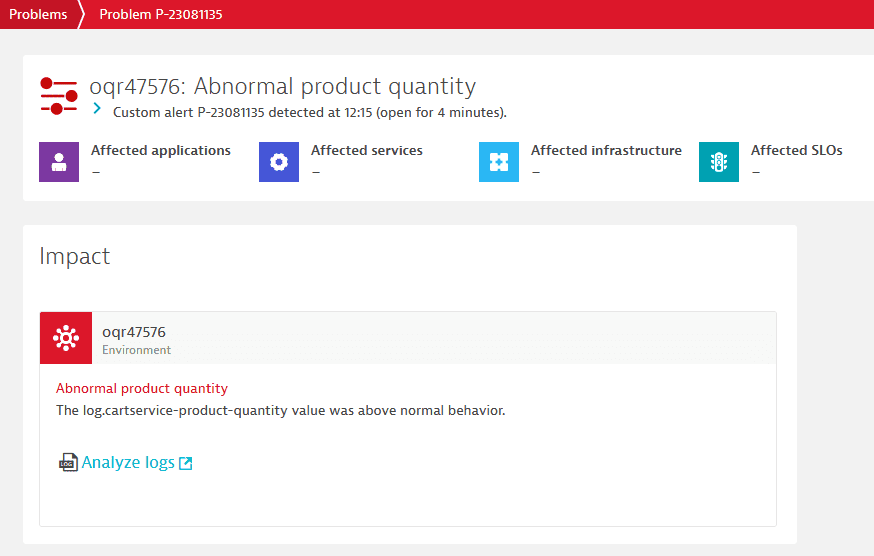
The team wants to open a new Problem when an anomaly is detected in the log metric. This process has the following steps:
- Create a DQL query as an ad hoc analytics task to retrieve the product identifiers and quantities for each transaction.
- After you've verified that you have received the correct data, turn that log query into a metric. This will speed up your monitoring, and you can automate anomaly detection and keep your query costs under control.
- Create an alert based on the value of that metric.
Learn more by accessing the Set up custom alerts based on metrics extracted from logs page.
Conclusion
According to the chosen method, you can effectively decrease the number of alerts generated from log entries. By following any of these methods, you'll simplify your monitoring procedures, enhance operational efficiency, and respond more efficiently to important issues in your system.
