What's new in Dynatrace SaaS 1.346
- Release notes
- 11-min read
- Rollout start on Aug 25, 2026
This page showcases new features, changes, and bug fixes in Dynatrace SaaS version 1.346. It contains:
Feature updates
Application Observability
Simplified demo setup with dtwiz
You can now install a ready-to-use demo application directly through the dtwiz setup flow, making it easier to evaluate Dynatrace without using your own applications or infrastructure. The demo deploys sample Python services that generate telemetry, allowing you to explore topology, findings, metrics, logs, traces, and user interactions within minutes.
When the demo is no longer needed, dtwiz uninstall demo helps remove the services and resources created during setup.
Application Observability
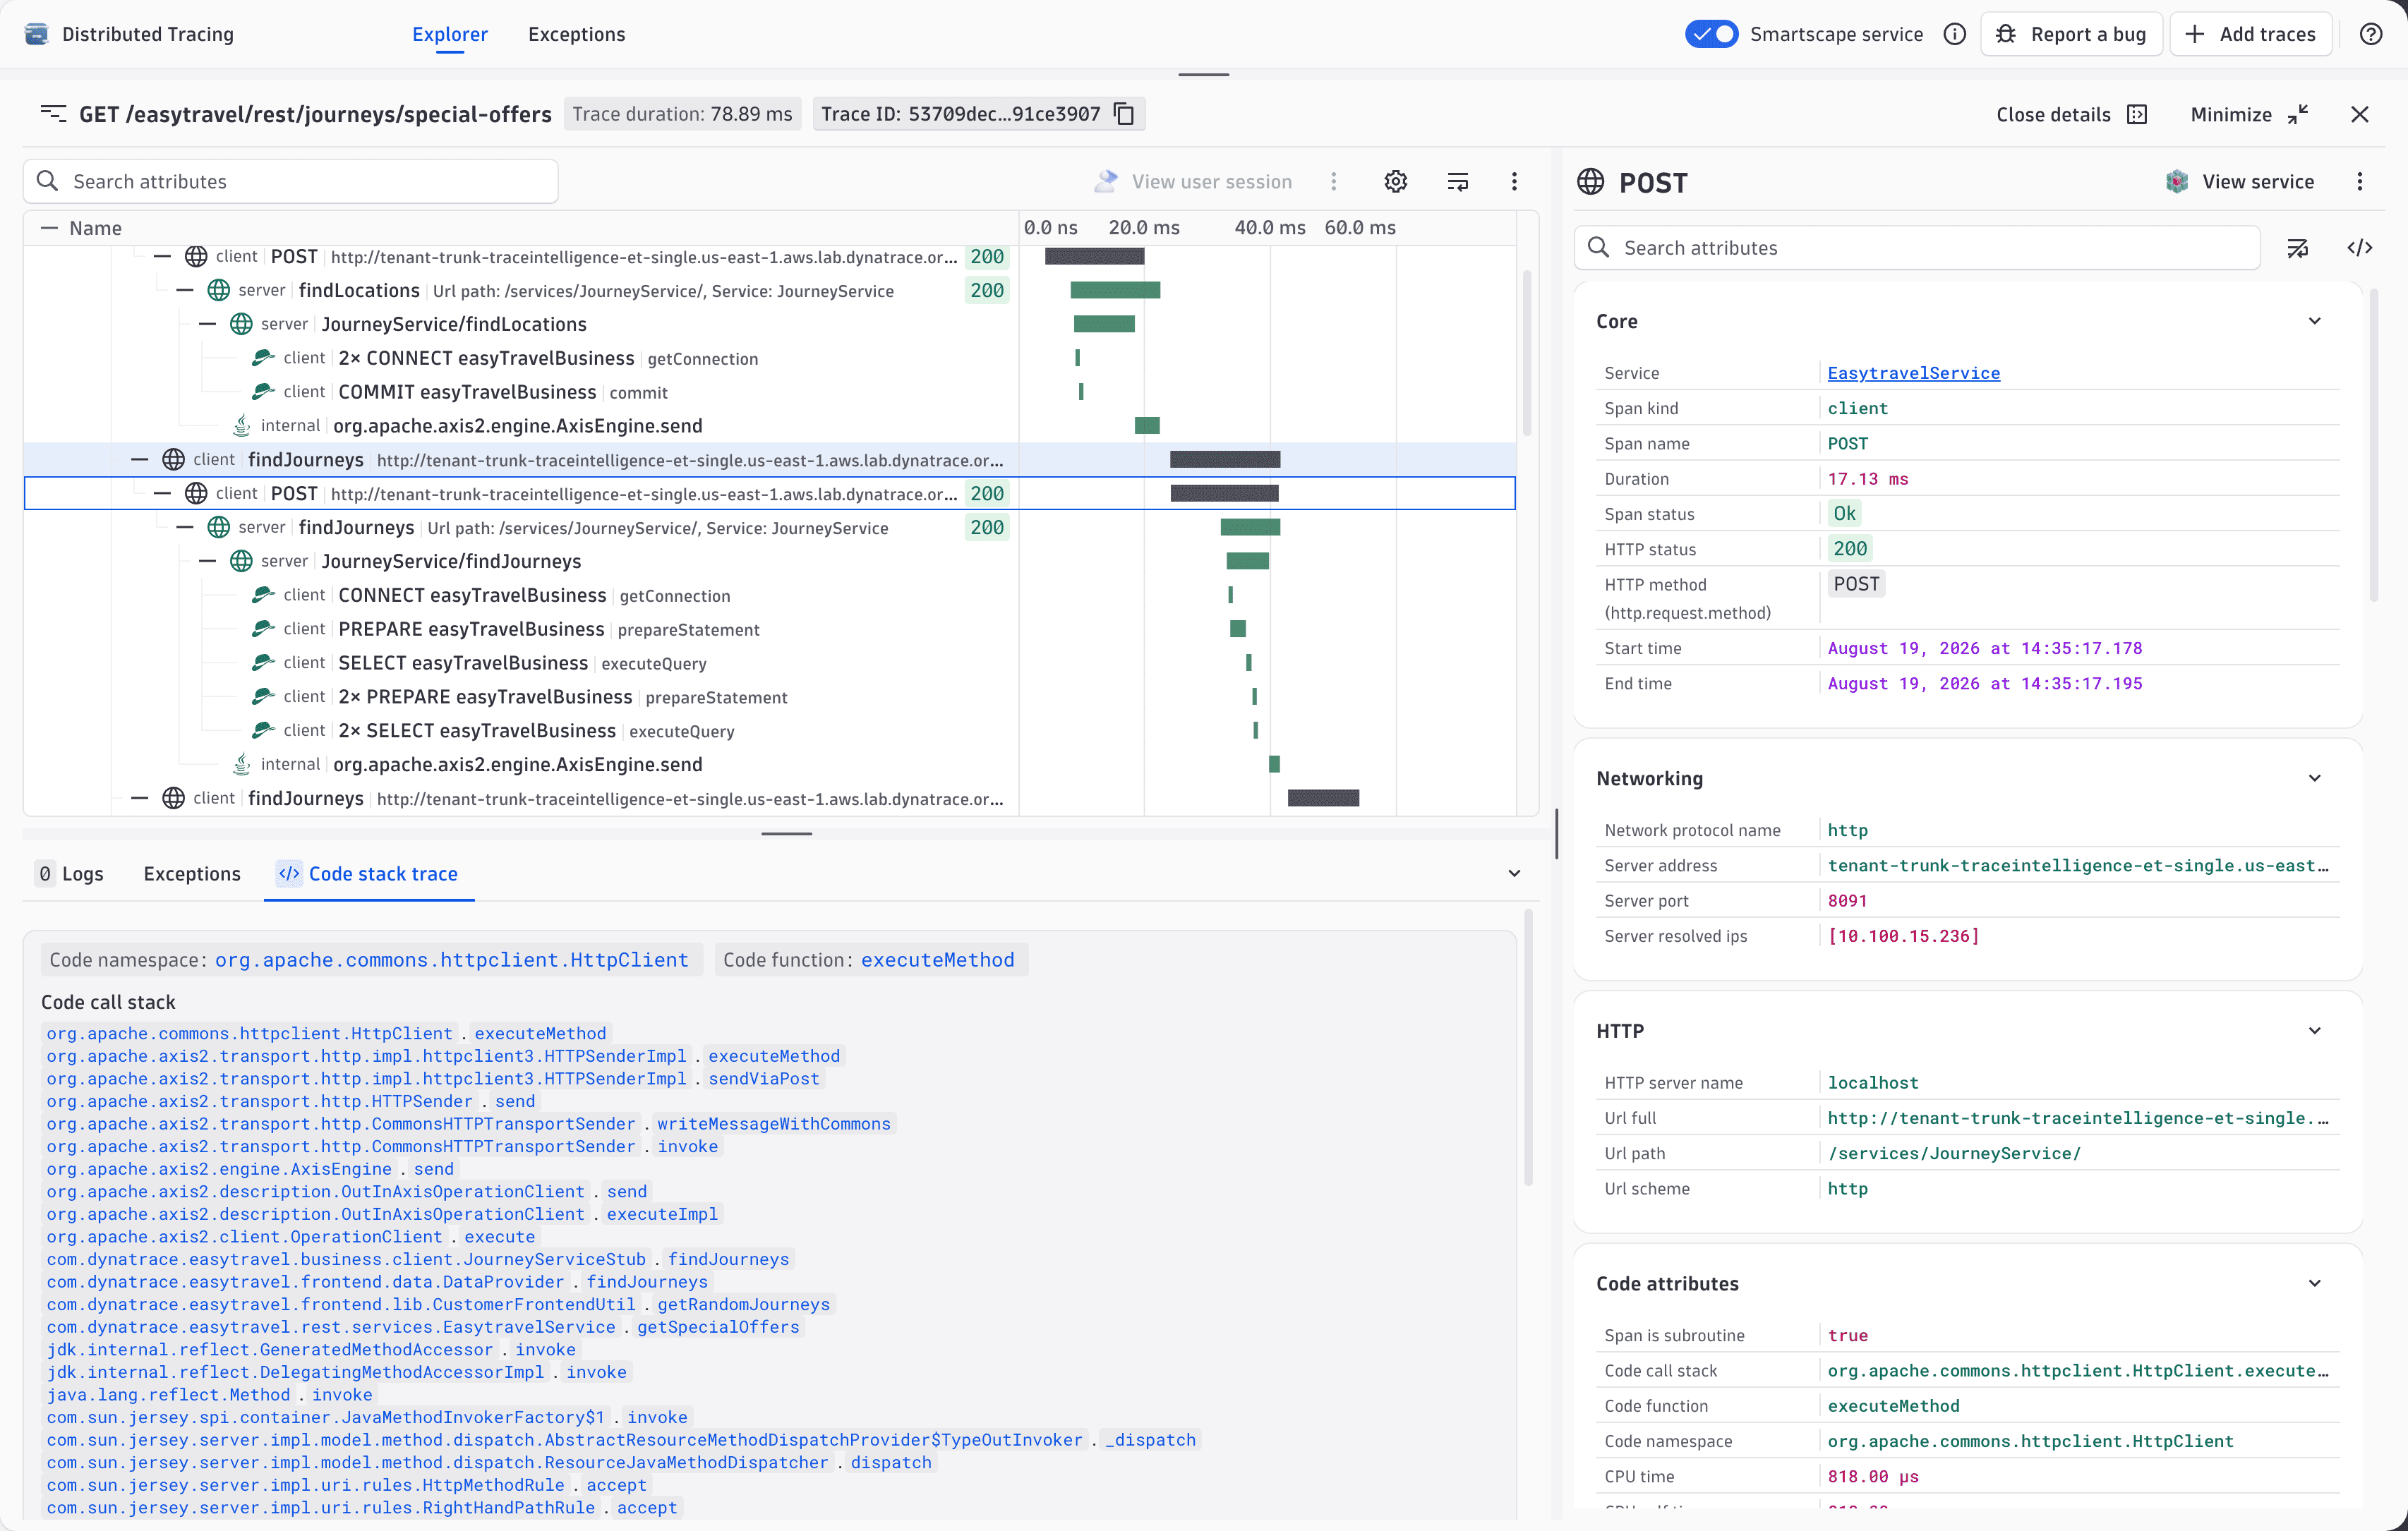
Explore code stack traces for spans in  Distributed Tracing
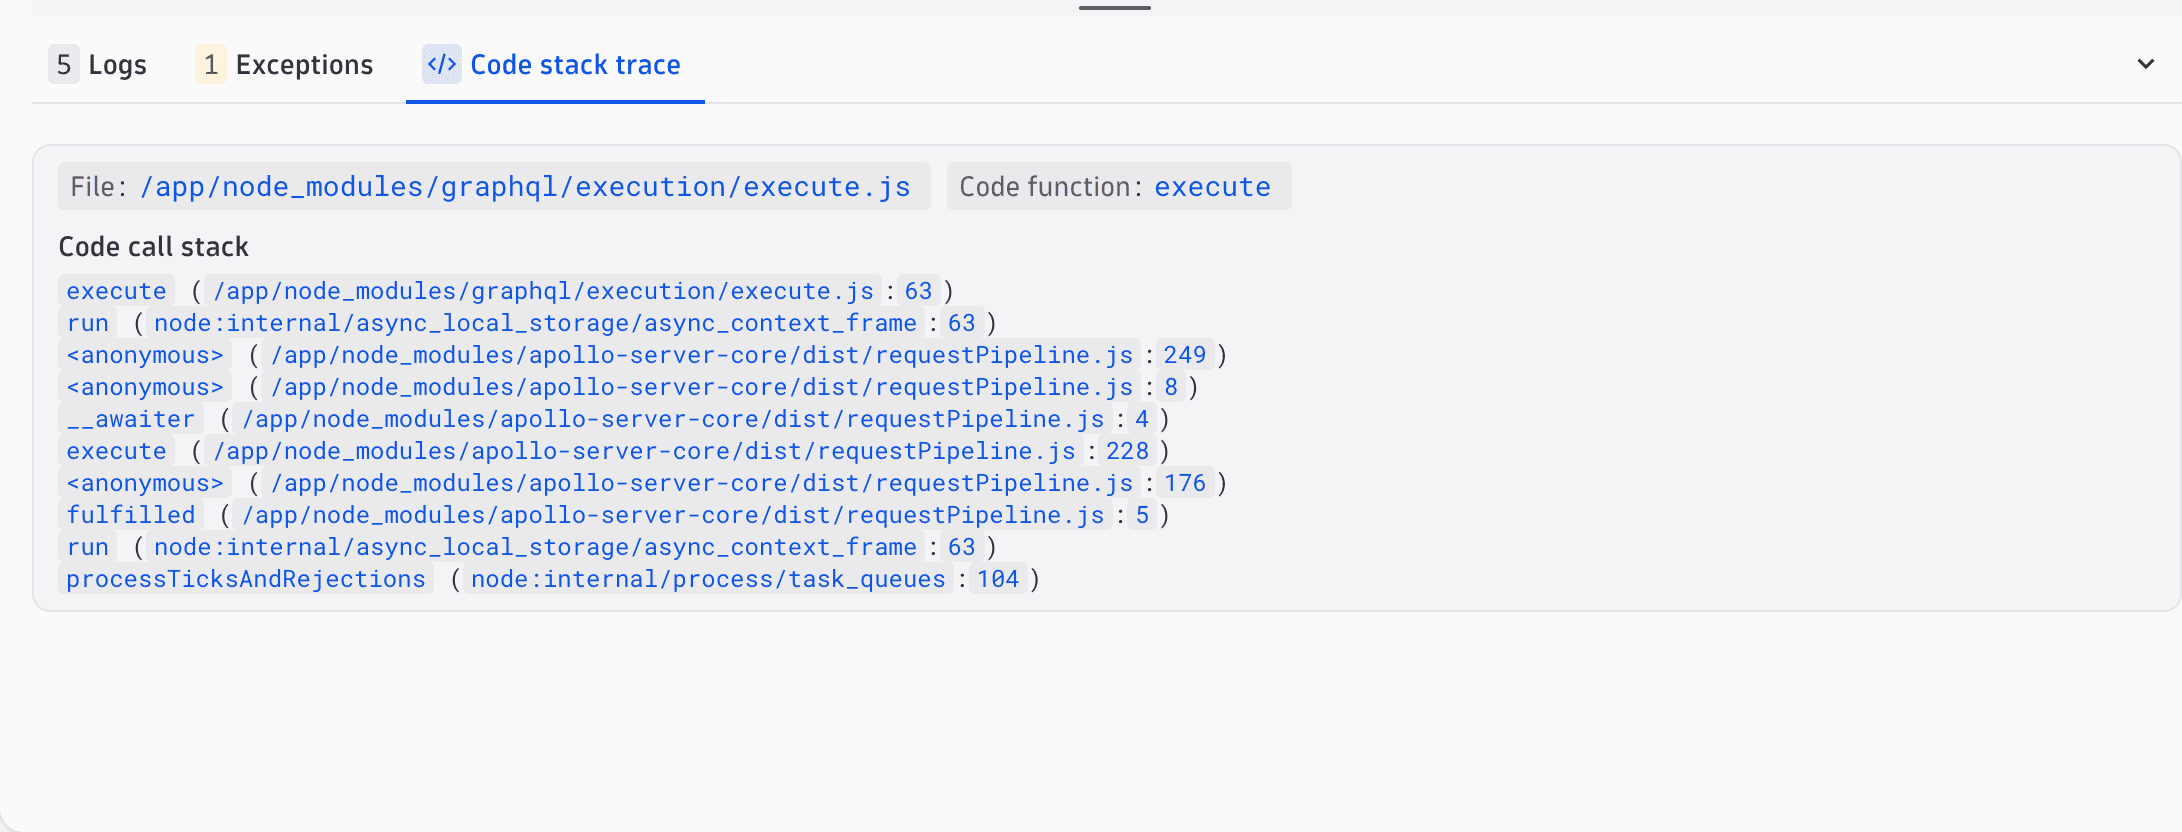
OneAgent captures execution call stacks for instrumented methods (spans) probabilistically. A new Code stack trace tab in the Span details panel in Distributed Tracing surfaces this data directly in your trace analysis workflow, revealing exactly which code ran for a given method.
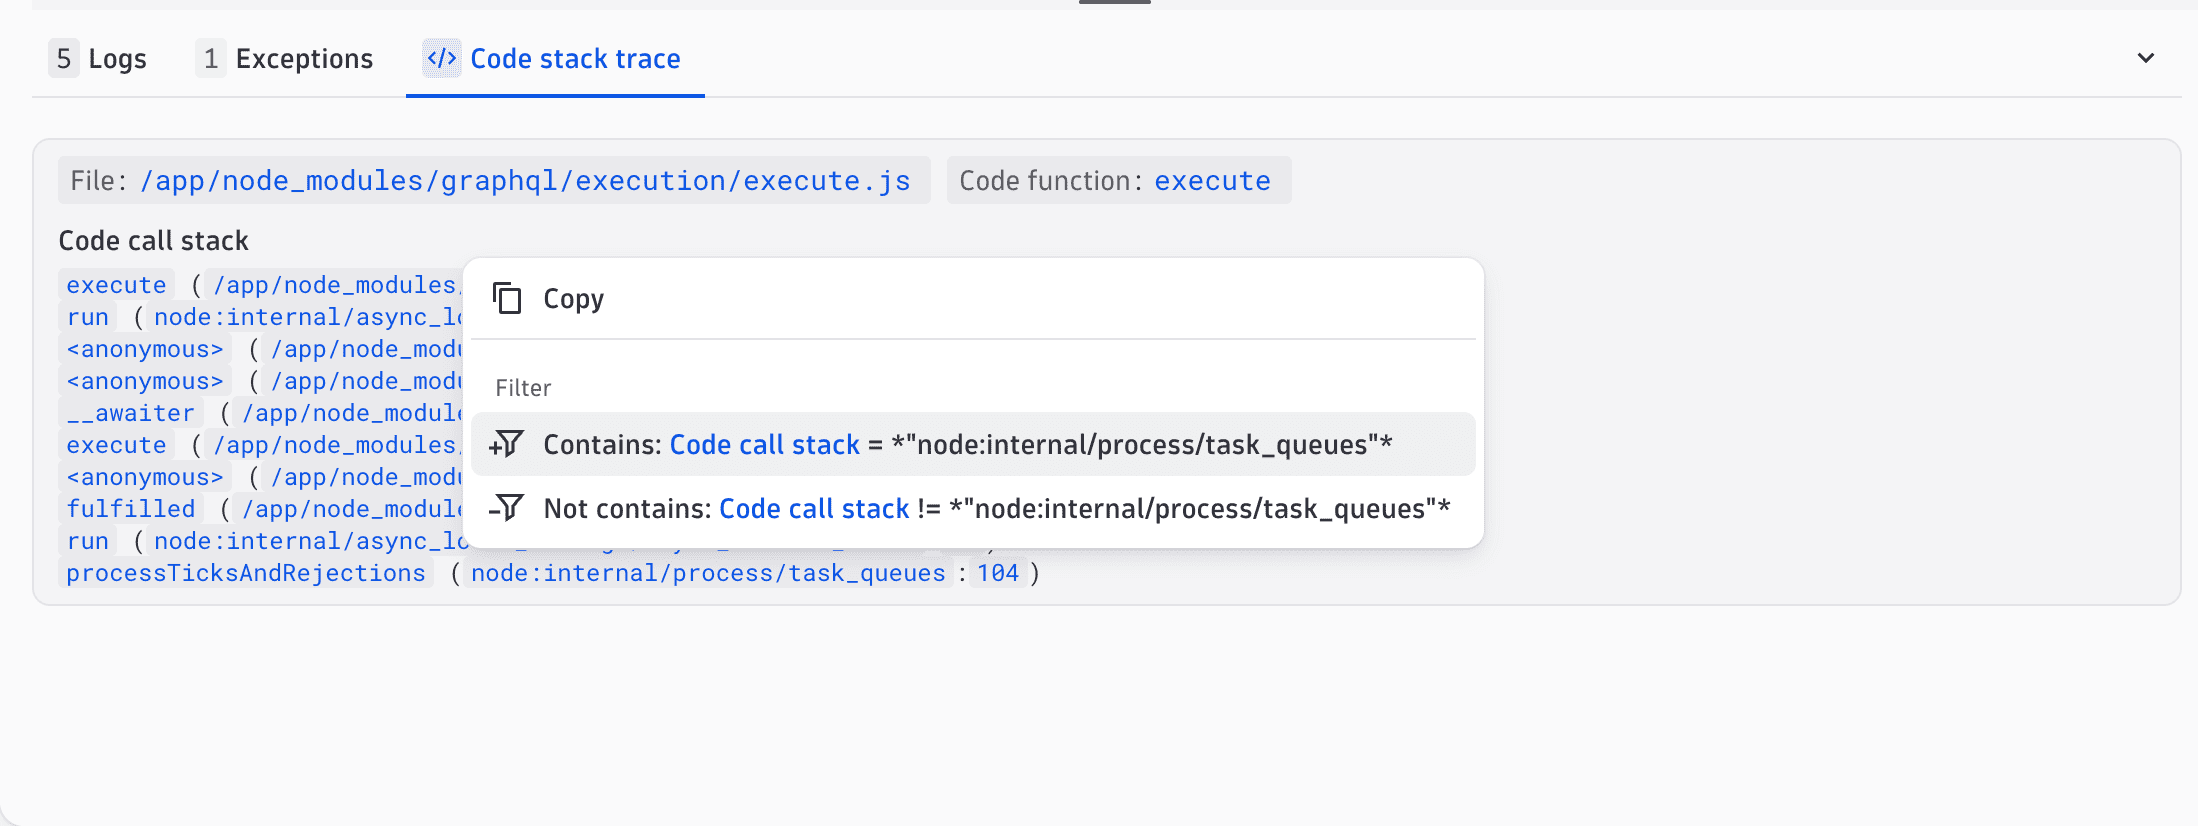
In the Code stack trace tab, you can interactivly filter for other spans that contain the same attributes.
Application Observability
Classic configs support trace-based primary_tags
Request Naming, Service Detection Rules, Failure Detection and Request Attributes now support trace-based primary_tags.* values in the Process group tag condition field.
Business Analytics
Support bucket defintion on  Business Flow configuration
Now, in the Business Flow edit mode, it's possible to restrict business flow analysis to one or more specific business event buckets (up to 10 selected buckets), so all DQL queries will scan a smaller amount of bytes, increasing performance in the queries and reducing DPS license consumption on every run. This new filter based on the business events buckets applies to the whole application (edit and analytics) and, additionally, it injects the filter in the DQL queries when defining alerts for the main KPIs for anomaly detection.
Cost Intelligence
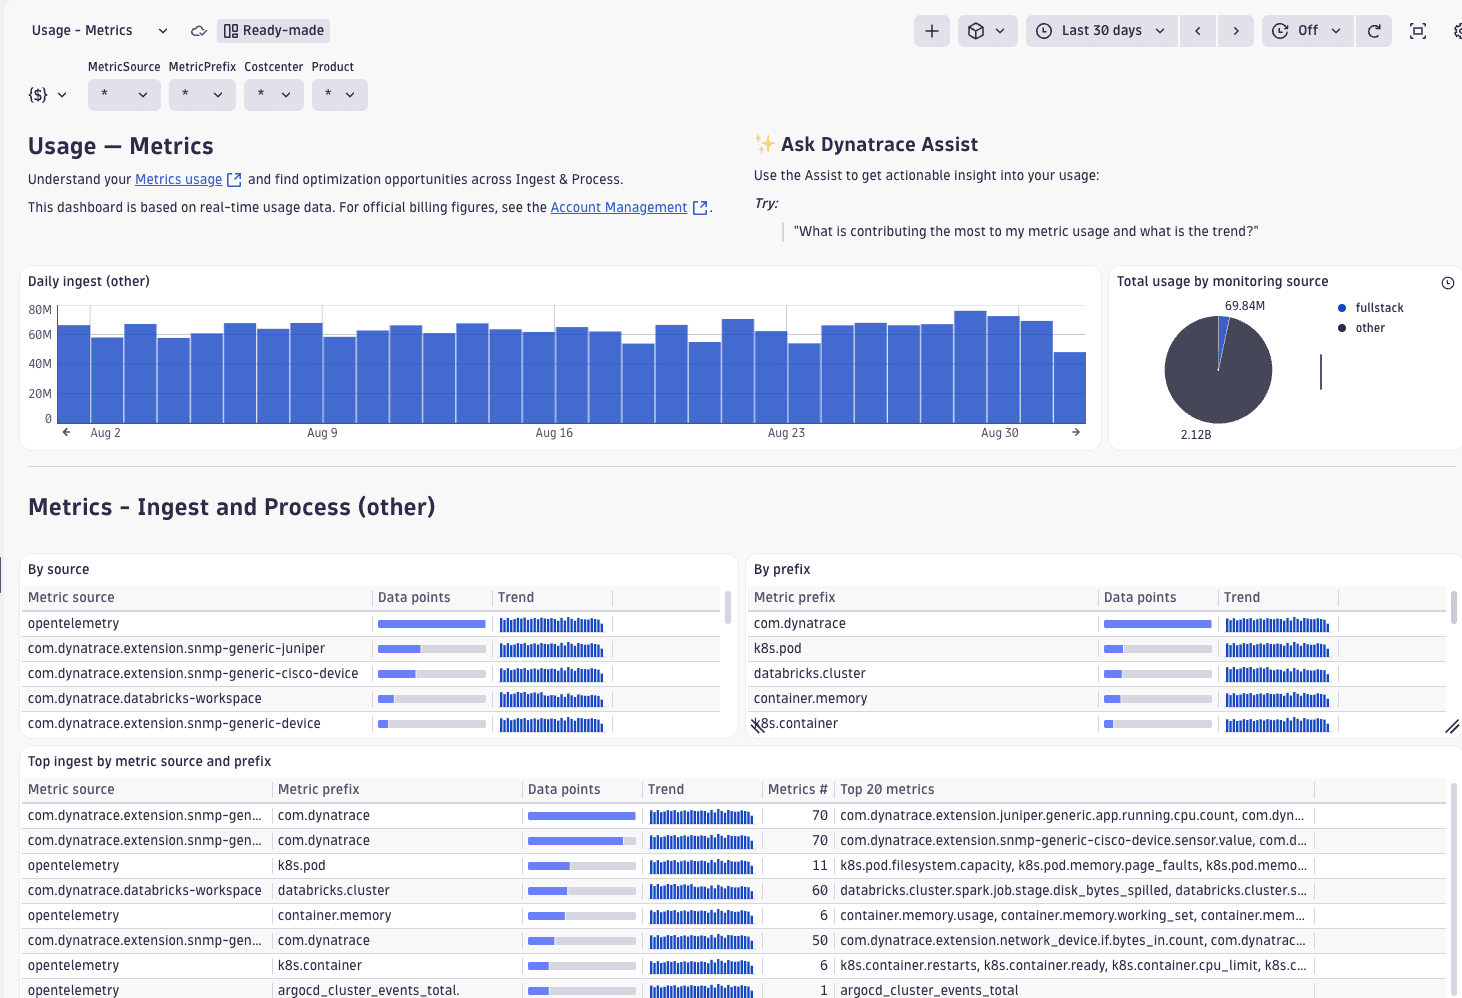
Understand and optimize metrics usage with the new Usage - Metrics ready-made dashboard
View, allocate, and predict your metrics usage across the platform with the new Usage - Metrics ready-made dashboard. The new dashboard provides you with a more granular breakout of a metric by source, down to the metric prefix key. This will help you better:
-
Spot metrics ingest spikes—identify sudden increases in ingest activity and dive into the source.
-
Drill-down by the metric source and cost allocation, down to the metric key.
-
Optimize your metrics cost by identifying unnecessary metrics for ingest, using the Dynatrace Assist along with the Best practices for optimizing metrics cost guide.
Find the new dashboard at Dashboards > Ready-made dashboards > Usage - Metrics.
Cost Intelligence
Davis AI events are now usage tracked when routed to a non-default bucket
Davis AI events are now usage tracked if they're routed to a bucket other than default_davis_events.
When the events ingest usage tracking is updated, this can be visible on environment-level usage tracking, where one 15-min timeframe has less usage, and the next 15-min interval has more usage. The total usage stays the same.
Cost Intelligence
Cost allocation for event ingest on the environment level
Cost allocation for event ingest is now activated on the environment level. For details, see Allocate.
Data Observability
New definity extension for data observability
The new definity extension is introduced. It ingests pipeline health, performance, and cost data into Dynatrace, giving you visibility into your lakehouse and Spark pipeline ecosystem.
Digital Experience | Product Analytics
Future-proof monitoring with Java 17 and Java 11 support
app-executor now compiles, builds, and runs on Java 11. machine-provider-client 4.0.0 also supports Java 11.
Digital Experience | Users & Sessions
Mobile session bounce classification
Mobile sessions now support bounce classification using the same definition as web sessions. A session is considered bounced when a user makes a visit without performing any significant activity.
Requires Mobile agent version 8.343+.
Infrastructure Observability | AWS
Topology and metrics for newly supported AWS services
With the New Cloud Platform Monitoring for AWS, Dynatrace now collects topology information and metrics for more AWS services and more resources. This gives you immediate visibility into services that previously may have required custom configuration with the Ingest any AWS metrics toggle.
- Newly supported AWS services: Amazon Bedrock (
AWS/Bedrock), Amazon Polly (AWS/Polly), Amazon Rekognition (AWS/Rekognition), Amazon Route 53 Resolver (AWS/Route53Resolve), Amazon SES (AWS/SES), AWS Systems Manager Run Command (AWS/SSM-RunCommand), Amazon Textract (AWS/Textract), AWS Transfer Family (AWS/Transfer), AWS Trusted Advisor (AWS/TrustedAdvisor), AWS Usage (AWS/Usage), and Amazon WorkSpaces (AWS/WorkSpaces). - New resource types: AWS DataSync agents (
AWS::DataSync::Agent), AWS Transfer Family servers (AWS::Transfer::Server), Amazon WorkSpaces directories (AWS::WorkSpaces::Directory), and Amazon WorkSpaces workspaces (AWS::WorkSpaces::Workspace).
For more information, see Integrated AWS cloud services.
To receive topology data and metrics for the newly supported services and resources, update your existing AWS connections. For details, see Update AWS connections.
Infrastructure Observability | Infrastructure & Operations
Navigate from  Infrastructure & Operations to related data in other apps
Infrastructure & Operations now includes navigation options to related data in other apps, including  Logs,
Logs,  Clouds,
  Kubernetes, and
  Services. Your active filters, timeframe, and segments carry over automatically, so you land in the target app with your context already applied.
Platform
Increased default limit for custom Grail buckets
Dynatrace now supports up to 250 custom Grail buckets by default, supporting the most common data partitioning needs.
Platform
Workload Identity Federation (WIF) support for Dynatrace OpenTelemetry Collector
Workload Identity Federation (WIF) enables secure, credential-free authentication when exporting telemetry to external services and APIs. It removes the need for long-lived credentials in Dynatrace OpenTelemetry Collector deployments, following modern cloud-native security practices.
Platform
Support for React 19 in Strato components packages
Strato components packages now support React 19.
Platform | Dashboards
Separate display name for  Dashboards variables
Dashboards variables now have two distinct fields:
- Name: A free-text, human-readable label shown in the UI (for example,
Host name,Time range from). No symbol restrictions apply. - Key: The code identifier used in DQL and code references (for example,
$host_name). Key rules are unchanged: alphanumeric, nodt_prefix, must be unique.
How it works
- When creating a variable, the key is auto-generated from the name as you type in the variables form (for example,
Host namebecomeshost_name), with uniqueness guaranteed automatically. - The variable list and variable toolbar now display the name instead of the key.
- A new Copy key
$<key>action menu entry allows you to copy a variable's key, since the key is no longer prominently shown in the UI.
Migration
Existing variables are automatically migrated: The current key value is used to populate the new name field. No manual action is required.
What's not changing
- DQL and code references continue to use the key (for example,
$hostName), not the name. Existing references remain valid. - Names don't need to be unique—multiple variables can share the same name.
Platform | DQL
Write DQL queries faster with smarter autocomplete and inline help
The DQL editor now provides intelligent autocomplete and contextual guidance, helping you write queries more efficiently without switching to documentation. Suggestions are smarter, easier to distinguish, and ranked by real-world usage patterns.
Platform | Dynatrace Assist
Dynatrace Assist: Embedded conversation starters now support agentic mode
Conversation starters embedded across Dynatrace apps now launch the full Dynatrace Intelligence agentic AI, not just a generative AI answer. When you start a conversation from inside an app, Dynatrace Assist can reason over tools and your live environment data to investigate and analyze, instead of only retrieving and summarizing a response.
Existing conversation starters are upgraded from generative to agentic AI out of the box, so all the in-app entry points you already use become more capable. All you need to do is ensure that you have Agentic AI activated in the environment settings.
Apps tailor each embedded conversation starter by defining the prompt, supplementary context, and additional instructions behind the trigger, so every conversation opens already framed for the task at hand.
In case these conversations run into PII blocking, admins now also have the ability to configure which PII patterns, if any, should be blocked in.
Platform | OpenPipeline
Reserve dt.bindplane.* fields exclusively for Bindplane
The dt.bindplane.* namespace is now reserved exclusively for Bindplane. Dynatrace uses it to populate fields such as dt.bindplane.project, dt.bindplane.fleet, and dt.bindplane.configuration to identify the Bindplane project, fleet, and configuration from where a record is originated. Reserving the namespace ensures these values are always set and interpreted consistently.
Platform | Problems
Propagated problem fields store only the latest event field value
Propagated problem fields now store only the most recent event field value—they don't accumulate all historical values of an event field (for example, trace_id), rather they save only the latest value.
Breaking changes
Application Observability
Improved derived http.route for SDv2 for OneAgent feature
SDv2 now derives a http.route in cases where OneAgent sent the fallback value of /*.
Application Observability | Distributed Tracing
HTTP failure detection extended to FaaS services
HTTP failure detection now applies to FaaS services (AWS Lambda, Azure Functions, and GCP Cloud Functions) with HTTP data. After this update, you may see a higher failure rate in your environment. This is expected—issues with these services are now detected and reported for the first time.
Platform | Dashboards
Stricter validation for dashboards
Starting with Dynatrace version 1.346, Dynatrace applies stricter validation rules to dashboards and won't display dashboards that fail validation until you fix them.
Which dashboards are affected?
This will mainly affect dashboards created or modified via the API or external AI tools. Dashboards created and maintained using Dashboards can’t fail validation unless you modify them otherwise.
Action plan
To continue using a dashboard that fails validation, edit the JSON's dashboard. For read-only dashboards, contact the dashboard owner.
To edit directly in Dynatrace:
- Open the dashboard and select Edit JSON from the dashboard menu.
- Make your changes and select Save.
To edit in an external editor:
- Open the dashboard and select Edit JSON from the dashboard menu.
- Select Copy JSON to copy the full JSON.
- Paste it into your editor, make your changes, then copy the updated JSON.
- Paste the updated JSON back into the Edit JSON editor and select Save.
Platform | DQL
Size limit for sorting and grouping keys in DQL queries
We now enforce a per-record size limit on field values used as sorting or grouping keys in DQL queries (such as sort, summarize, and makeTimeseries with by:).
- Queries where sorting/grouping key values exceed the limit on one or more records will return a client-side error.
- Queries with appropriately-sized keys are unaffected and benefit from improved performance.
Action plan: If your queries use potentially large fields (like log content) as sorting or grouping keys:
- Use extracted subfields instead of full content fields.
- Apply truncation or hashing functions to reduce key size.
Fixes and maintenance
Resolved issues in this release (SaaS)
- Reduced log noise from repeated warnings about Kafka partition watermark updates during normal operation. (PPX-14240)
- DQL processor performance validation now runs whenever the DQL query, matcher query, or enabled state changes. (PPX-14096)
- In
 Notebooks, section type tooltips (such as DQL and Code) now include proper name and role information for assistive technologies. (PAPA-35378)
 - Form fields in Notebooks now have persistent visual labels, including for the Can view and Share link fields. (PAPA-35118)
- Search results (from the dock) are now announced to screen readers, and error messages are announced immediately when they appear. (PAPA-35117)
- In Clouds, filter names now match Grail field names (for example,
cloud.providerinstead ofCloud provider) for consistent 1:1 alignment with fields available on Grail. (INFOBS-12315) - Fixed wrong default timeframe selector value in opinionated dashboards in the Clouds Experience section of Clouds. (INFOBS-11479)
- Removed a misleading warning that incorrectly occurred when creating a new environment in
 Fleet Management. (ICP-8129)
 - Fixed an issue where service restarts cleared metric sharding recovery buffers due to a timestamp precision mismatch, causing scale-down and revert operations to be delayed by a full recovery window after each restart. (GRAIL-55296)
- Fixed an issue where
 Smartscape nodes were not created when
 device.portwas not configured in the extension. Metrics and logs now defaultdevice.portto0when the dimension is absent. (DXS-7369) - Fixed an issue where repaired Databricks job runs were ingested as duplicates after a 36-hour cache expiry. Repaired jobs are now recognized immediately and reported once, with metrics and a distributed trace scoped to the re-run tasks. Use the new
databricks.job.is_repairattribute to filter and distinguish repair runs from original job runs. (DXS-7313) - Fixed a rare issue where resolved Davis problems incorrectly reopened. The latest problem state in
dt.davis.problemswas missing event IDs from before the resolution, causing the problem to appear as new. (DI-30690) - Fixed an issue where
dt.davis.impact_levelshowed Environment instead of Frontend for problems affecting frontend entities. (DI-30432) - Fixed an issue in Dynatrace Assist where WebSocket connection rate limiting did not take into account active feature flag settings, causing connections to be incorrectly throttled. (DI-30239)
- Fixed an error that occurred when filtering problems using a search string that contained many special characters. (DI-30187)
- Fixed an issue where the monitor generation pipeline ignored the user-specified limit and always generated the default number monitors. Generation now stops once the requested number is reached. (DEM-30567)
- Fixed an issue where the Session Replay player in
 Users & Sessions was clipped or cut off when the browser zoom level was set to 110% or higher. The player now renders correctly at zoom levels up to 150%. (DEM-30038)
 - Fixed an extra divider line that appeared below the page description on tabbed
 Settings pages, including Data Privacy, Instrumentation, Data Scope & Enrichment, Enablement & Cost Control, and Reference Settings. (DEM-30028)
 - Fixed an issue where the
builtin:cloud.azure.vmScaleSet.vms.runningmetric did not reflect a scale-down to zero instances in Azure VM Scale Sets. (DAQ-28123) - Fixed an issue where navigating from
 Services Classic to the latest Services via the Try new app banner reset the selected timeframe to the default instead of carrying it over. (APPOBS-38444)
 - Fixed an issue where the search icon in the search field appeared in the wrong color, inconsistent with the current theme. (APPOBS-37463)
- Fixed an issue where running
dt-app devagainst a dev-stage environment failed with an HTTP 403 error when the AppShell runtime used a pre-release version containing.or+characters (for example,2.346.0-dev.1234567890). (APPDEV-19288) - Fixed an issue where GaugeChart would crash if two or more
ThresholdIndicatorcomponents shared the same value. (APPDEV-19230) - Fixed an issue in XYChart where the
colorRulecolorPaletteonBarSeriesapplied the palette's first color to every matching bar instead of the color corresponding to each bar's series index. (APPDEV-19198) - Improved accessibility of canvas-based charts by ensuring screen readers can associate a visible tooltip with the chart canvas. (APPDEV-18971)