Allocate
- Latest Dynatrace
- Explanation
- 3-min read
Cost Allocation is exclusively available for Dynatrace SaaS environments with a Dynatrace Platform Subscription (DPS) licensing agreement that was signed after April 2023.
Cost allocation lets you assign Dynatrace DPS usage to customer-defined cost centers, products, or both. This gives you a transparent and detailed account of each cost center's Dynatrace expenditures and helps your organization optimize its budgets.
You can customize the use of these fields to fit your company's organizational framework:
- Data is collected from all OneAgents deployed on hosts or Kubernetes pods.
- Additionally, ingested telemetry data (traces and logs) can be collected in certain infrastructure setups (for example, via Logs API or Kubernetes metadata enrichment).
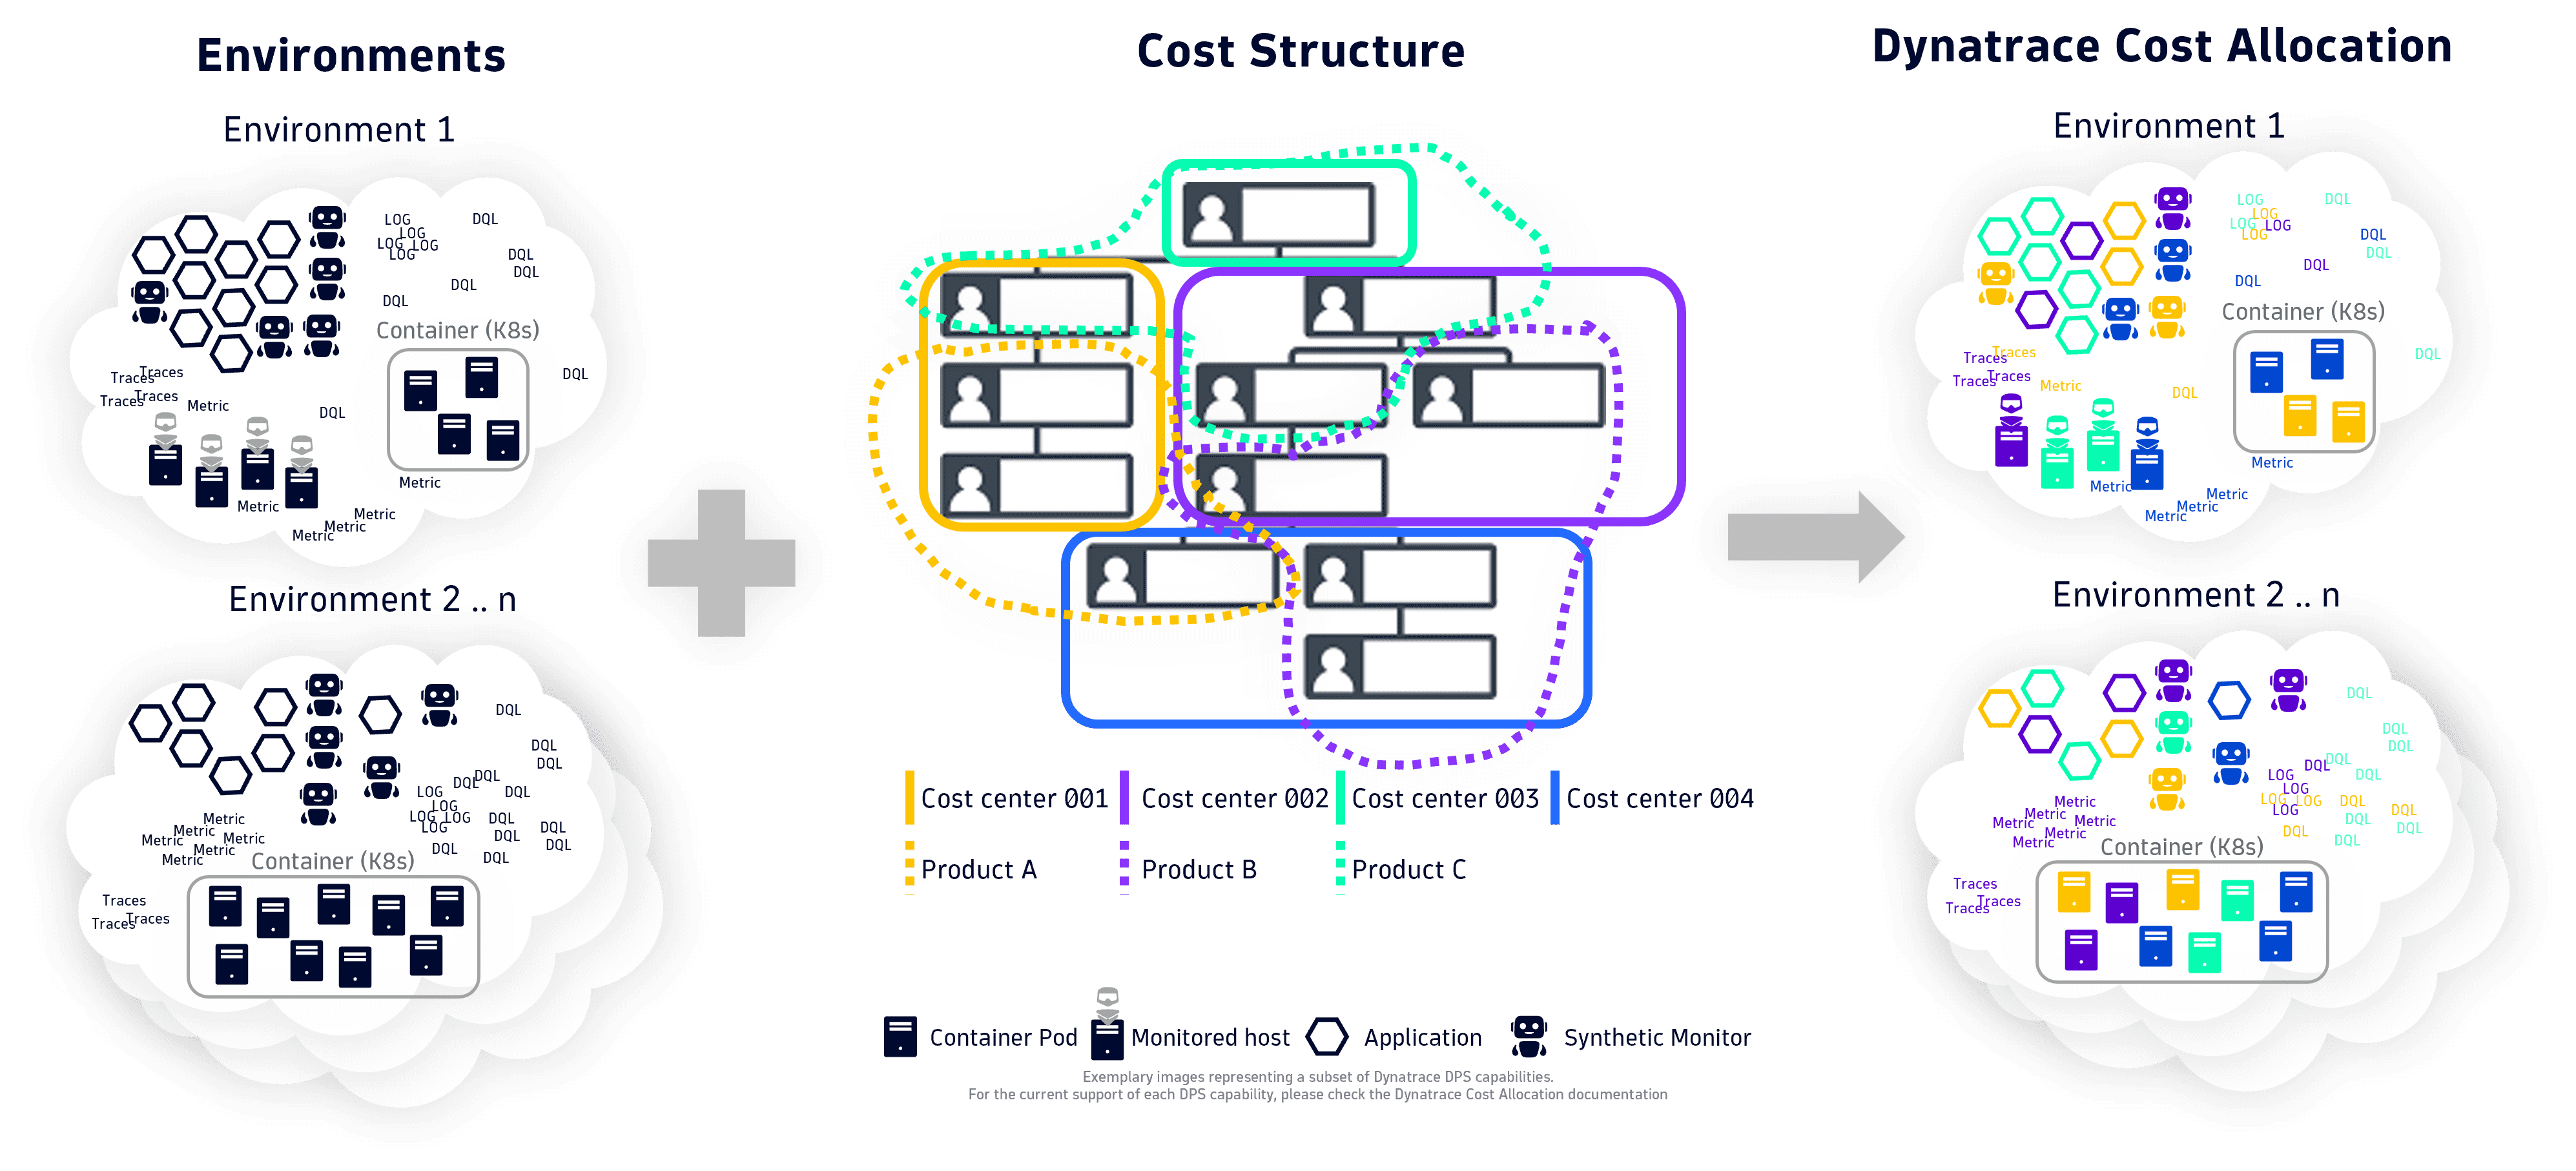
- Costs can be allocated to customer-defined cost centers, products, or both.
- Data can be analyzed in Dynatrace via DQL,
 Dashboards, or
  Notebooks, or exported for viewing and editing in tools such as Excel and Power BI.
The figure below shows how different components in a given Dynatrace environment can be assigned to different cost centers and products.
Overview
Cost allocation maps Dynatrace consumption to the cost centers, products, or teams in your organization. With allocations in place, every line item on your bill has a clear owner, which is the foundation for chargeback, showback, and team-level accountability. Allocation is enforced through tags applied at the OneAgent, Kubernetes, or telemetry-ingest layer, and analyzed in Dynatrace or exported for finance tooling.
To learn more about how to plan your tagging strategy, see Plan your tagging strategy.
Concepts
- Cost center
A specific cost center within your organization. This is defined according to your organizational structure. Costs in Dynatrace can be allocated to specific cost centers.
- Host tag
The parameter that assigns a host to a specific cost center or product. For more information, see Configure cost allocation.
- Host property
Sometimes used as a synonym for "host tag." For more information, see Configure cost allocation.
- Product
A single product, or group of products, offered by your organization. Costs in Dynatrace can be allocated to specific products.
- Telemetry data
Generic term to refer to any single data point that is one of the following: log, trace, metric, or event.
Supported capabilities
The table below describes the rate card capabilities for which Cost Allocation is available.
-
Account level: You can extract the Cost Allocation data from your Account Management Portal, giving you an overview across all of your environments. Account data can be exported for use in external tools, such as Excel or Power BI, see Export Cost Allocation data.
-
Environment level: You can view and analyze Cost Allocation from within each of your environments.
Capabilities marked with a footnote (✅1) require additional manual configuration for environment-level viewing and analysis.
In the case that Cost Allocation isn't available for the given capability, an alternative best practice is recommended.
| Category | Capability | Account level | Environment level | Alternative best practice |
|---|---|---|---|---|
Application and Infrastructure Observability | Full-Stack Monitoring | ✅ | ✅ | |
Application and Infrastructure Observability | Infrastructure Monitoring | ✅ | ✅ | |
Application and Infrastructure Observability | Foundation & Discovery | ✅ | ✅ | |
Application and Infrastructure Observability | Mainframe Monitoring | Classic metrics | ||
Application and Infrastructure Observability | Database Monitoring | ✅ | ||
Container Observability | Kubernetes Platform Monitoring | ✅ 2 | Classic metrics | |
Container Observability | Code Monitoring | ✅ | ||
Log Analytics | Log - Ingest | ✅ | ✅ | |
Log Analytics | Log - Retain | ✅ | ✅ | |
Log Analytics | Logs - Retain with Included Queries | ✅ | ✅ | |
Log Analytics | Log - Query | ✅ 1 | ||
Telemetry | Metrics - Ingest | ✅ | ✅ | |
Telemetry | Metrics - Retain | Notebook available via Account Management | ||
Telemetry | Traces - Ingest | ✅ | ✅ | |
Telemetry | Traces - Retain | Notebook available via Account Management | ||
Telemetry | Traces - Query | ✅ 1 | ||
Telemetry | Events - Ingest | ✅ | ||
Telemetry | Events - Retain | Notebook available via Account Management | ||
Telemetry | Events - Query | ✅ 1 | ||
Application Security | Runtime Vulnerability Analytics | ✅ | ✅ | |
Application Security | Runtime Application Protection | ✅ | ✅ | |
Application Security | Security Posture Management | Notebook available via Account Management | ||
Real User and Synthetic Monitoring | Real User Monitoring | ✅ 1 | Notebook available via Account Management | |
Real User and Synthetic Monitoring | Real User Monitoring with Session Replay | ✅ 1 | Notebook available via Account Management | |
Real User and Synthetic Monitoring | Real User Monitoring Property | ✅ 1 | Notebook available via Account Management | |
Real User and Synthetic Monitoring | Browser Monitor or Clickpath | Classic metrics | ||
Real User and Synthetic Monitoring | Third-Party Synthetic API Ingestion | Classic metrics | ||
Real User and Synthetic Monitoring | HTTP Monitor | Classic metrics | ||
Agentic AppEngine | Standard Function Calls | ✅ 1 | ||
Automation | Automation Workflow | ✅ 1 | ||
Platform Extensions | Custom Metrics Classic | Please switch to Metrics powered by Grail | ||
Platform Extensions | Log Monitoring Classic | Please switch to Log Analytics | ||
Platform Extensions | Custom Traces Classic | Please switch to Traces powered by Grail | ||
Platform Extensions | Custom Events Classic | Please switch to Events powered by Grail | ||
Platform Extensions | Serverless Functions Classic | Please switch to Agentic AppEngine |
Additional manual configuration is required, see Configure user-based Cost Allocation for queries, Automation Workflow, and Standard Function Calls.
To attribute Kubernetes Platform Monitoring costs on the environment level, add Cost Allocation tags and then use the extended Cost Allocation dashboard or DQL to query Cost Allocation tags from the relevant host. For more information, see the Cost Allocation GitHub repo.
We're continuously extending Cost Allocation support to cover additional Dynatrace capabilities. For complete details regarding your licensing agreement, please contact your Dynatrace account manager. For more details about specific capabilities, see Monitoring consumption per capability.