What's new in Dynatrace SaaS version 1.330
- Release notes
- Rollout start on Jan 13, 2026
This page showcases new features, changes, and bug fixes in Dynatrace SaaS version 1.330. It contains:
Feature updates
Account Management
Generate platform tokens via the Account Management API
Users with the platform-token:tokens:manage permission can now easily create platform tokens using the Dynatrace Account Management API.
Generate platform tokens for either the logged-in user or any service user you have access to, ensuring seamless and efficient token management.
Account Management
Kubernetes Container Monitoring and Mainframe Monitoring usage details are available in Grail
Billing usage information is now seamlessly integrated into Grail, empowering you to create custom dashboards and notebooks for deeper insights into your resource consumption and costs.
Explore the enhanced capabilities for Kubernetes Container Monitoring and Mainframe Monitoring. Additionally, take advantage of the newly available Notebooks within the Account Management section to analyze related usage and cost details.
Account Management | Cost Management
Simplify cost tracking with log retention support in Cost Allocation
Cost Allocation now extends to support the following capabilities:
-
Log Management & Analytics – Retain
-
Log Management & Analytics – Retain (Query Included)
You can use them to attribute log retention costs to the correct teams, applications, or business units for enhanced transparency and accountability.
Key Benefits
-
Leverages existing configuration: automatically uses your current Cost Allocation ingest setup.
-
No additional setup required: start tracking log retention costs instantly.
-
Seamless Integration: Works seamlessly with your existing workflows, saving time and effort.
This enhancement ensures clear visibility into your log retention costs, empowering better cost management with minimal effort.
For details, see how to allocate DPS costs.
Account Management | Cost Management
New usage insights attributes for AppEngine functions
Billing usage events of type AppEngine Functions - Small now include two new usage insights attributes to enhance tracking and analysis:
-
workflow.id: Identifies the specific workflow associated with the billing event. -
workflow.execution.id: Tracks the unique execution instance of the workflow.
These attributes provide greater visibility into workflow-related usage, enabling more granular usage insights of billing events.
Account Management | Subscriptions and Licensing
Billing for dt.service metrics aligns with documented behavior
Previously, dt.service.* metrics were incorrectly zero-rated and not included in billing calculations.
With this update, dt.service.* metrics are billed in alignment with the existing published Metrics on Grail pricing, which states that these metrics are billable.
Application Observability
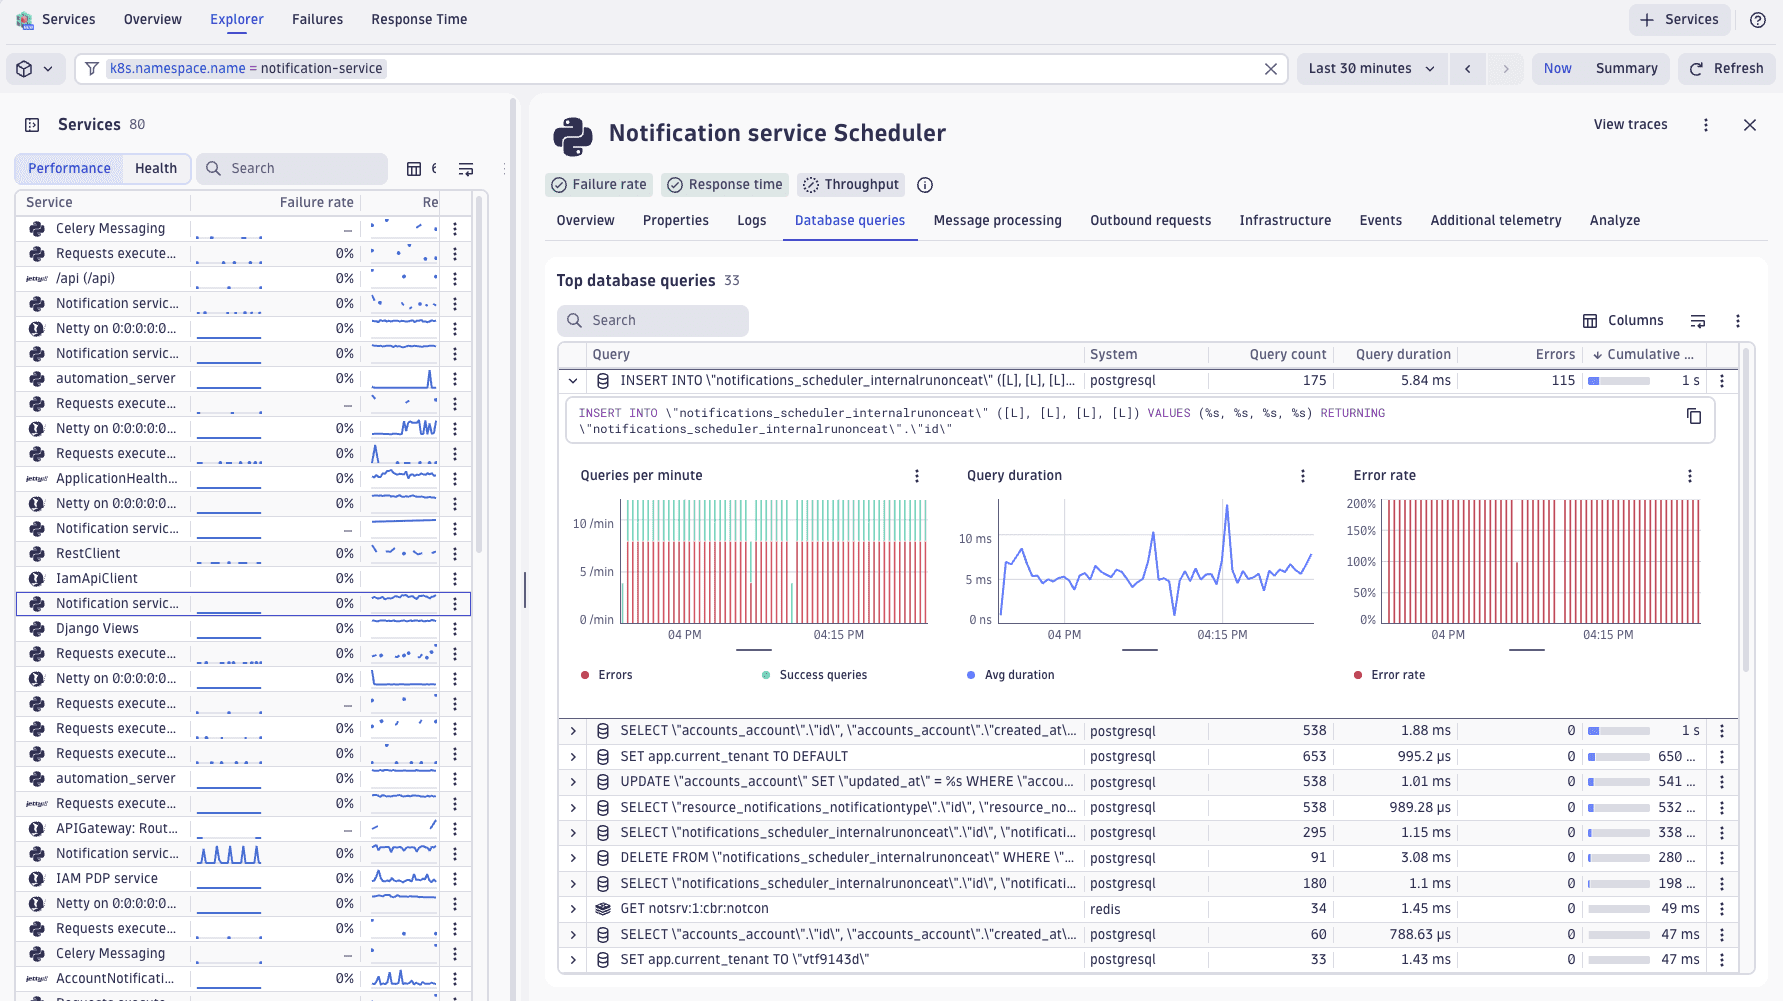
Pinpoint slow database queries across your services
Understanding how your services interact with databases is now seamless. You can see which database statements your services execute, how they perform, and which ones fail—all from a single view.
-
Discover your slowest queries ranked by execution time and frequency to identify where indexing or caching could improve performance.
-
Filter by service, endpoint, or Kubernetes metadata to focus your analysis, and export to
 Notebooks and
  Dashboards for deeper investigation.
Available for SQL databases and key-value stores like Redis, with full support for Grail-based querying.
Application Observability | Distributed Tracing
Built-in exception analysis in Distributed Tracing
The new Exceptions perspective in  Distributed Tracing offers a streamlined way to:
- Analyze exceptions and errors over time.
- Understand root causes and common patterns.
- Dive into aggregated stacktraces for full context.
- Identify impacted services and endpoints.
- Assess how exceptions contribute to service failures.
Drilldowns now redirect to this new perspective, which supports exceptions ingested via ![]() OpenTelemetry and
OpenTelemetry and  OneAgent. This enhancement simplifies exception analysis, enabling faster troubleshooting and improved reliability.
Application Observability | Live Debugger
Improved permission workflow in Dynatrace Desktop app
Chrome 142 introduced a mandatory local network access permission that can silently block the Dynatrace Desktop app when using Bitbucket on-premises repositories or local filesystem source configurations. Previously, a blocked permission produced a failed connection with no indication of the cause.
The Desktop app now detects the local network access permission state before attempting to connect. If the permission is blocked or not yet granted, a notification appears with a direct link to the relevant browser permission settings for your Dynatrace environment (no manual troubleshooting required).
Who is affected?
Users on Chrome 142 or later with Bitbucket on-premises or local filesystem source configurations. If local network access has already been granted, the connection flow remains unchanged.
Application Observability | Services
More meaningful endpoints for accurate baselining and alerting
With this update, you can:
-
Extract stable URL templates from raw paths when frameworks don't provide
http.route. -
Define patterns to group high-cardinality URLs into meaningful endpoints for accurate baselining and alerting.
Configure in Service Detection v2 settings.
Application Observability | Services
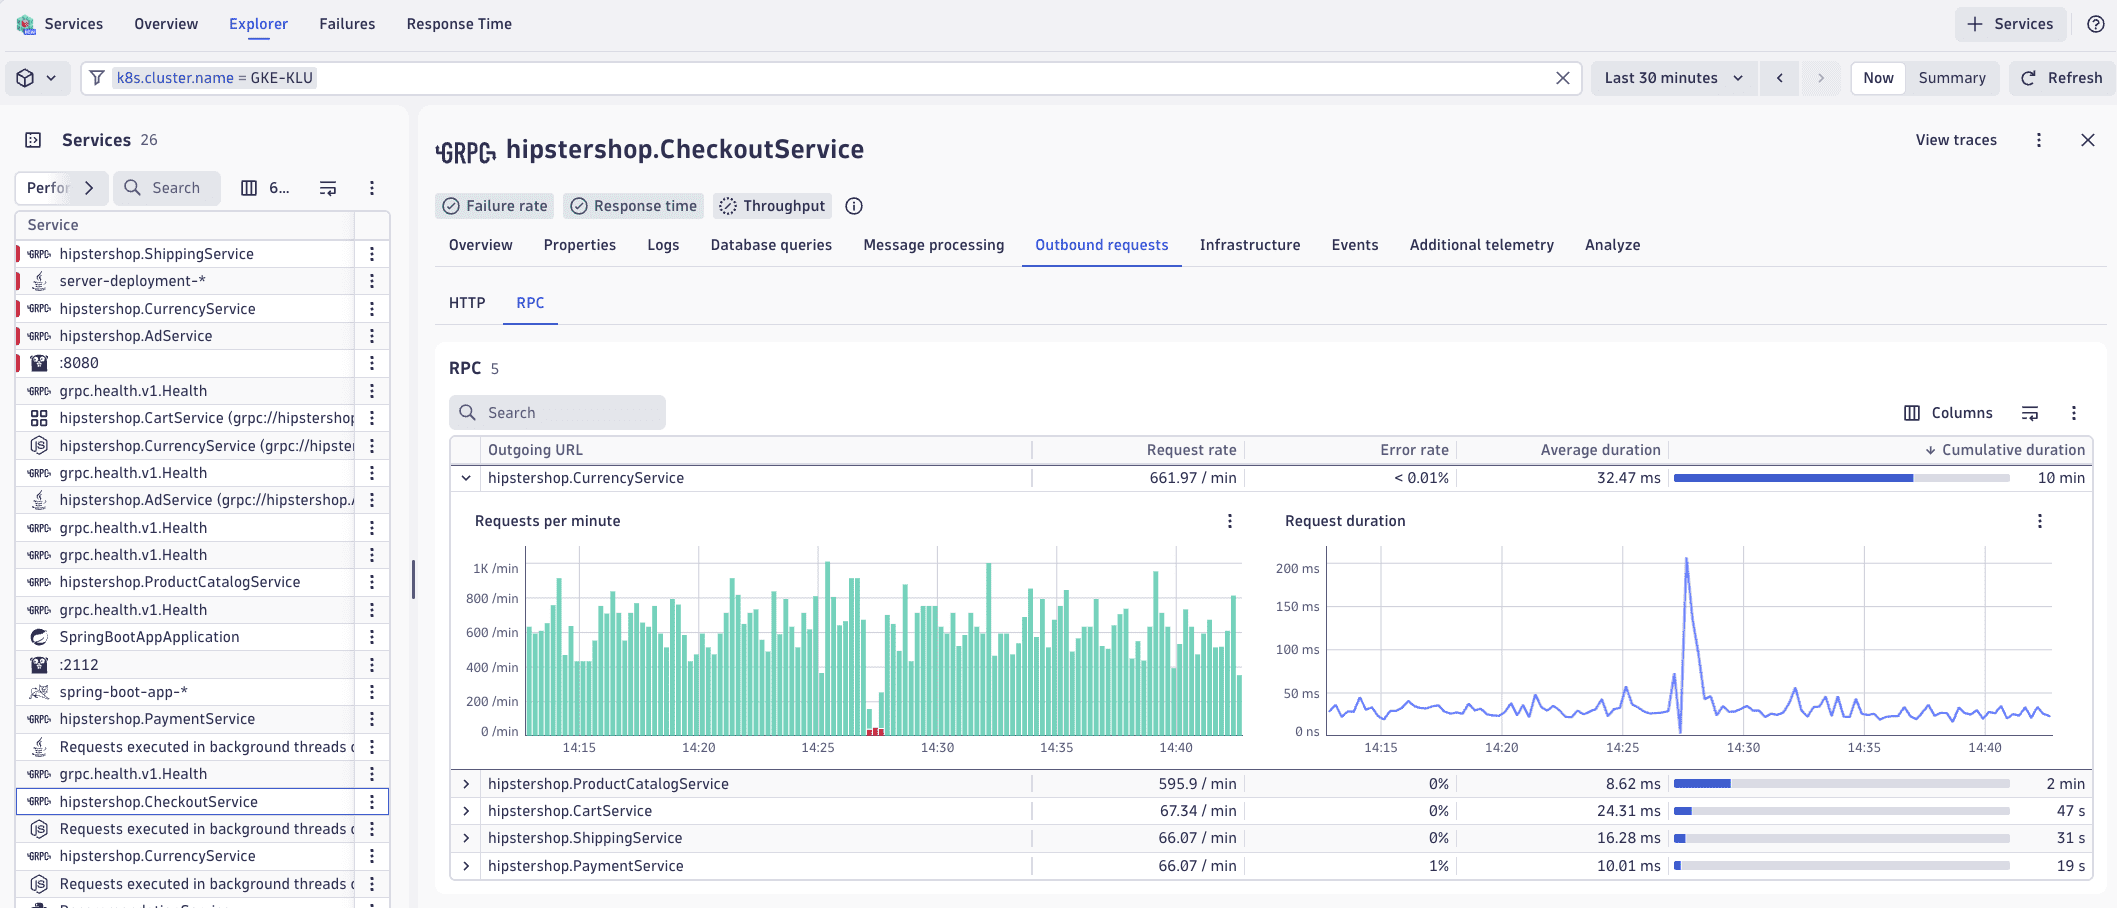
Quickly identify if performance issues stem from outbound calls
When troubleshooting service performance, you need to determine whether the problem lies within your service or in something it calls. Now you can view all outbound calls your service makes—HTTP, RPC/gRPC, and more—with metrics on frequency, response times, and error rates.
- Identify the slowest and most frequent outbound calls at a glance.
- Drill down into traces for deeper analysis.
- Export to Notebooks and Dashboards for reporting, or go directly to the downstream service when one is detected.
Application Observability | Services
Enhanced endpoints for Service Detection v1
This feature provides complete endpoint visibility for Service Detection v1 (SDv1) services. When this feature is on, all endpoints are shown in  Services without requiring you to configure key requests.
This feature is currently available only for new environments created in Dynatrace version 1.330+, and it is enabled by default. For existing environments, we plan to release it in Dynatrace version 1.333+.
Application Observability | Services
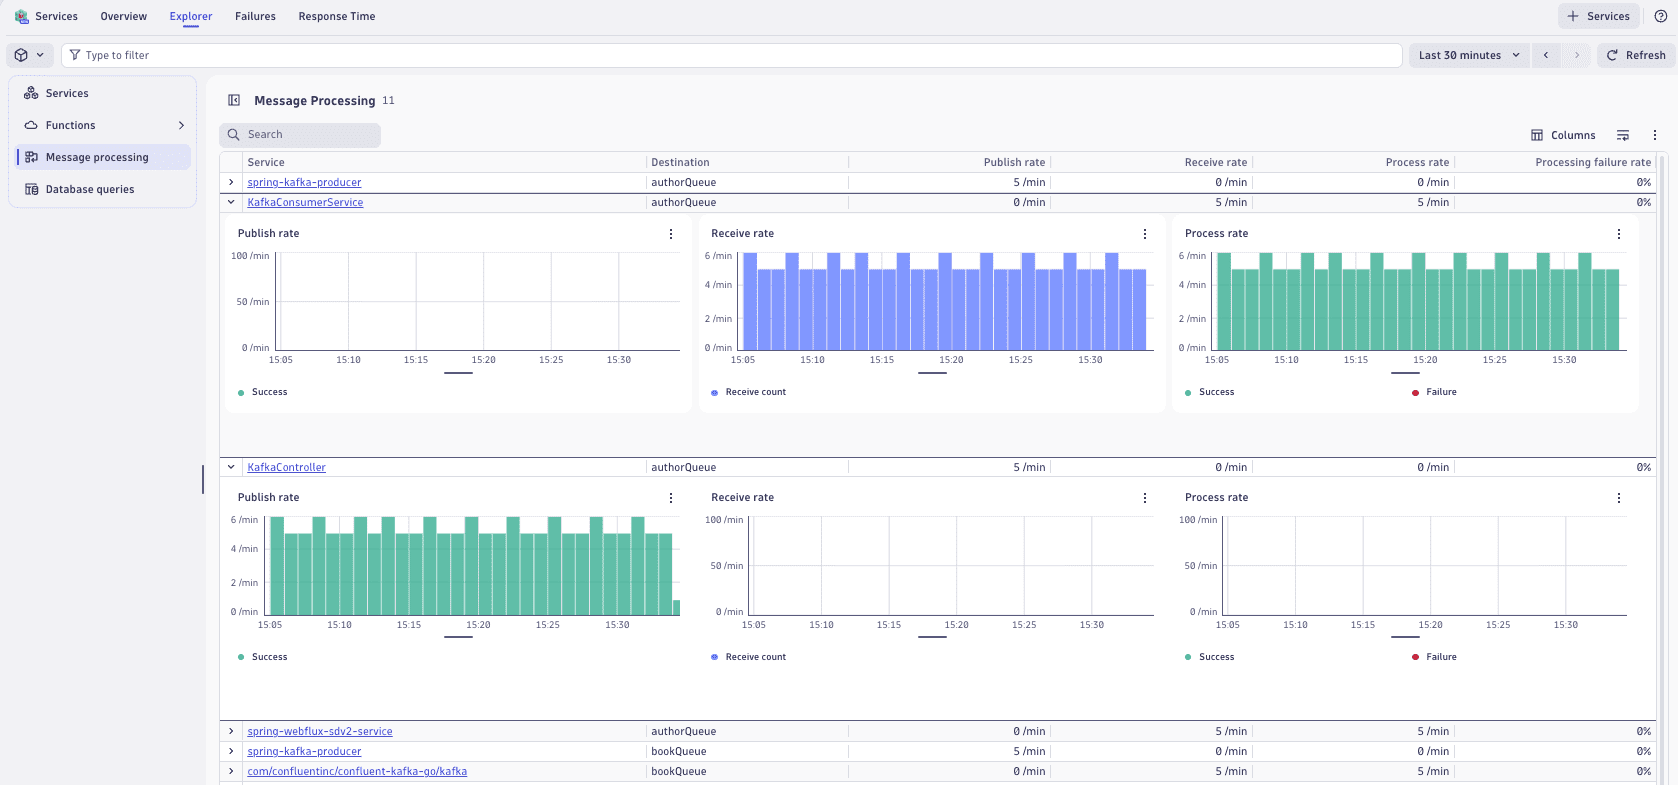
Gain full visibility into message processing across your services
In Services, you can now:
- Track message publish and receive rates, processing throughput, and failure rates across your services.
- Quickly spot bottlenecks and identify struggling services with full drill-down into Distributed Tracing for detailed insights.
Application Observability | Services
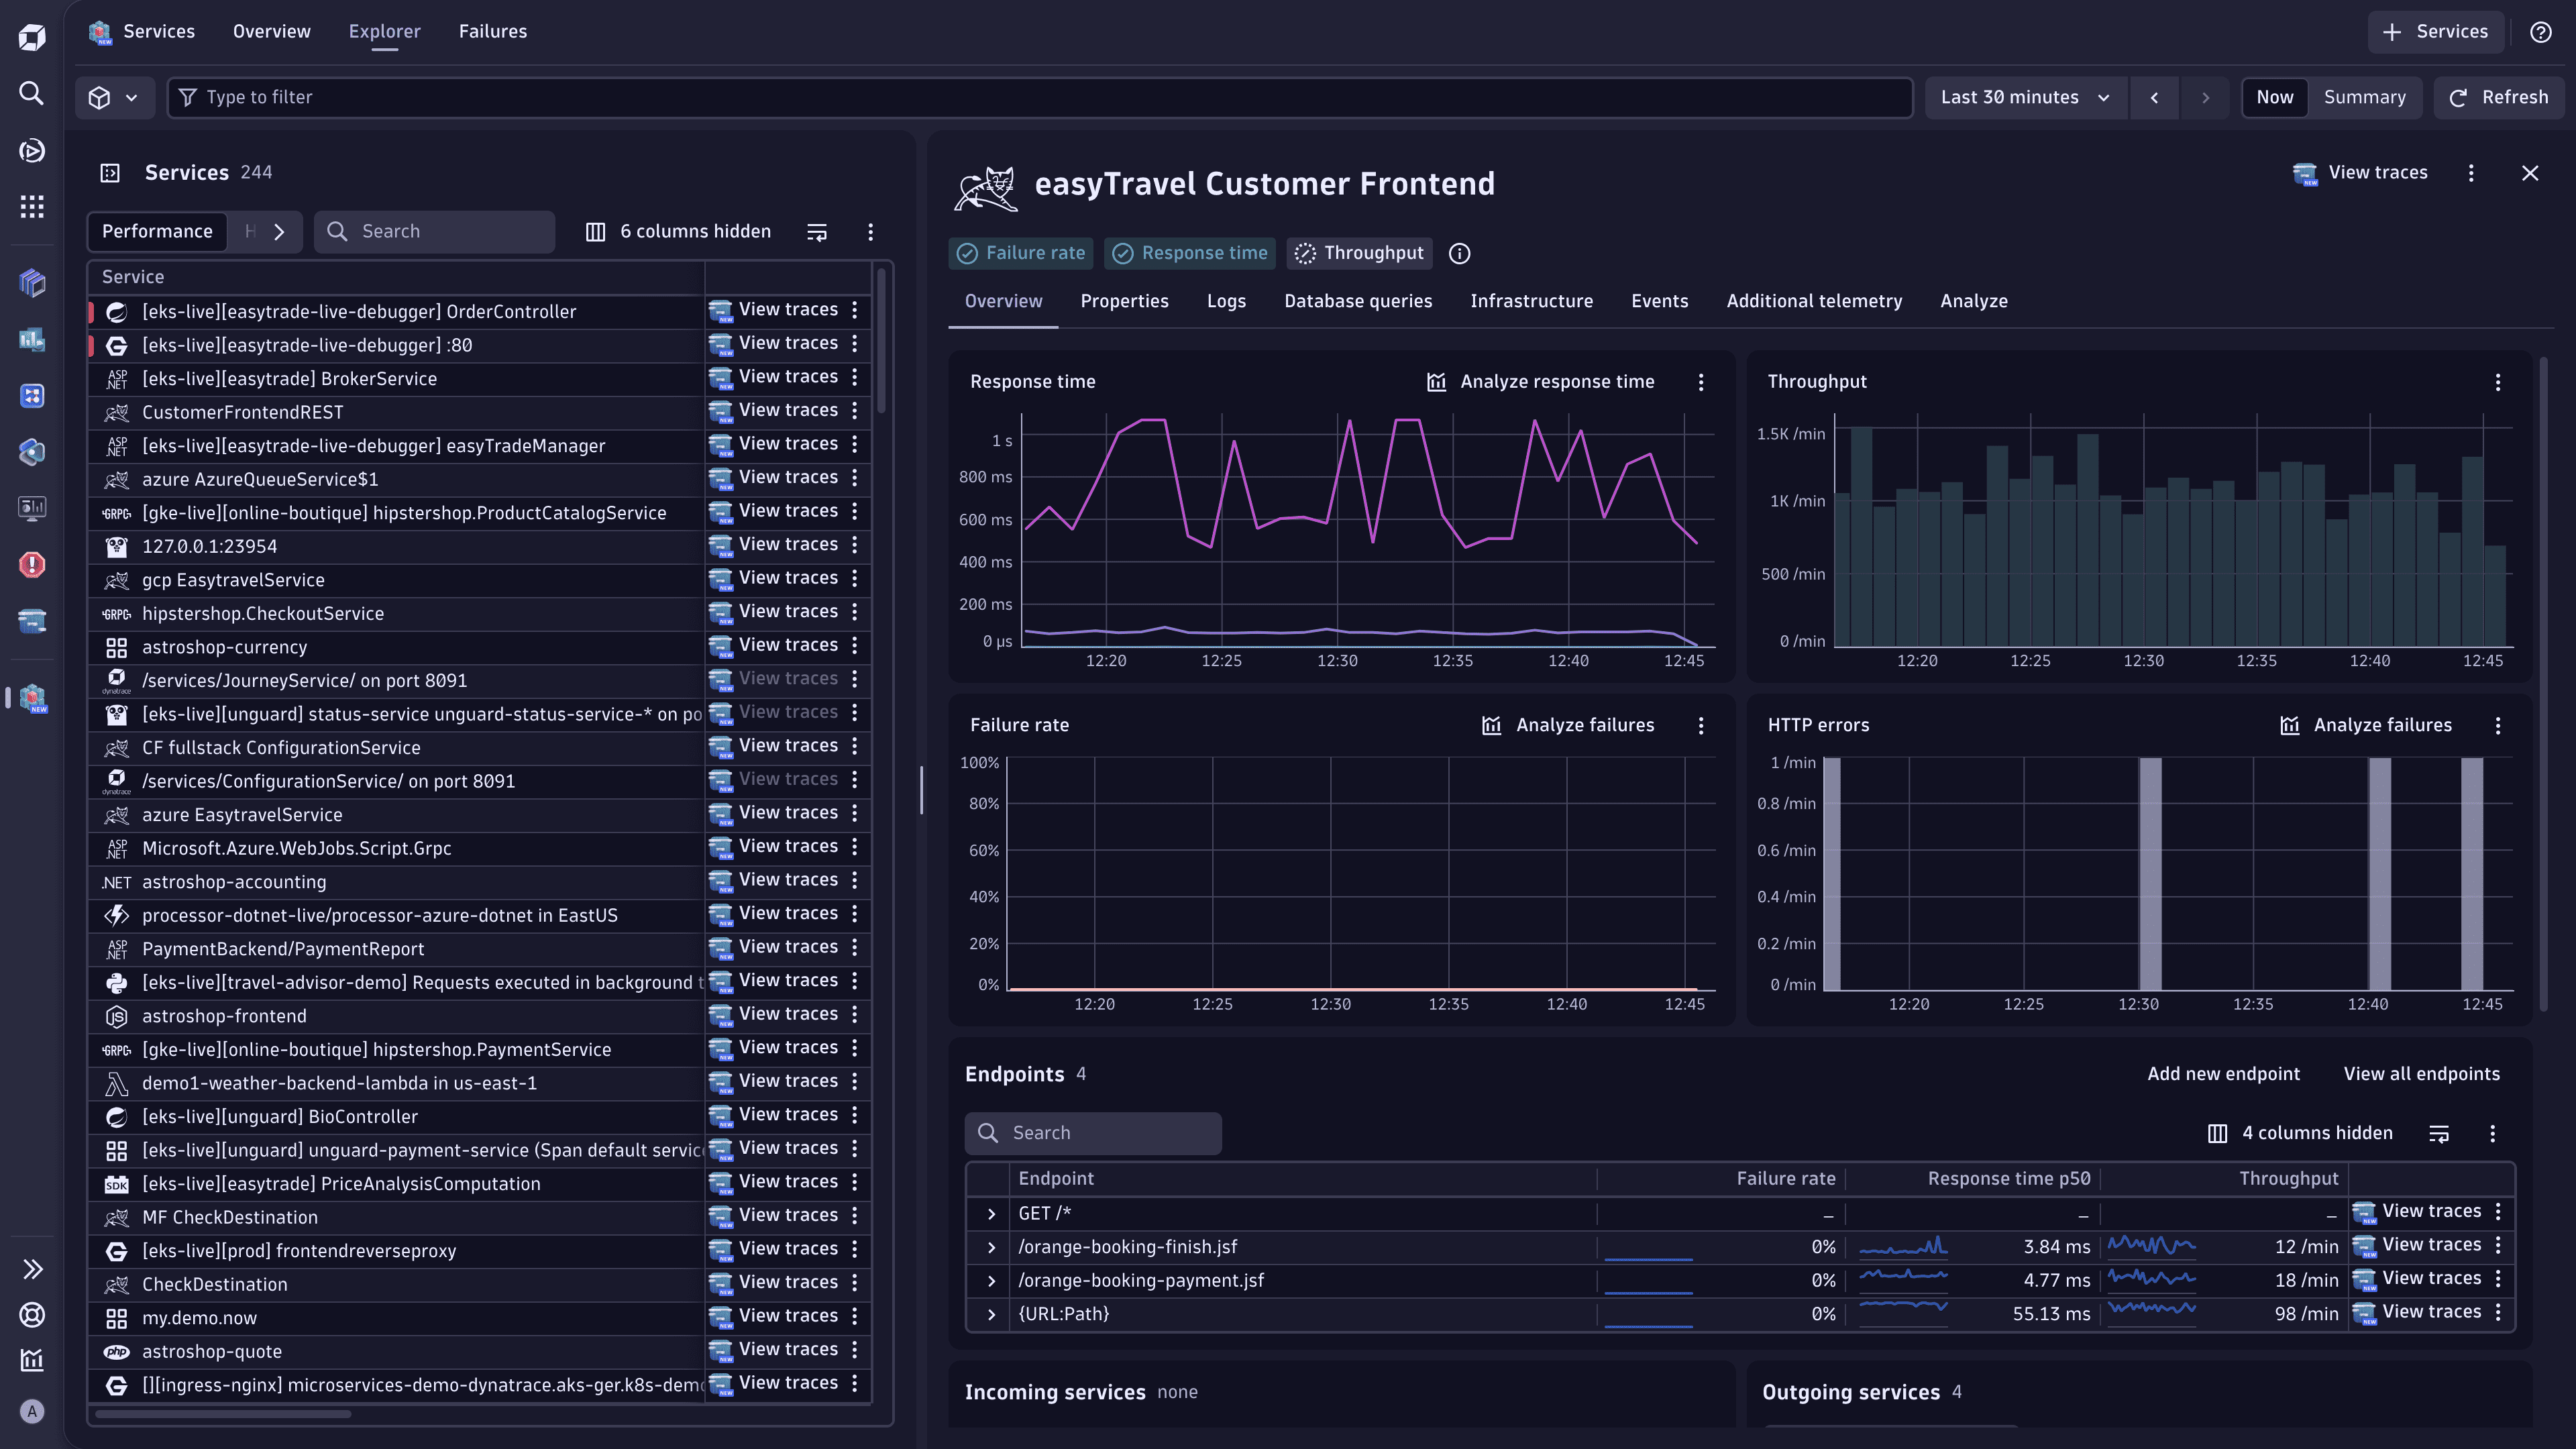
Understand what contributes most to the response time of your services
The new Response Time Analysis feature in Dynatrace provides a streamlined way to:
- Identify key contributors to slow service performance.
- Analyze related outbound calls, database interactions, and infrastructure resource utilization.
- Compare current performance with prior windows to track trends and validate fixes.
- Gain insights into infrastructure metrics for related components.
- Investigate downstream dependencies, such as third-party APIs and services.
Drilldowns now redirect to this new perspective, which supports requests ingested via OpenTelemetry and OneAgent. This enhancement simplifies response time analysis, enabling faster troubleshooting and improved reliability.
Application Observability | Services
Unlock topology insights for services in Smartscape on Grail
Smartscape now runs on Grail, helping you explore and analyze service topology. This enhancement transforms your service topology into a live, queryable graph, delivering topology-aware visibility and actionable insights. Effortlessly navigate through service-to-service dependencies or explore service relationships with hosts, processes, and Kubernetes entities—all enriched with metrics, logs, events, and spans for a context-rich view of your environment.
The result is faster troubleshooting, deeper analytics, and dependency analysis. With all insights unified in one place, you can transition from issue to answer in seconds, resolving problems more quickly and effectively.
Explore the service entity in Smartscape on Grail provides practical examples of combining service topology with observability data to unlock actionable insights and optimize your environment.
Application Security
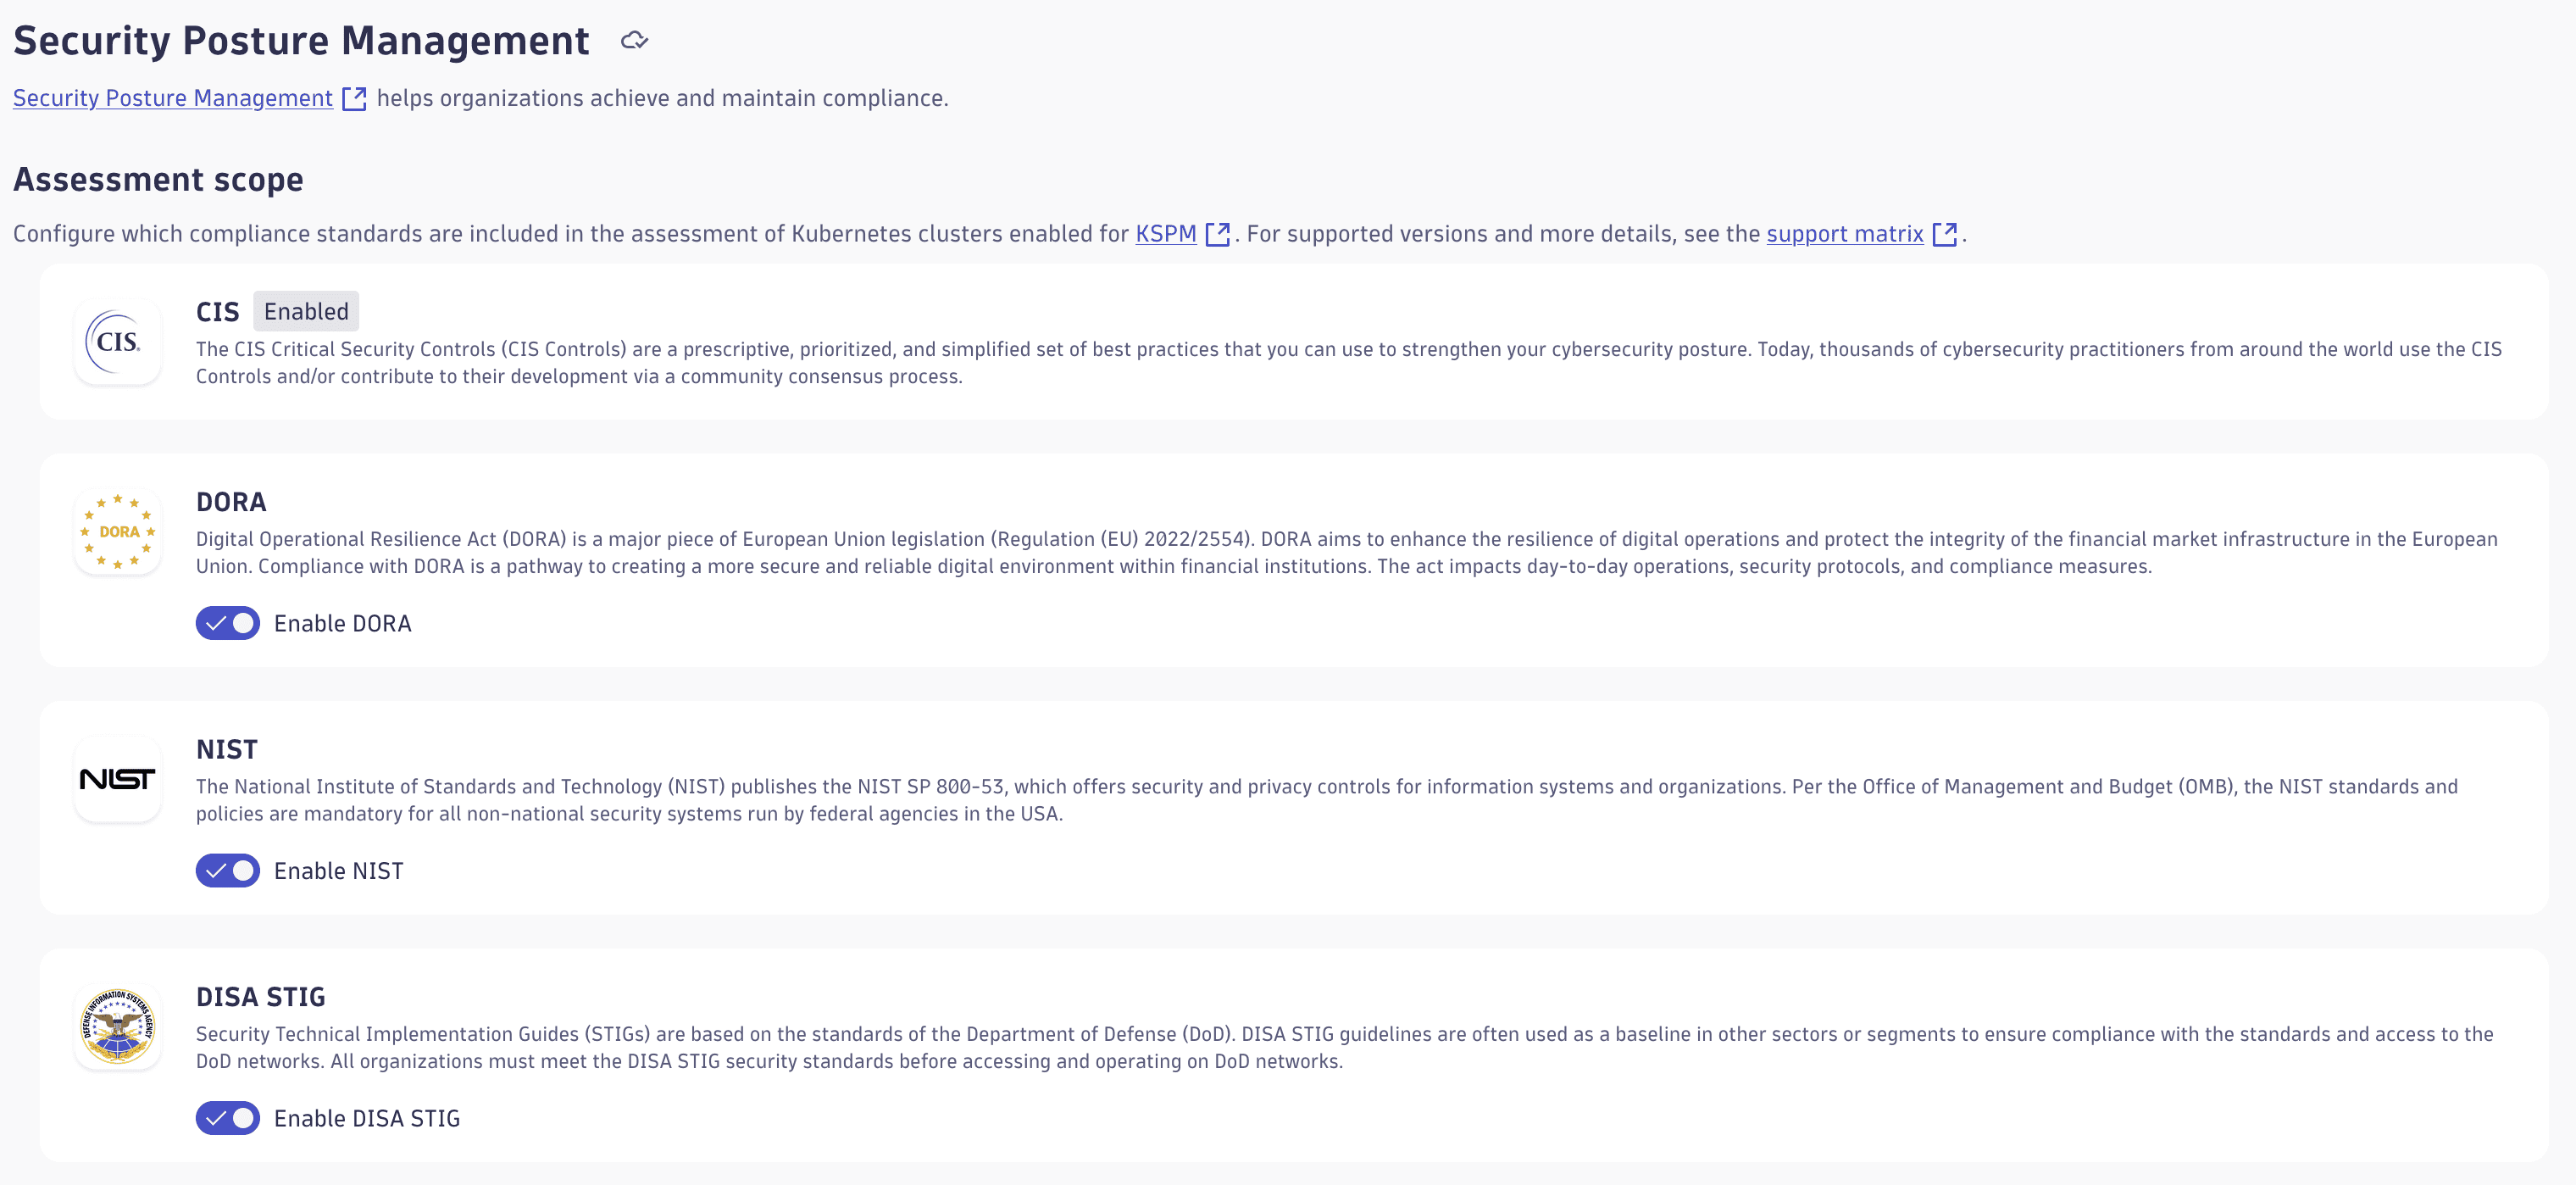
Simplify compliance with customizable security standards
Manage your compliance efforts by selecting the security standards most relevant to your organization. This new capability allows you to focus on streamlining compliance assessments and improving efficiency.
Access the configuration under: ![]() Settings > Analyze and alert > Application Security > Security Posture Management.
Settings > Analyze and alert > Application Security > Security Posture Management.
Application Security
Security Investigator is now known as Investigations
We renamed the Security Investigator app to Investigations. This app empowers you to analyze logs, events, metrics, and traces using DQL, transforming raw data into actionable insights. Read our blog.
Digital Experience
Introducing frontend.name for enhanced permissions, segmentation, and automation
With this update, we introduce frontend.name as the primary field for permissions, segments, and Smartscape for:
- Precise segmentation: The
frontend.namefield is now enriched on all RUM data, including user events, user sessions, and metrics. This field allows precise segmentation and permission management across the platform, including Smartscape. - Simplified permission management: Administrators can now assign permissions and define data access policies at a more refined granular level using the
frontend.nameand the powerful match command. This eliminates the need for manual customization viadt.security.contextand provides a more streamlined and scalable approach. For customers on Classic, it eases migration from management zones. - Lifecycle and automation: Define the
frontend.nameinside Experience Vitals during the data onboarding of new frontends. Existing frontends contain an automatically generated field based on their classic display names. If you're an administrator, review the derived field.
Digital Experience
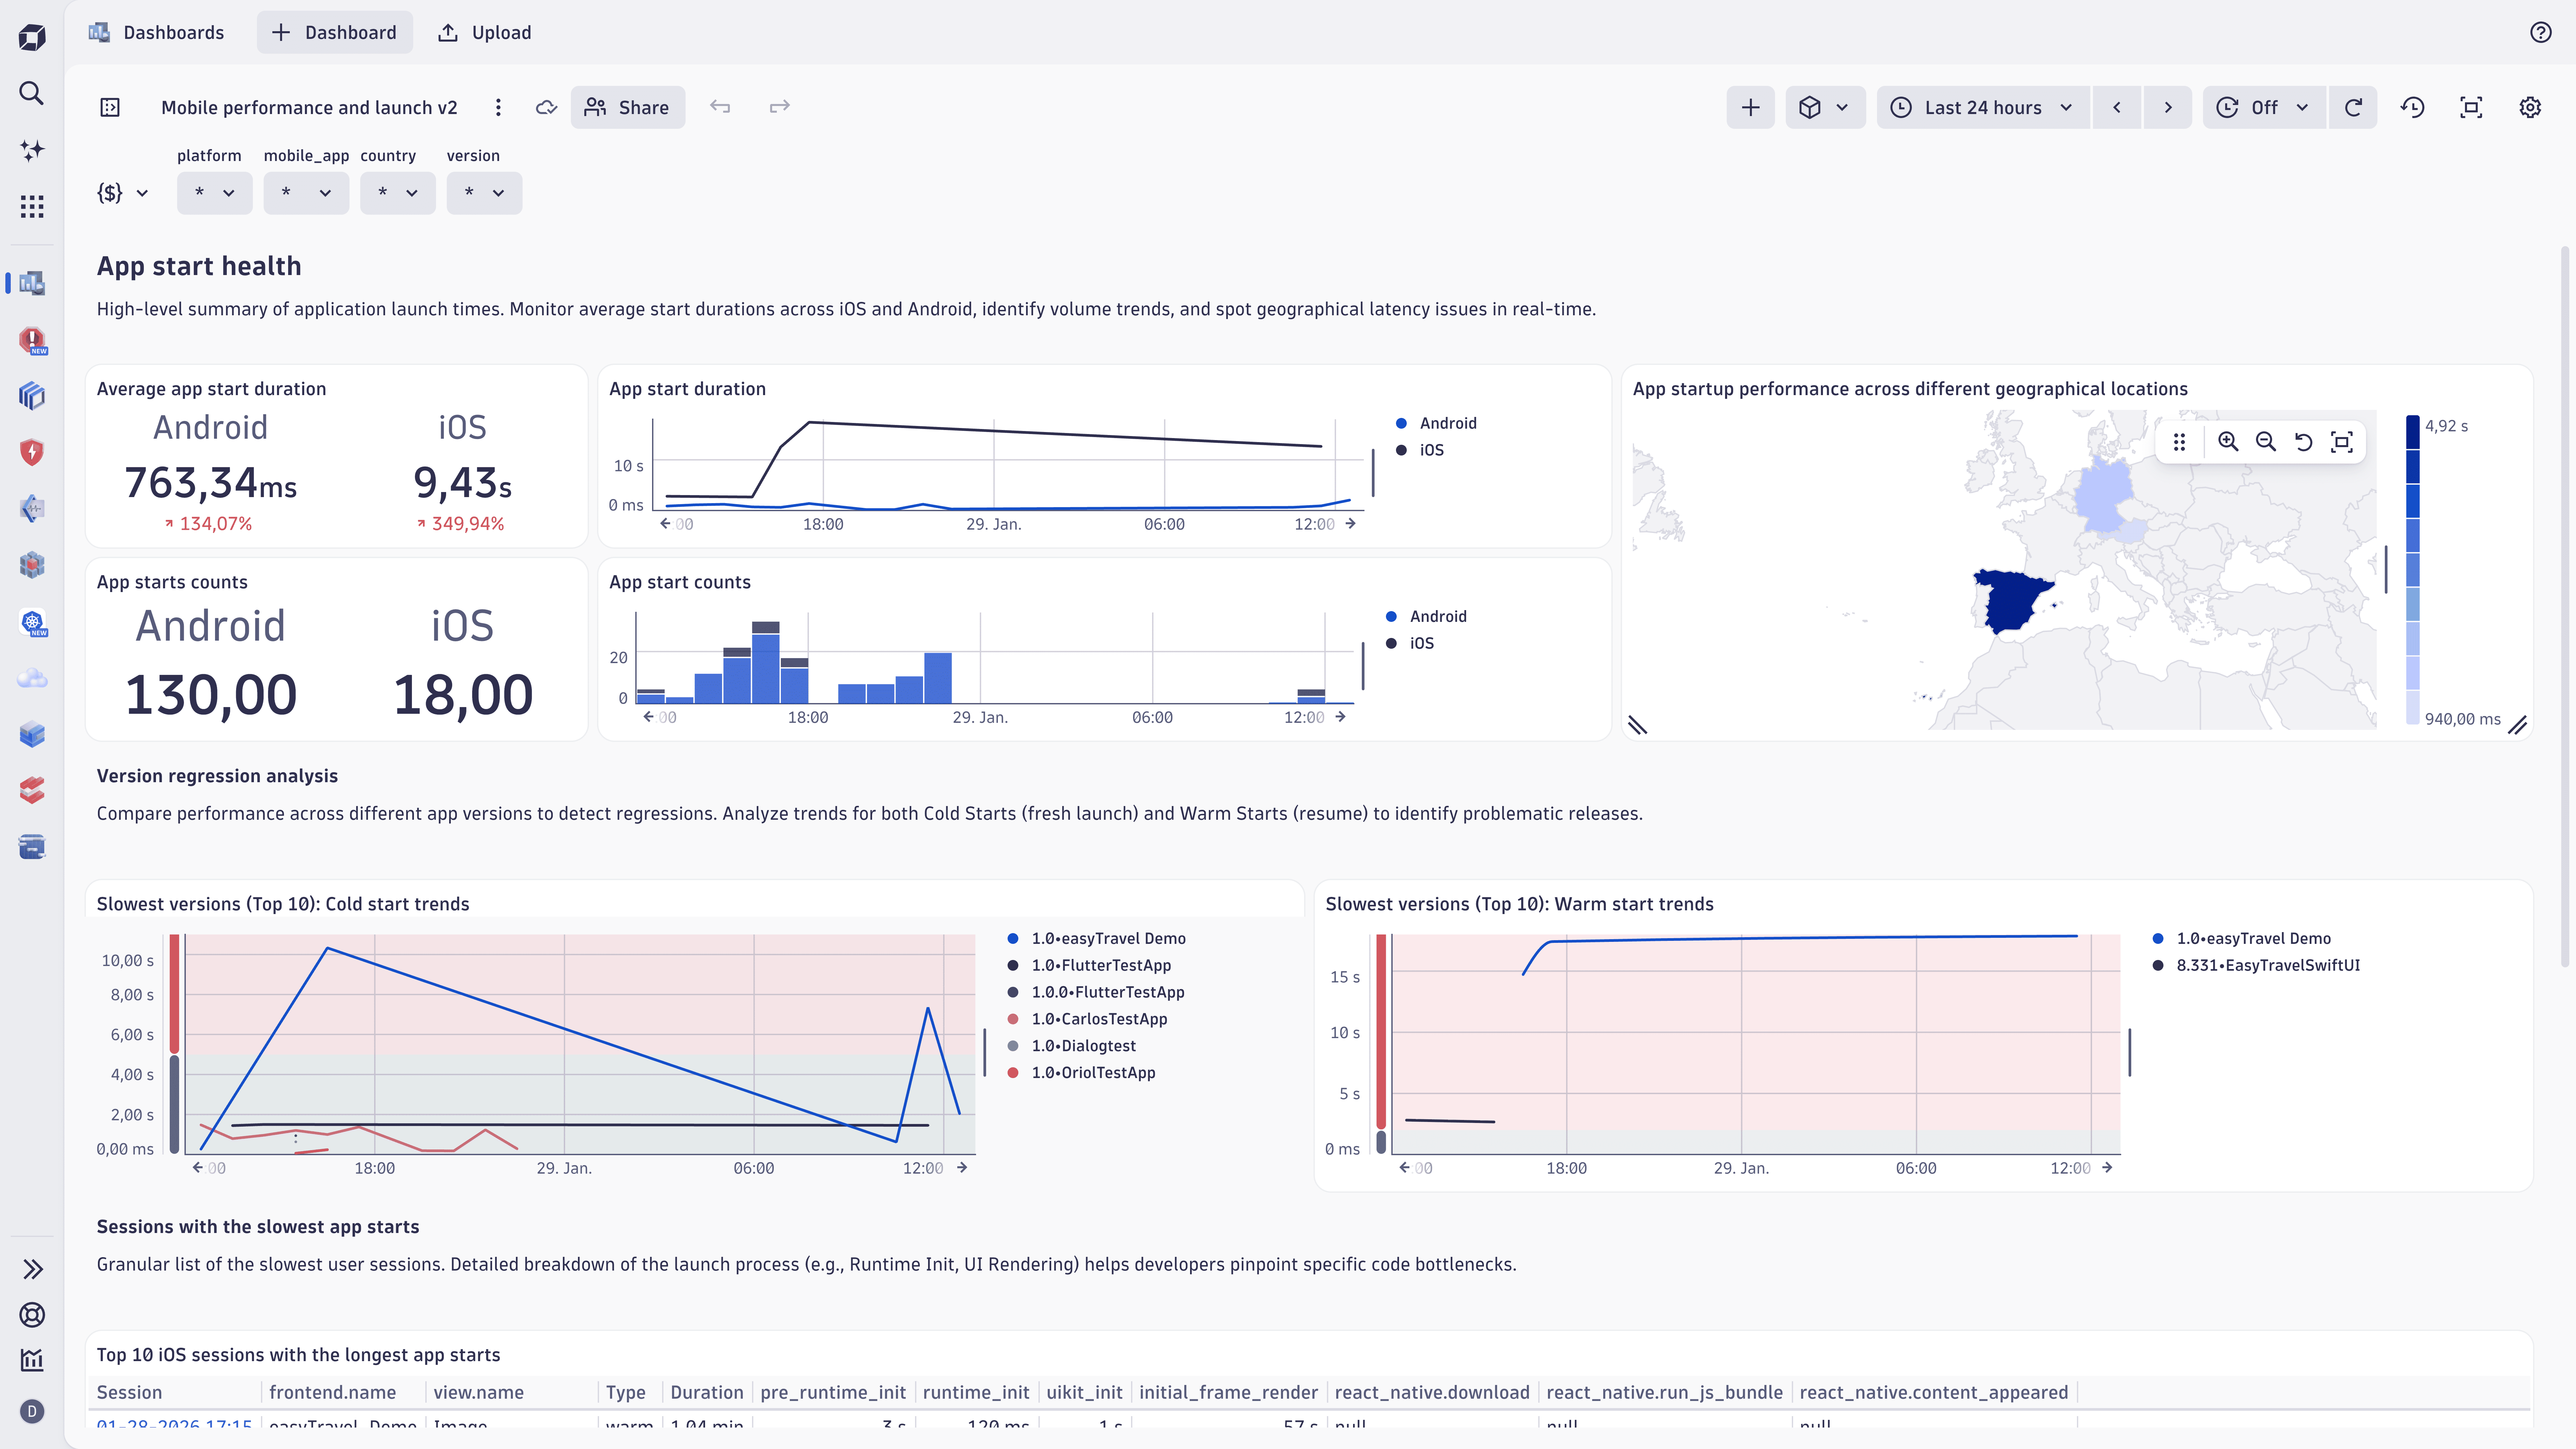
RUM on the latest Dynatrace is now globally available
RUM on the latest Dynatrace is live. Powered by Grail and DQL, it delivers unified, actionable insights across modern web and mobile applications. By extending cloud native observability to the frontend, Dynatrace unifies user experience data with backend intelligence, enabling teams to optimize performance, shorten troubleshooting cycles, and improve business outcomes, while preserving strict enterprise-grade privacy standards.
Customers can enable RUM on the latest Dynatrace on existing environments on a per-frontend basis or for their whole environment for both web and mobile apps. New environments are automatically enabled.
This release includes
- 3 RUM on the latest Dynatrace apps: Experience Vitals, Users & Sessions, and Error Inspector
- A ready-made launchpad, dashboards, and notebooks
- New data capturing and tracing concepts, data points, and built-in metrics
Digital Experience
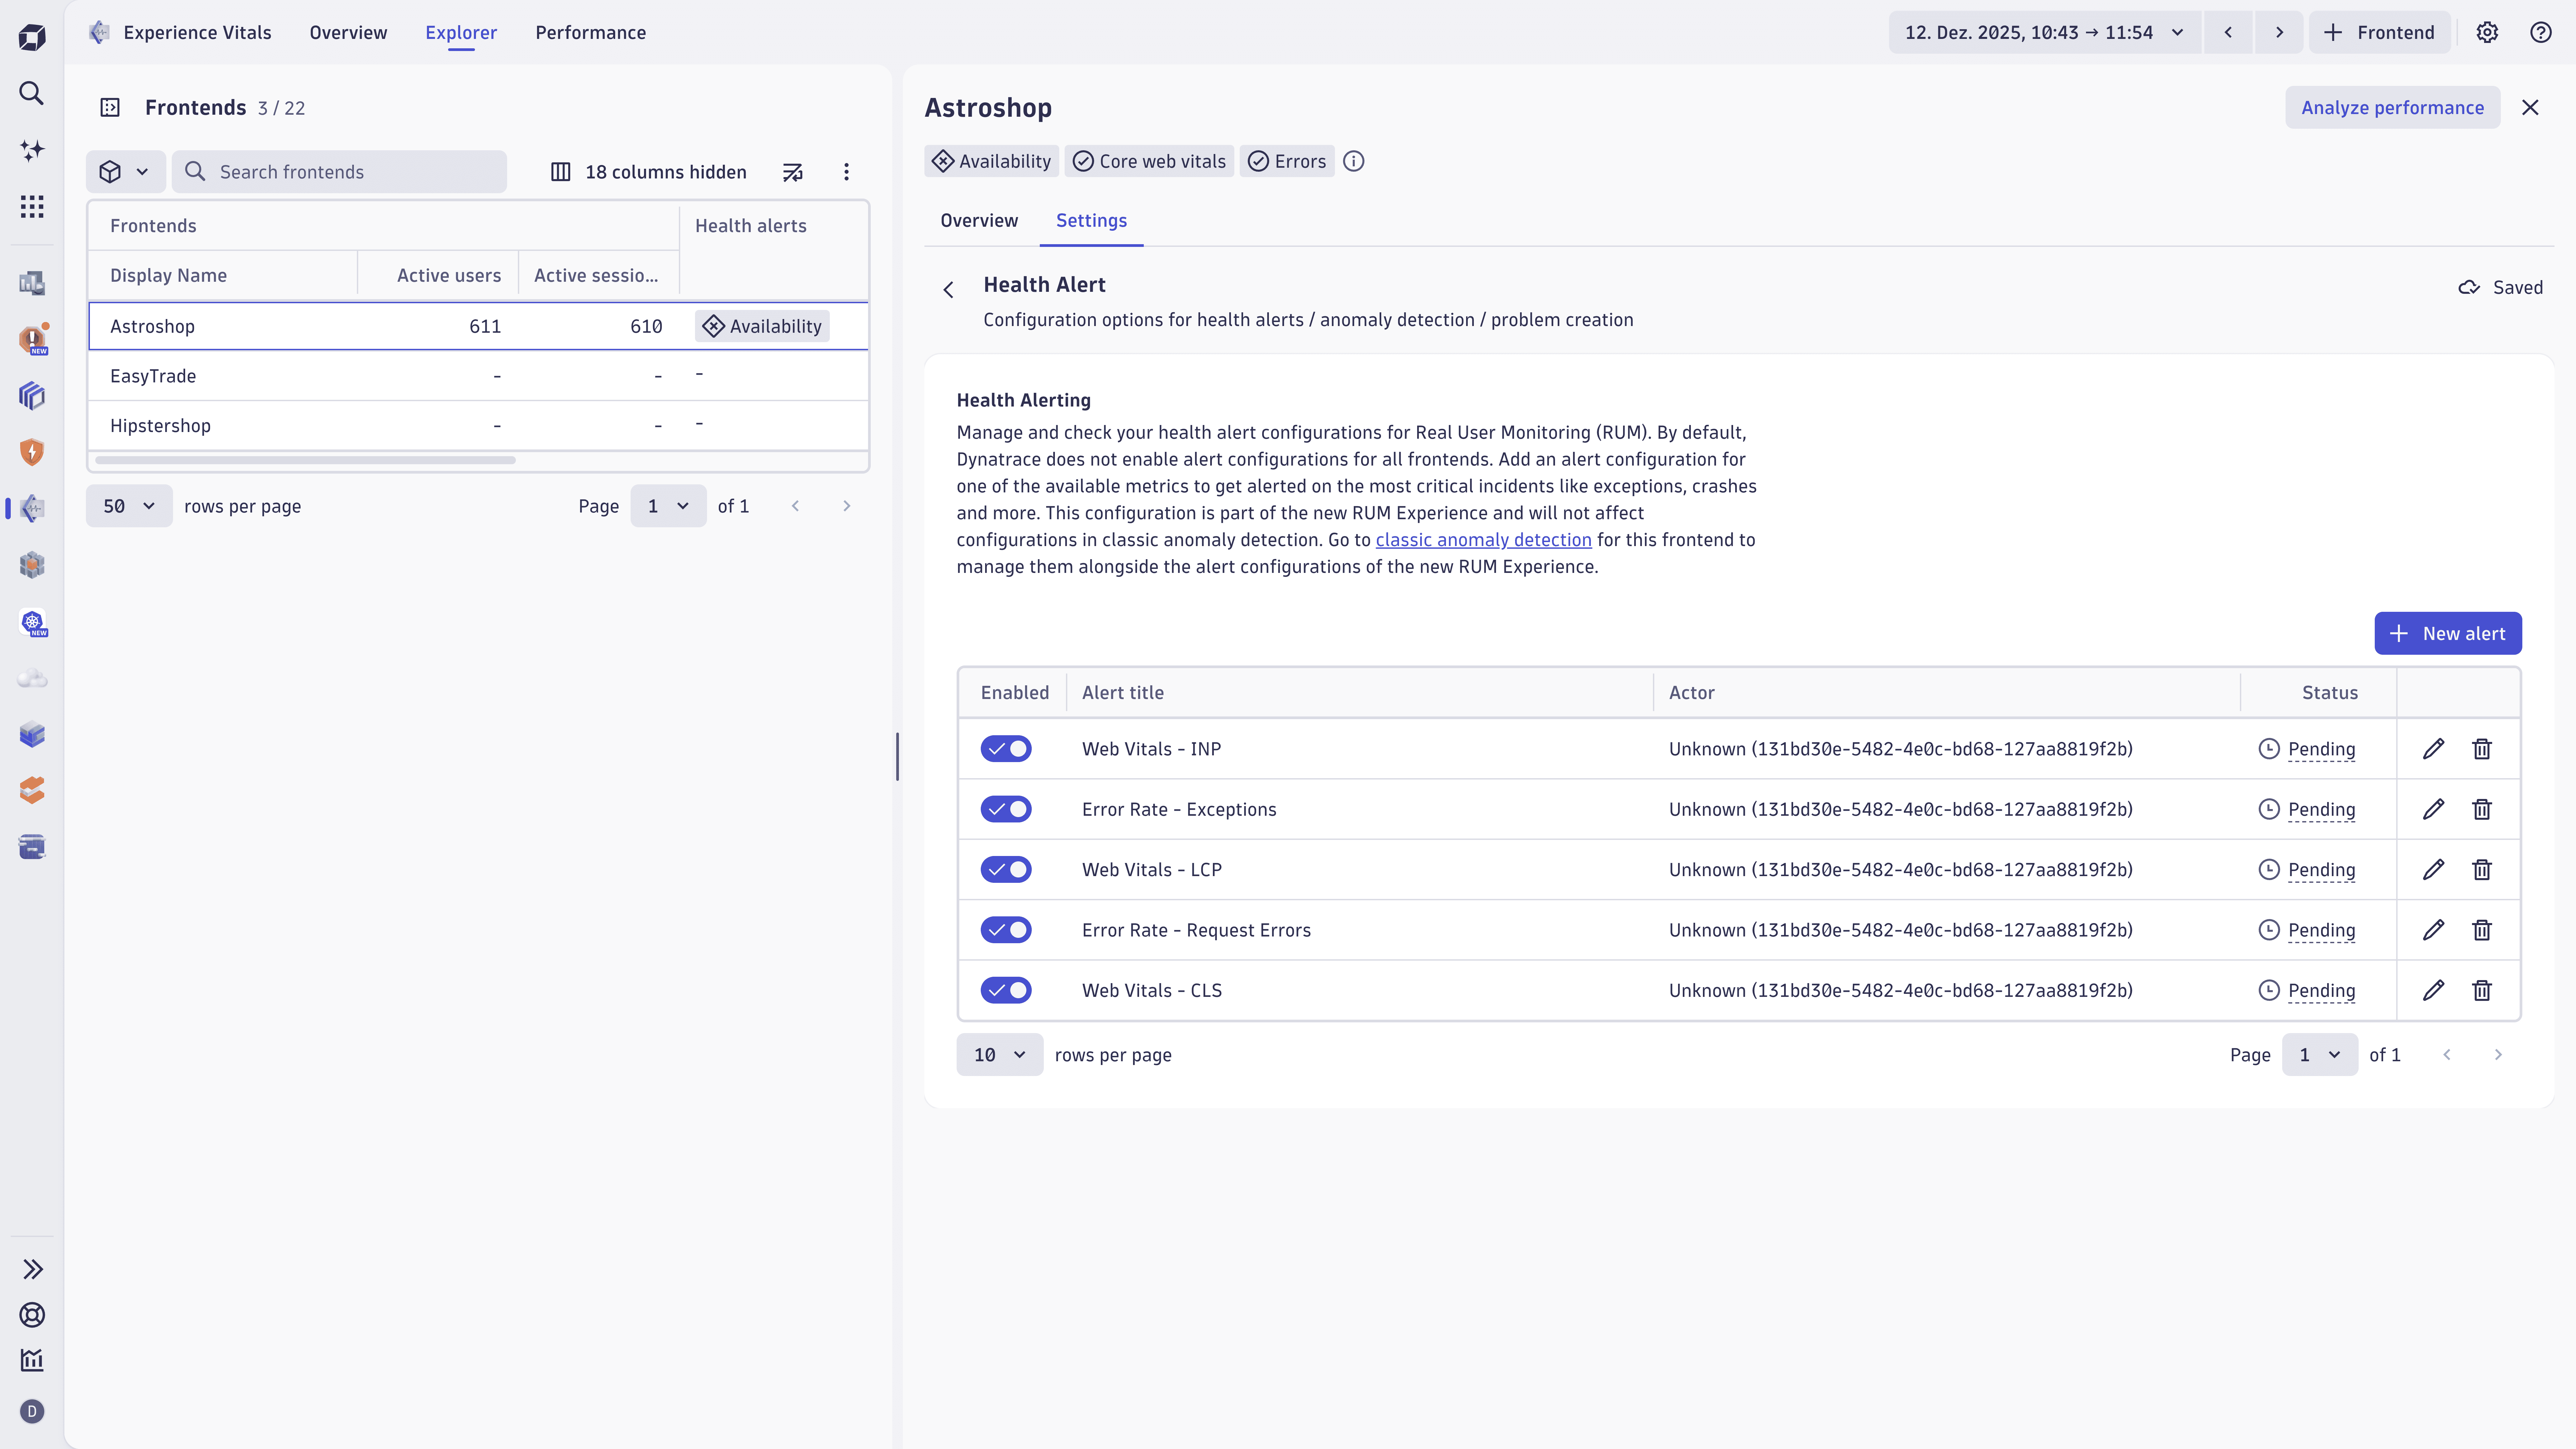
Health alerts for Frontends
We have added native health alerts for key Frontend anomalies, enabling you to receive timely notifications on critical web and mobile issues detected by RUM. This update also offers out-of-the-box alert configurations with simple setup and actionable insights for troubleshooting and performance optimization.
Digital Experience
More privacy with stack trace masking for user events
If the associated application of a user event has the data privacy setting for masking personal data in URIs enabled, the fields exception.stack_trace and csp.stack_trace are masked before being stored in Grail.
Digital Experience | Experience Vitals
Trace linking from RUM waterfall for page load requests
In the  Experience Vitals page load waterfall, requests that contain a
 trace.id now include a convenient View Trace button. This allows you to effortlessly hand off to Distributed Tracing, providing direct access to detailed trace information for faster and more efficient troubleshooting.
Digital Experience | Synthetic
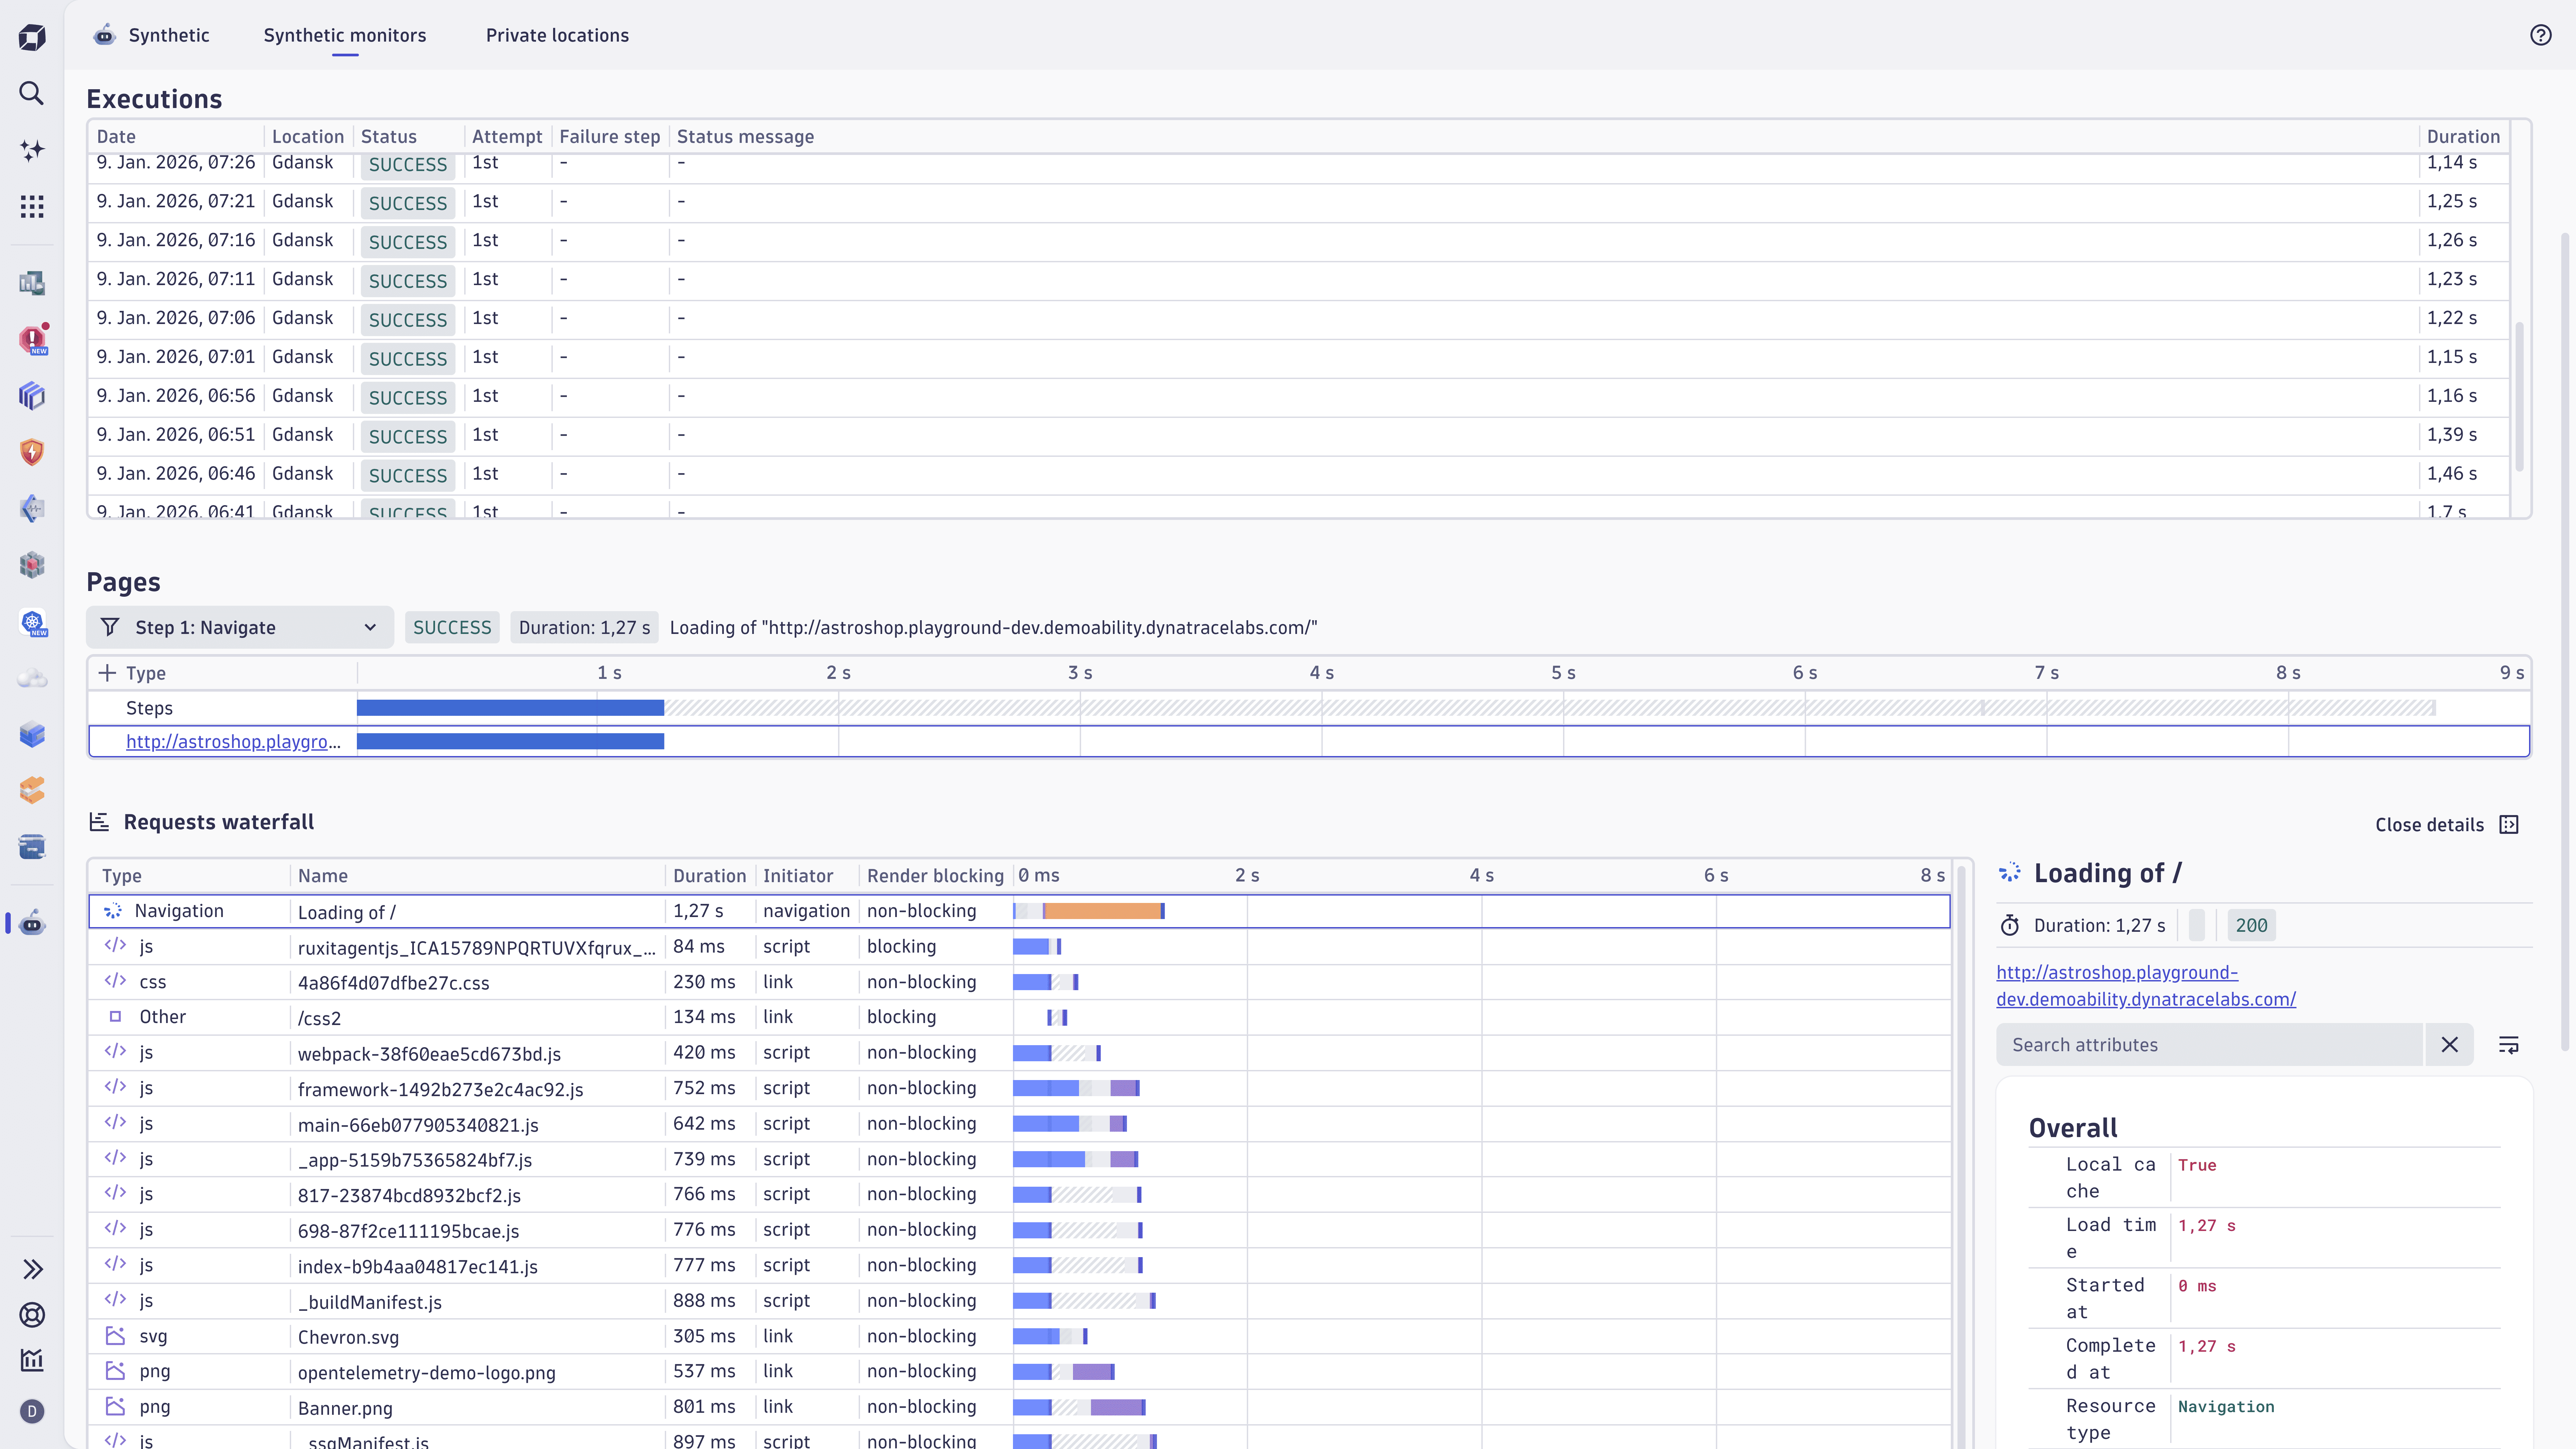
New waterfall chart for synthetic browser monitors
The analysis of Synthetic Browser Monitor results has been streamlined with the introduction of a new waterfall chart, now available in  Synthetic. The new waterfall analysis feature in Experience Vitals provides powerful insights to analyze and optimize web performance. This feature is also fully integrated within the latest Dynatrace.
Digital Experience | Synthetic
Full support for private locations in Synthetic
The Synthetic now provides full support for synthetic private locations, including:
- Detailed reporting on the health, configuration, and capacity usage of all locations and their nodes.
- Deployment of containerized private locations.
Digital Experience | Synthetic
A new browser monitor experience in Synthetic
Dynatrace continues the transition of Synthetic monitoring to Latest Dynatrace by providing a new browser monitor experience. This release allows the execution of browser monitors with the new JavaScript Agent, storing extended results in Grail as metrics and events.
Now you can:
- Analyze results with the new Waterfall report.
- Explore synthetic events in DQL, operationalize insights in Notebooks, and visualize trends in Dashboards.
- Gain fine-grained visibility into simulated frontend activity through user events defined in the Semantic Dictionary.
- Gain detailed insights into user interactions (clicks, taps, scrolls, and inputs).
Digital Experience | Synthetic
Upload Synthetic screenshots to Amazon S3
When saving screenshots in Synthetic, they're now uploaded directly from the cluster instead of the VUC.
Infrastructure Observability | Extensions
Keep your Extensions' dashboards bookmarked
With the new version of Extensions, you can now bookmark dashboards of your extensions and never have to worry about updating the bookmark again.
This feature works with all newly installed extensions. For already installed extensions, static bookmarks will work after the first upgrade or re-installation of the extension.
Infrastructure Observability | Infrastructure & Operations
Containers and Processes support in the Infrastructure & Operations app
 Infrastructure & Operations app now includes dedicated inventories for Containers and Processes, giving you a centralized, real-time view of all running components across your environment. These inventories provide detailed health, performance, and operational metrics to help you monitor and analyze critical workload elements more effectively. We've also enhanced relationship mapping between hosts, containers, and processes. This improvement allows seamless in-context navigation and supports faster, more intuitive troubleshooting, making it easier to identify root causes and resolve issues across your infrastructure. For more details, see Infrastructure & Operations.
Infrastructure Observability | Kubernetes
Achieve clarity, control, and efficiency with Kubernetes Enhanced Object visibility
This update enables "Kubernetes Enhanced Object visibility", which leverages the full power of Grail. In ") Kubernetes, you now have:
Kubernetes, you now have:
- Visibility into additional Kubernetes objects: Ingress, NetworkPolicies, CRDs, PVCs, PVs, ConfigMaps, and more.
- Access to YAML definitions to debug and validate configurations in real time.
- Ability to query YAMLs across all clusters and namespaces using Dynatrace Query Language (DQL) to instantly surface misconfigurations, missing references, or policy violations across your Kubernetes environment.
Prerequisites:
- Dynatrace version 1.330+
- ActiveGate version 1.327+
- Dynatrace Operator version 1.7.0+
- Kubernetes app 1.37.0+
Platform
Sharing dashboards and notebooks
To eliminate bottlenecks and improve collaboration for people using Notebooks and Dashboards, you can now share a notebook or dashboard if you have edit permission for it. Previously, only the notebook or dashboard owner could share it.
By default, this behavior is:
- Turned on for all new notebooks and dashboards (created since version 1.328).
- Turned off for existing notebooks and dashboards.
Notebook and dashboard owners can manage this behavior to retain full control of the shares.
- Open the notebook or dashboard.
- Select Share.
- Select (Manage access).
- Turn Allow editors to share on or off.
Known issues for editors using sharing (owners are unaffected):
- The owner information incorrectly shows the current user as the owner.
- The Visible to anyone in your environment switch is visible but has no effect.
These issues will be fixed soon.
Platform
Improved accuracy in dimension limit monitoring for metrics
Usage of custom metrics with a steady flow of new dimension values (such as Kubernetes pod UIDs) could display incorrect patterns in self-monitoring, including sudden increases followed by drops.
With this update, dimension limits are now calculated accurately, providing clearer and more reliable insights into your metric usage.
Platform | Dashboards
Add links to navigate from dashboards to related resources
You can now create links that navigate seamlessly from a data point, cell, or series in your tiles to related dashboards or external systems such as Jira, Confluence, or ServiceNow. This feature preserves the context of the selected tile and data point, enabling you to investigate issues more deeply or trigger actions directly from your dashboards.
Platform | Dashboards
Improved tile duplication in Dashboards
In Dashboards, you can organize your dashboard more effectively with improved tile duplication.
When you select one or more tiles and then select (Duplicate), the duplicate tiles are now inserted immediately after the originals instead of being added to the bottom of the dashboard.
Whether you're working with one tile or multiple tiles, the original tile's space is automatically adjusted to fit the duplicates.
Platform | Davis
Refined email notifications in  Problems
With Problems version 1.14.1+, to help reduce noise and minimize alert fatigue, we have refined how email notifications are triggered.
Instead of triggering notifications immediately when a problem appears, emails are now sent only after the root cause analysis is ready.
This update:
- Ensures that each message contains high-value insights.
- Minimizes unnecessary single-problem alerts.
This update leverages the dt.analysis.ready field on the Davis problem record.
Platform | Grail
Core entities in Smartscape on Grail
Core entities such as Hosts, Processes, and Containers are now stored in Smartscape on Grail and can be queried via DQL. Learn more about:
- How to query data from Smartscape on Grail.
- The core entities model in the Semantic dictionary.
Platform | Notebooks
Automatically send out simple DQL reports from Notebooks
For all DQL results presented as a table in Notebooks, you can automate the sending of the DQL result as an email or a Slack message by setting up a new workflow.
- In Notebooks, edit the section, open the menu, and select Workflows > Create workflow to email results or Create workflow to send results via Slack.
- In the Create workflow… confirmation window, select Create workflow.
- In
 Workflows, select the desired schedule and email recipients or Slack channel.
Platform | OpenPipeline
Extension 2.0 support OpenPipeline
The latest versions of Extensions 2.0 now support OpenPipeline configurations for ingest sources and pipelines. This upgrade empowers you with greater flexibility and control, enabling seamless integration and streamlined data ingestion workflows.
Platform | OpenPipeline
Smartscape extraction stage for OpenPipeline
OpenPipeline now allows you to extract Smartscape nodes and edges for all signal types, making it easier to access and analyze your topology data.
For details, see Smartscape on Grail.
Software Delivery
Populate ServiceNow incidents with custom field management
ServiceNow instances are often customized to meet customers' demands. This requires integrations to populate additional or custom fields, such as channels, regions, service offerings, and other relevant details. With a generic ServiceNow create, search, and edit record action, Dynatrace workflows empower customers to populate any table by configuring the target table and required fields.
For details, see ServiceNow Connector to integrate with Workflows.
Breaking changes
All | Log Monitoring
Improved structured logs processing
We have introduced the concept of a data model, defining how the Log Ingestion API (JSON or OTLP) parses log events. There are two available data models:
- Raw (default for new environments): Attributes with object values are strings that preserve the input structure, enabling simpler analysis in the Log App.
- Flattened (default for existing environments): Input log processing follows the behavior of previous versions, where attributes with object values are flattened.
The following endpoints include new functionality that can be used starting with ActiveGate version 1.229:
- Both JSON and OTLP log ingestion endpoints now include a new URL parameter called
structure, which allows you to specify the data model on a per-request basis. Alternatively, you can set the data model using a new header:X-Dynatrace-Options. - To simplify certain integrations, the
/logs/ingestendpoint now supports setting the content type via thecontent-typeURL parameter.
For more details about the data models and API interface changes, refer to the following resources:
Note: The Raw model becoming the default for new tenants may constitute a breaking change only if you have automation that assumes the old flattened structure (for example, dashboard templates, predefined log-based metrics, or other integrations that expect flattened log attributes).
If your automation, dashboards, or integrations rely on the flattened model, the following mitigation options are available:
- Force legacy behavior with the
structure=flattenedURL parameter, or usingX-Dynatrace-Options: structure=flattenedin the header. - If this does not fully resolve the issue, contact support to request that the tenant’s default behavior be restored.
Digital Experience | Synthetic
Improved synthetic browser monitor metrics
With this release, Dynatrace introduces and enables by default a new browser monitor experience powered by the latest RUM JavaScript. This enhancement requires some reorganization of the synthetic browser monitor metrics.
The following metrics have been replaced with their equivalents powered by the new RUM JavaScript in the new browser monitors experience:
dt.synthetic.browser.durationis nowdt.synthetic.browser.user_events.durationdt.synthetic.browser.step.durationis nowdt.synthetic.browser.step.user_events.durationdt.synthetic.browser.total_durationis nowdt.synthetic.browser.user_events.total_durationdt.synthetic.browser.step.total_durationis nowdt.synthetic.browser.step.user_events.total_duration
Metrics powered by the latest RUM JavaScript will be available for all monitors using the new browser monitor experience provided they are executed from public locations, or from private locations when using ActiveGate version 1.329+.
If the new browser monitor experience is disabled, or if the browser monitor is executed from a private location using ActiveGate versions 1.328 and earlier, only the classic metrics will be available:
dt.synthetic.browser.classic.total_durationdt.synthetic.browser.step.classic.total_duration
Dynatrace introduces two new metrics to enhance the measurement of browser monitor performance:
dt.synthetic.browser.duration: Represents the total duration of a browser monitor, calculated as the sum of all step durations.dt.synthetic.browser.step.duration: Represents the duration of an individual browser monitor step. This is calculated as the sum of all user action events within the step. If no user actions are present, the duration is measured from the beginning of the step to the maximum end time of the load event handler phase.
Both metrics are powered by the new RUM JavaScript and require browser monitors to be executed with the new browser monitor experience enabled. For details on the conditions required to use these metrics, refer to the earlier section.
These two metrics are now the primary performance indicators for web pages monitored by synthetic browser monitors. Dynatrace strongly recommends using them as your main performance metrics moving forward.
Please note, although the new metrics share the same key as the replaced metrics mentioned in the first section, the reported values may differ slightly, as the metric is now sourced from a different RUM JavaScript.
The following deprecated metrics have been removed:
dt.synthetic.browser.event.duration, which is replaced bydt.synthetic.browser.step.durationwhen the browser monitors experience is enabled. If it is not enabled, the recommended replacement isdt.synthetic.browser.step.classic.total_duration.dt.synthetic.browser.event.executions, which is replaced bydt.synthetic.browser.step.executions.
Digital Experience | Synthetic
Event ID for Synthetic events changed to string
For all Synthetic events, the following field types were changed from long to:
- string:
event.id
- timestamp:
execution.end_timestampresult.statistics.start_timestampcustom_log.timestampresult.statistics.peer_certificate_expiry_date
- duration:
result.statistics.durationbatch_result.durationbatch_result.total_durationresult.statistics.host_name_resolution_timeresult.statistics.tcp_connect_timeresult.statistics.tls_handshake_timeresult.statistics.time_to_first_byteresult.statistics.redirection_time
The Synthetic events version is now 1.1.0.
Infrastructure Observability | Extensions
Event related endpoints have been removed from the Extensions Environment API v2
The following deprecated endpoints have been removed from the Environment API v2:
/extensions/{extensionName}/environmentConfiguration/events/extensions/{extensionName}/monitoringConfigurations/{configurationId}/events.
Platform
Specify bucket name in OpenPipeline configuration
The incorrect default bucket name has been removed. When saving a bucket configuration in OpenPipeline, you need to specify the target bucket name now. This change ensures accurate configurations by removing incorrect defaults and requiring explicit naming of buckets.
Platform
Improved Smartscape field handling for Davis events and problems
Davis events and problems now write Smartscape fields like dt.smartscape.__type__, dt.smartscape_source.id, and smartscape.related_entity.ids with the smartscapeId type instead of string.
DQL queries that specifically check the type of these fields to be string, using the type function, will break.
Platform | DQL
Updated toString() output in DQL for consistency and formatting standards
We have updated the toString() function in DQL when handling binary input to improve consistency and align with standards.
Previous behavior
-
Returned hexadecimal representation of binary data in upper case.
-
Enclosed the hexadecimal representation in double quotes.
New behavior
-
Returns the hexadecimal representation of binary data in lowercase.
-
Output is not enclosed in quotes.
This update ensures consistency with the encodeBase16() function and follows common hexadecimal formatting standards.
Platform | OpenPipeline
Improved comparison operators in matcher queries
Comparison operators in matcher queries now return null instead of false when operands are incompatible (for example, Duration > Long).
This behavior is aligned with DQL for consistency across the platform and provides clearer results by indicating incompatibility with null.
Fixes and maintenance
Resolved issues in this release (SaaS)
- Improved log query coverage: Resolved an issue where, in rare cases, certain Dynatrace apps were not scanning the full timeframe for log queries, ensuring complete and accurate log analysis. (GRAIL-46790)
- Reliable browser monitor auto-login: Fixed a bug in the JavaScript step of the auto-login browser monitor, preventing crashes when the monitor fails, for a smoother monitoring experience. (DEM-18430)
- AWS Cloud API gateway metrics now use
Countinstead ofSumfor statistics about the total number of API requests. These metrics are:ext:cloud.aws.apiGateway.count,ext:cloud.aws.apiGateway.countByStage,ext:cloud.aws.apiGateway.countByStageResourceMethod, andext:cloud.aws.apiGateway.countByRegion. Metrics that useSumare deprecated. (DAQ-17416) - Consistent handling of whitespace endpoints: Service detection v2 spans now treat endpoints consisting of all whitespace characters the same as empty endpoints, resulting in no
endpoint.namebeing assigned. This update ensures consistent span behavior, with no impact on metric generation. (APPOBS-30130) - Enhanced filtering in logs app: Addressed an issue with filters that use multi-word keys, ensuring seamless filtering and improved usability in the logs app. (APPOBS-30035)
- Safari compatibility fix: Resolved a compatibility issue with Safari 26.1 that caused the logs app to crash when expanding facets, ensuring stability across browsers. (APPOBS-30034)