What's new in Dynatrace SaaS version 1.329
- Release notes
- Rollout start on Dec 16, 2025
This page showcases new features, changes, and bug fixes in Dynatrace SaaS version 1.329. It contains:
Feature updates
Application Observability | Log Analytics
Extract and highlight log messages in Logs
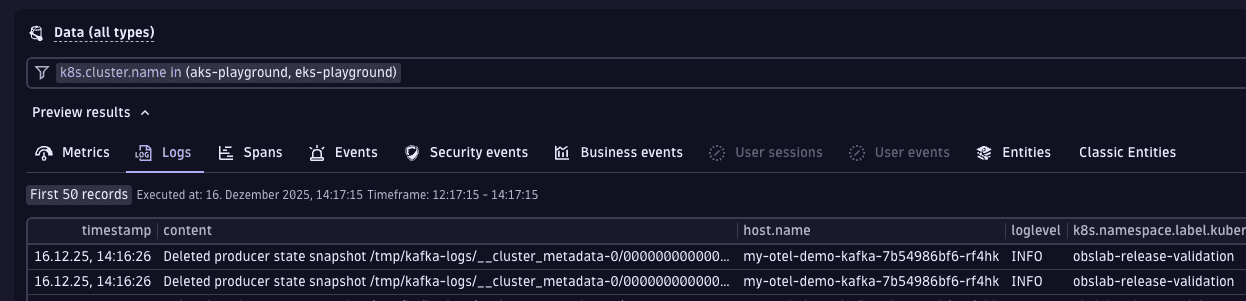
![]() Logs now automatically extracts and highlights human-readable log messages from records and displays them in a separate Log message column in the results table, even if a message is buried deep in a nested field of a structured log record. If no message attribute is present, a full content field is shown as a fallback. You can display or hide the Log message column depending on your preferences and needs.
Logs now automatically extracts and highlights human-readable log messages from records and displays them in a separate Log message column in the results table, even if a message is buried deep in a nested field of a structured log record. If no message attribute is present, a full content field is shown as a fallback. You can display or hide the Log message column depending on your preferences and needs.
Why does this matter?
- Faster log analysis: no more troubles when trying to find a real message in vast metadata. You get an event description at a glance, which saves you a lot of time.
- Works with various log types: whether your logs are coming from cloud-native applications or your own internal developer platform, a semantic message is highlighted for you.
- Smarter browsing:
 Logs now displays the Log message column by default, making it easier to skim, search, and group similar events.
The log message functionality is activated by default in ![]() Logs, and will be soon applied for logs in other Dynatrace Platform applications. For details, see Adjust the log message.
Logs, and will be soon applied for logs in other Dynatrace Platform applications. For details, see Adjust the log message.
Application Observability | Distributed Tracing
Set and override OneAgent masking at the host group level
OneAgent masking can mask data at first contact, before it leaves a monitored process. To allow you to configure it in multiteam and multidepartment environments, we made it possible to set and override it at the host group level in addition to the already existing environment, Kubernetes cluster/namespace, and process group levels. This is especially convenient when hundreds of applications have to be managed.
Application Observability | Log Analytics
Always display selected columns in Logs
Selected columns are now always displayed in ![]() Logs even if they don’t appear in records.
Logs even if they don’t appear in records.
Application Security
New standard for Elastic Kubernetes Service and Azure Kubernetes Service
Dynatrace Security Posture Management now supports the NIST SP 800-53 standard for Elastic Kubernetes Service and Azure Kubernetes Service.
Platform
New API for easier removal of outdated custom metrics
The environment API now provides a new endpoint to bulk delete custom metrics that haven’t been written in a given number of days:
DELETE /api/v2/metrics?metricSelector=<your-selector>&minUnusedDays=<nr-of-days>
Use the metricSelector parameter to select metrics to be deleted. You can use wildcards to delete:
- Metrics that match a prefix.
- All metrics (by selecting
*).
Use the minUnusedDays parameter to specify at which point matching metrics should be deleted.
For example, minUnusedDays=60 will delete all matching metrics that haven’t been written in the last 60 days.
Platform | Davis
Filtering by segments for Anomaly Detection
Anomaly Detection now supports filtering by segments, allowing you to narrow alerts to, for example, specific applications, regions, or Kubernetes clusters.
- You can apply segments directly within an alert widget to create context-aware alerting configurations.
- Segments configured in
 Notebooks or
  Dashboards are automatically inherited by the alert widget, maintaining context as you switch from data exploration to alert creation.
 - When you navigate from Anomaly Detection to Notebooks or Dashboards via Open with, selected segments are automatically applied.
Platform | DQL
More convenient parsing of JSON-formatted data with DQL
New jsonField() and jsonPath() functions are now available in DQL. You can use them to extract specific elements from JSON objects in strings.
The jsonField() function extracts a single value from a JSON object selected by name.
data record(content = """{"name": "John", "age": 54 }""")| fieldsAdd jsonField(content, "name")
For more advanced use cases, you can use the jsonPath() function, which supports JSONPath expressions to extract elements from the parsed JSON object.
data record(content = """{"name": "John", "age": 54 }""")| fieldsAdd jsonPath(content, "$.name")
With the JSONPath syntax, you can easily navigate through complex JSON data.
Platform | DQL
New DQL command to explore metrics
Added a new DQL metrics command allowing you to explore metric keys, dimension keys and values. It replaces the fetch metric.series command that was released as a preview.
metrics| filter dt.entity.host == "HOST-6DF6DE092963F2AB"| dedup metric.key
The fetch metric.series command will be deprecated and is scheduled for removal in a future release.
For details, see metrics.
Platform | Settings
Manage specific entities in Settings
In Settings, you can now configure settings for specific entities (for example, hosts, services, and Kubernetes namespaces) instead of only at the environment level.
When you select a setting you want to configure, you are redirected to Settings Classic in most cases, but the settings are gradually being migrated to the latest Dynatrace.
Application Observability | Log Analytics
Improved filtering in Logs
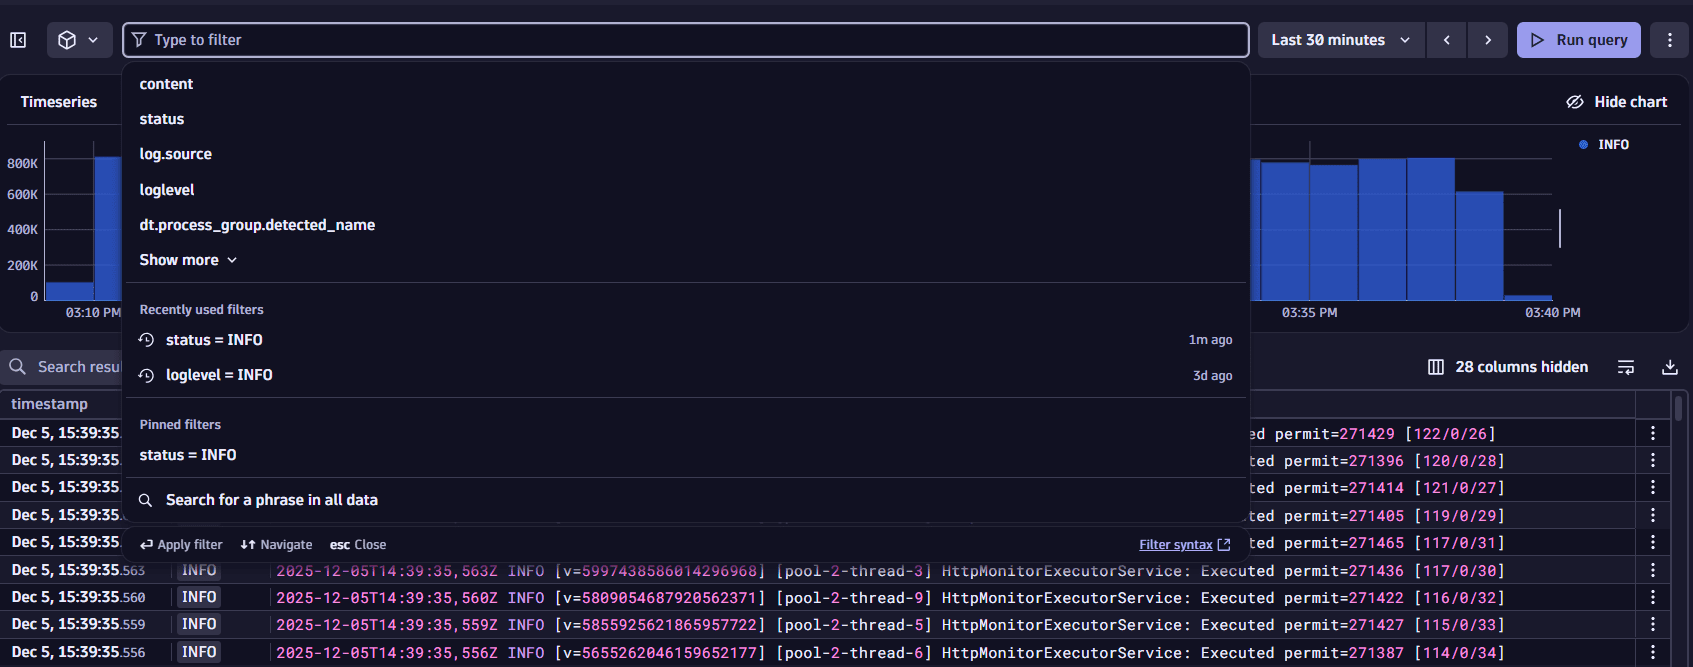
![]() Logs now offers smarter and faster ways to find what you need:
Logs now offers smarter and faster ways to find what you need:
- Recently used filters—access your most recent filters and pin them for quick reuse.
- Search across all fields—type any phrase and select Search for a phrase in all data for broader results.
- Smarter field suggestions—you are provided with intelligent suggestions on the most relevant fields to speed up exploration.
Application Observability
New way to control the trace ingest via Settings API
You can now steer the usage of the included trace volume for Full-Stack Monitoring at the settings level—for example, host groups, Kubernetes clusters, or Kubernetes namespaces. This lets you increase trace capture rates where you need them most without incurring the extended trace ingest.
If you use the extended trace ingest, the new setting also allows you to allocate that extra volume to the specific applications that need it most.
For more details about the trace ingest control, see Adjust adaptive trace sampling rate. To learn how to configure the new setting, see Settings API - Trace ingest control schema table.
Digital Experience | Users & Sessions
 Users & Sessions fully available in RUM on Grail Preview
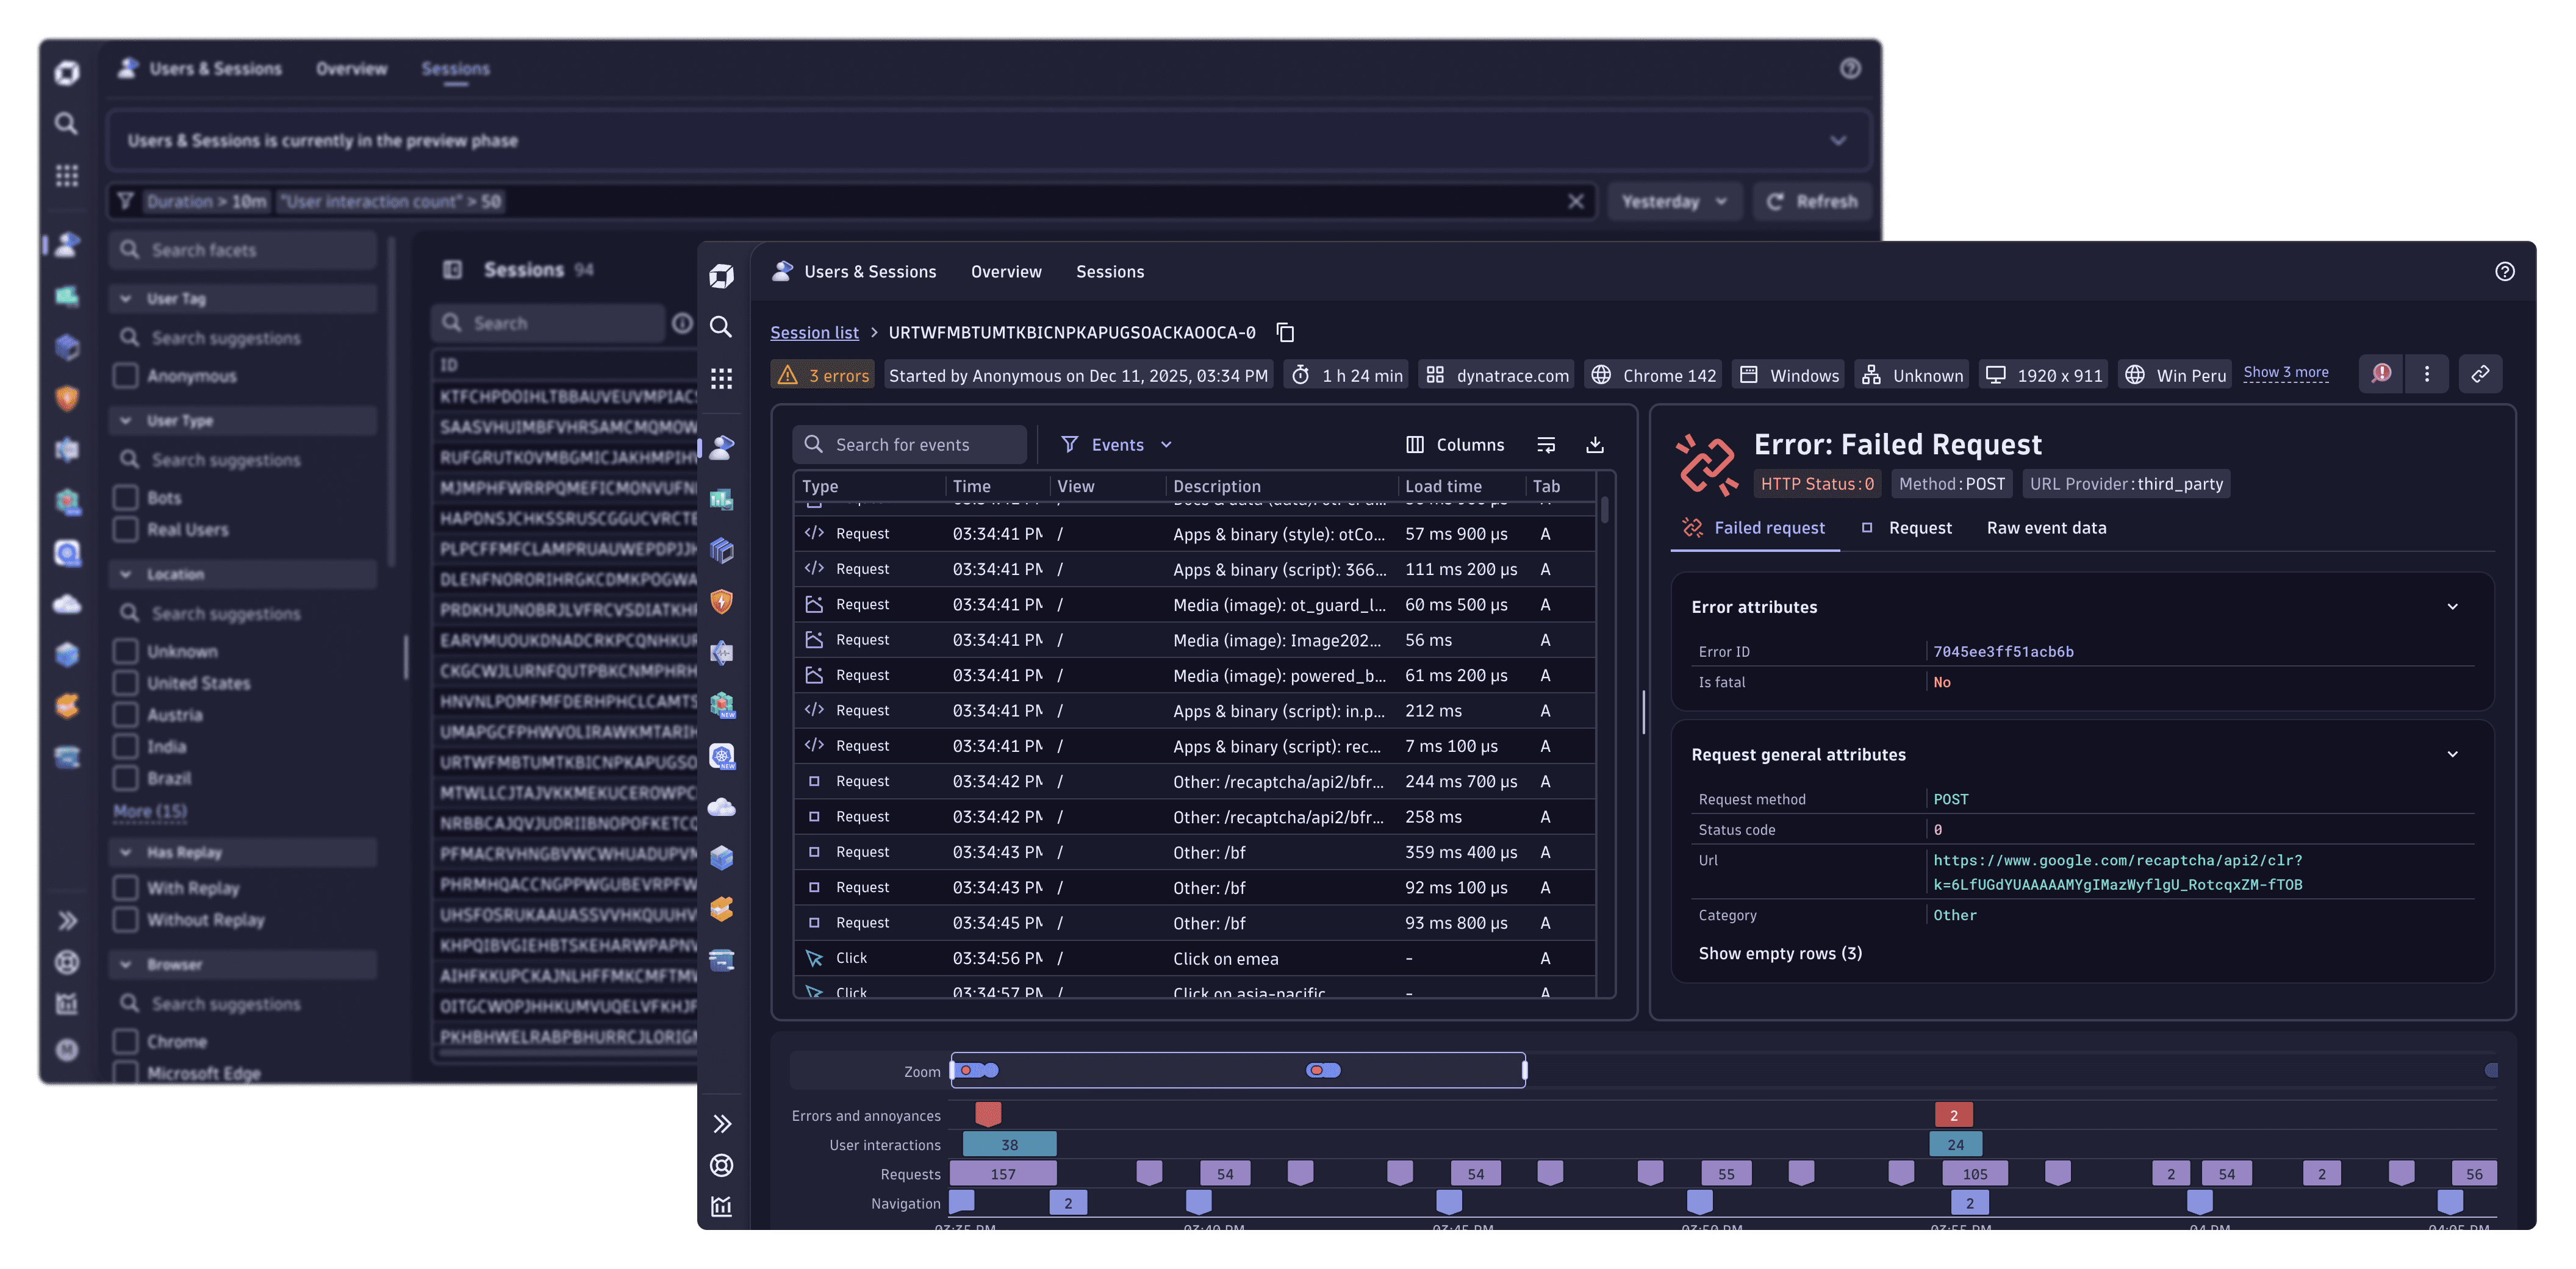
Users & Sessions (now in preview) provides session-level analysis and detailed insights into user interactions across your web and mobile applications.
New features
- The sessions list allows you to view all user sessions across your monitored frontends with a customizable timeframe. Each session displays a session ID, geographic location, browser details, and other relevant attributes. Advanced filtering options allow you to narrow down sessions based on attributes such as errors, user tags, browser types, and session duration.
- The session viewer displays a detailed timeline of events within a session, including navigation events, errors, and network requests. You can zoom into the timeline for focused analysis of events.
Use cases
- Troubleshooting—isolate the sessions with errors and analyze user interactions to identify root causes of issues.
- Customer support—use session data to validate customer complaints.
- Performance optimization—analyze session timelines and network requests to identify and resolve slow-loading pages or resource degradation.
- Product insights—understand user behavior, friction points, and navigation patterns to plan further feature development and UX improvements.
Availability
Users & Sessions is currently in preview. The full functionality is available only to the organizations participating in the RUM on Grail preview. The functionality is limited for the organizations not yet participating in the RUM on Grail preview. For details, see Users & Sessions.
Platform | Notebooks and Dashboards
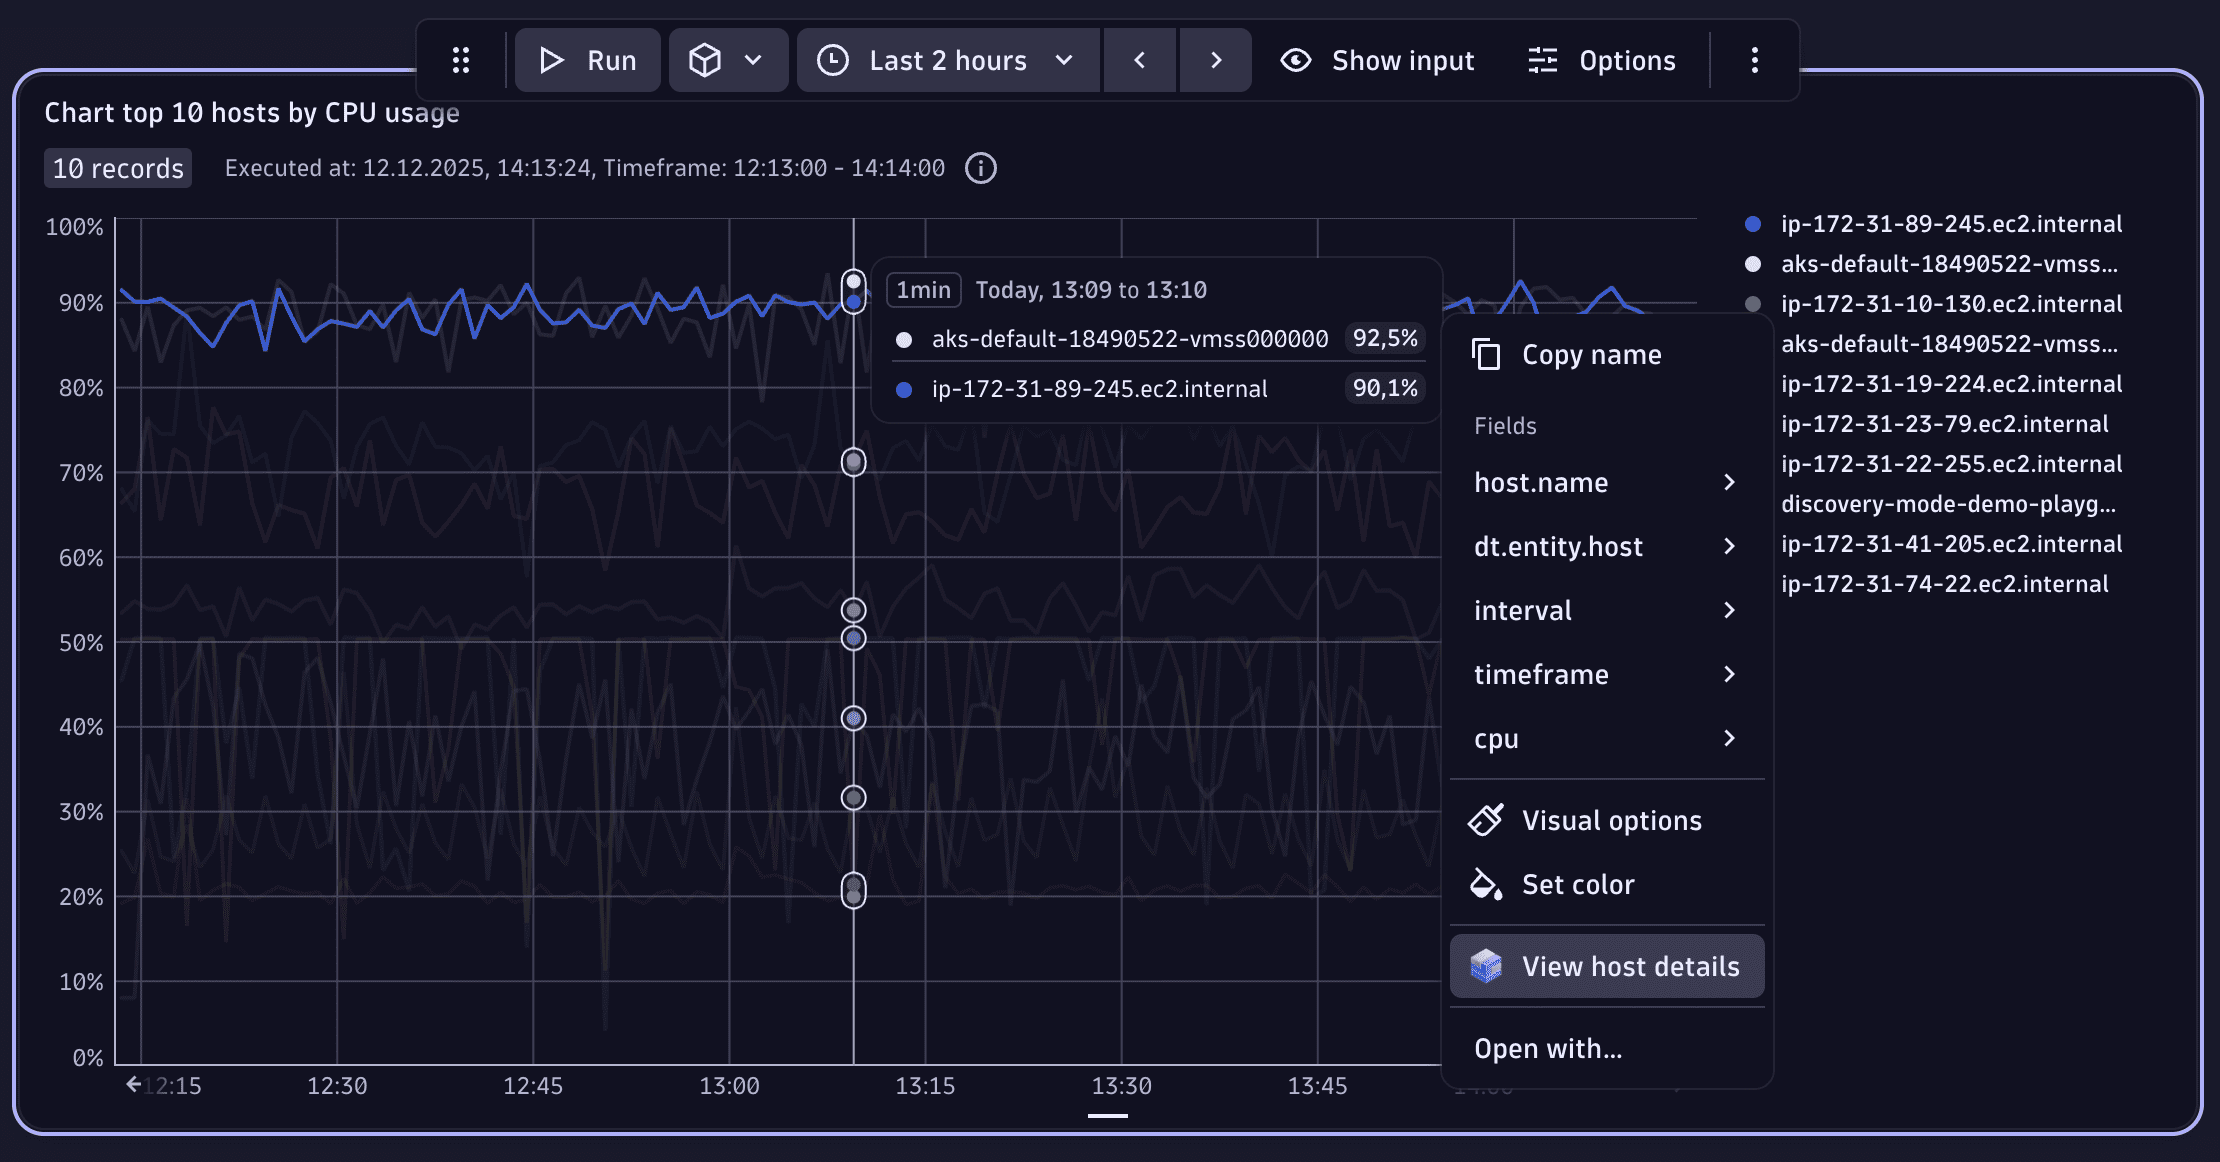
Conveniently drill down from tables and charts
With the latest versions of Notebooks and Dashboards, we have made it easier to navigate to entities from within tables and charts. Right-click on a table cell or pin the tooltip of a chart, and you'll see a recommended action leading to the most relevant app. Additionally, you can use the generic Open with… option to see the full list of possible navigation options.
Platform | Notebooks and Dashboards
AI-powered exploratory analysis from Notebooks and Dashboards
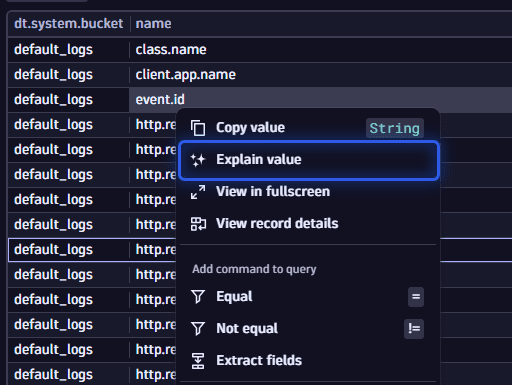
You can now ask Davis CoPilot to explain any data you see in Notebooks and Dashboards. Right-click on a table cell or pin the tooltip of a chart and select the Explain value option. This will trigger the Davis CoPilot Chat to assist you in your exploration. As the context is passed to the chat, you can even start asking follow-up questions to dive deeper.
Platform | Notebooks and Dashboards
Support for in() operator in Segments
In Segments, you can now also use the in() operator to define what to include within a segment.
Using the in() operator allows you to match against a list of strings.
You can also pass an array of strings via a Variables in segments.
Account Management
Usage insights for all Dynatrace Platform Subscription (DPS) rate-card categories are now available in Dashboards, Notebooks, and Automations
We've added usage insights for the following rate-card capabilities:
- Real User Monitoring (RUM), Real User Monitoring with Session Replay, and Real User Monitoring Property
- Third-Party Synthetic API Integration
- Kubernetes Platform Monitoring
- Mainframe Monitoring
You can now use dashboards, notebooks, and automations to access usage insights for all Dynatrace Platform Subscription (DPS) rate-card categories, which are available as BILLING_USAGE_EVENT system events in DQL.
Additionally, license administrators can use the Cost overview screen to get a deep dive into environment-level usage insights for all rate-card categories.
All
Ready-made dashboards just got better!
We’ve enhanced your dashboard experience to make insights clearer, faster, and more consistent across the board. Here’s what’s new:
-
OpenPipeline Usage Overview: Now includes event types for a more comprehensive picture, and the visual design has been aligned with other ready-made dashboards for a seamless experience.
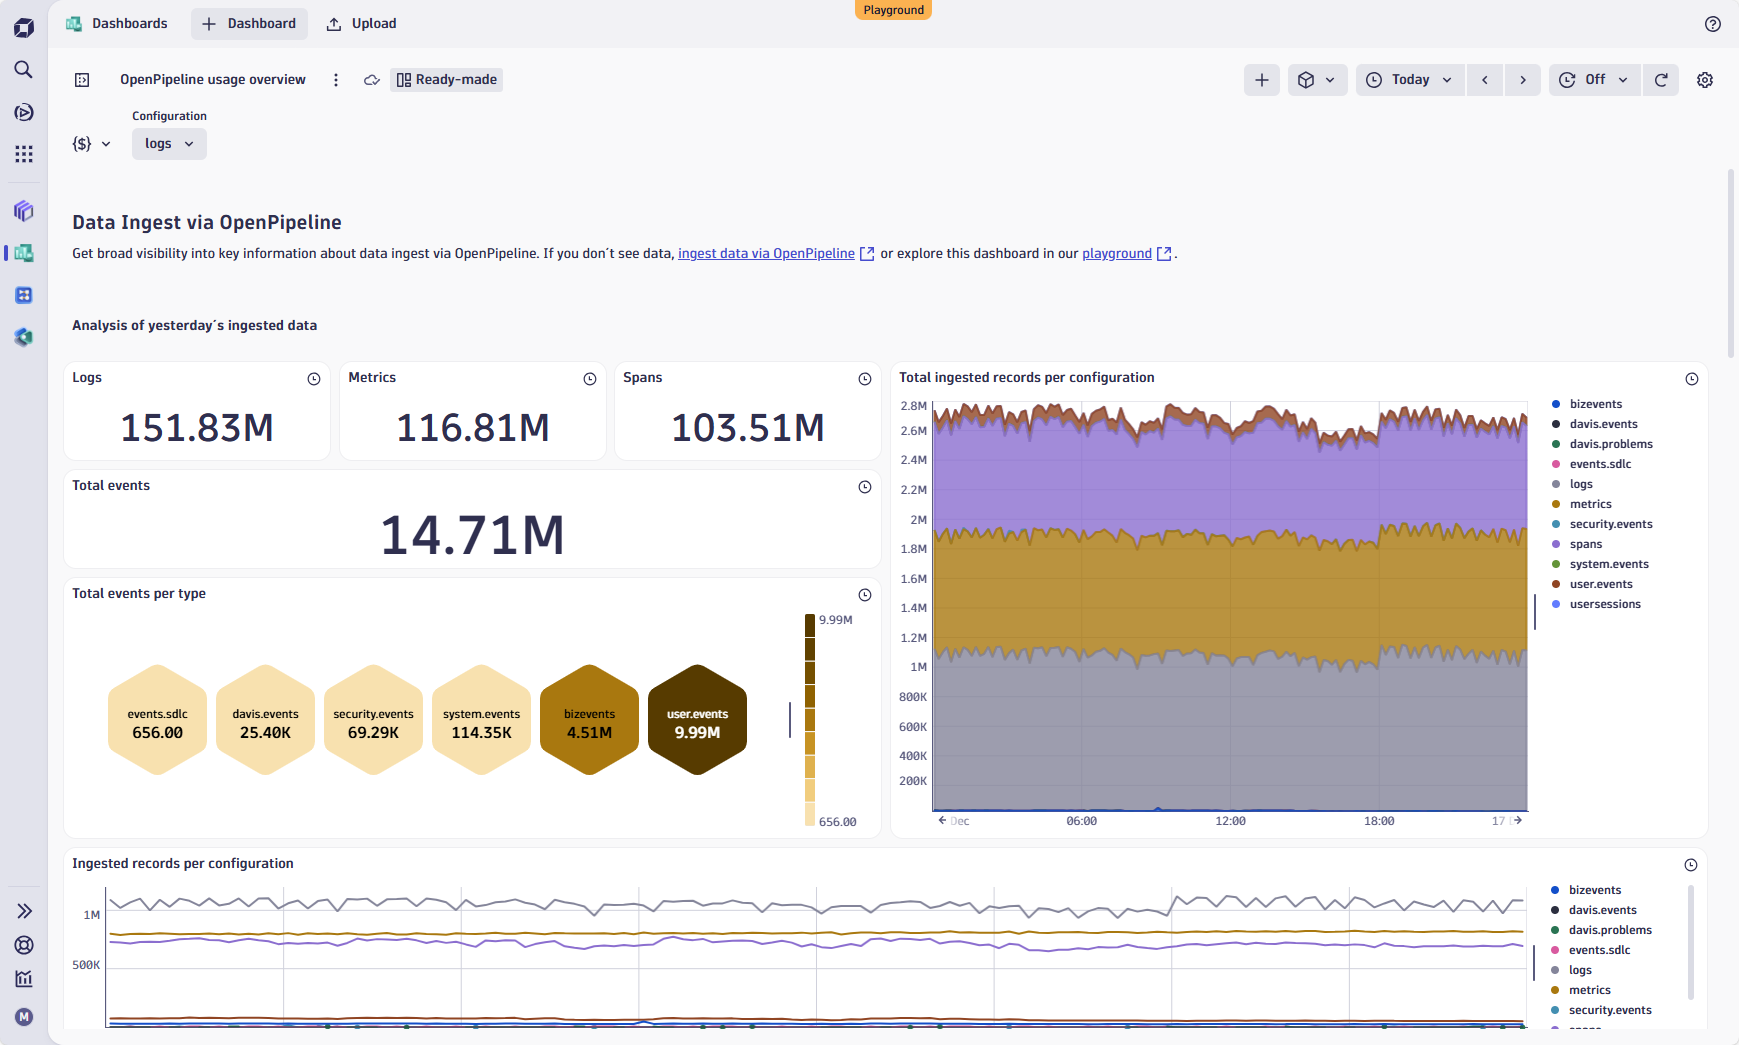 Ready-made dashboard
 -
Database Overview: Access key information, including database instances, services, and performance metrics, all in one place.
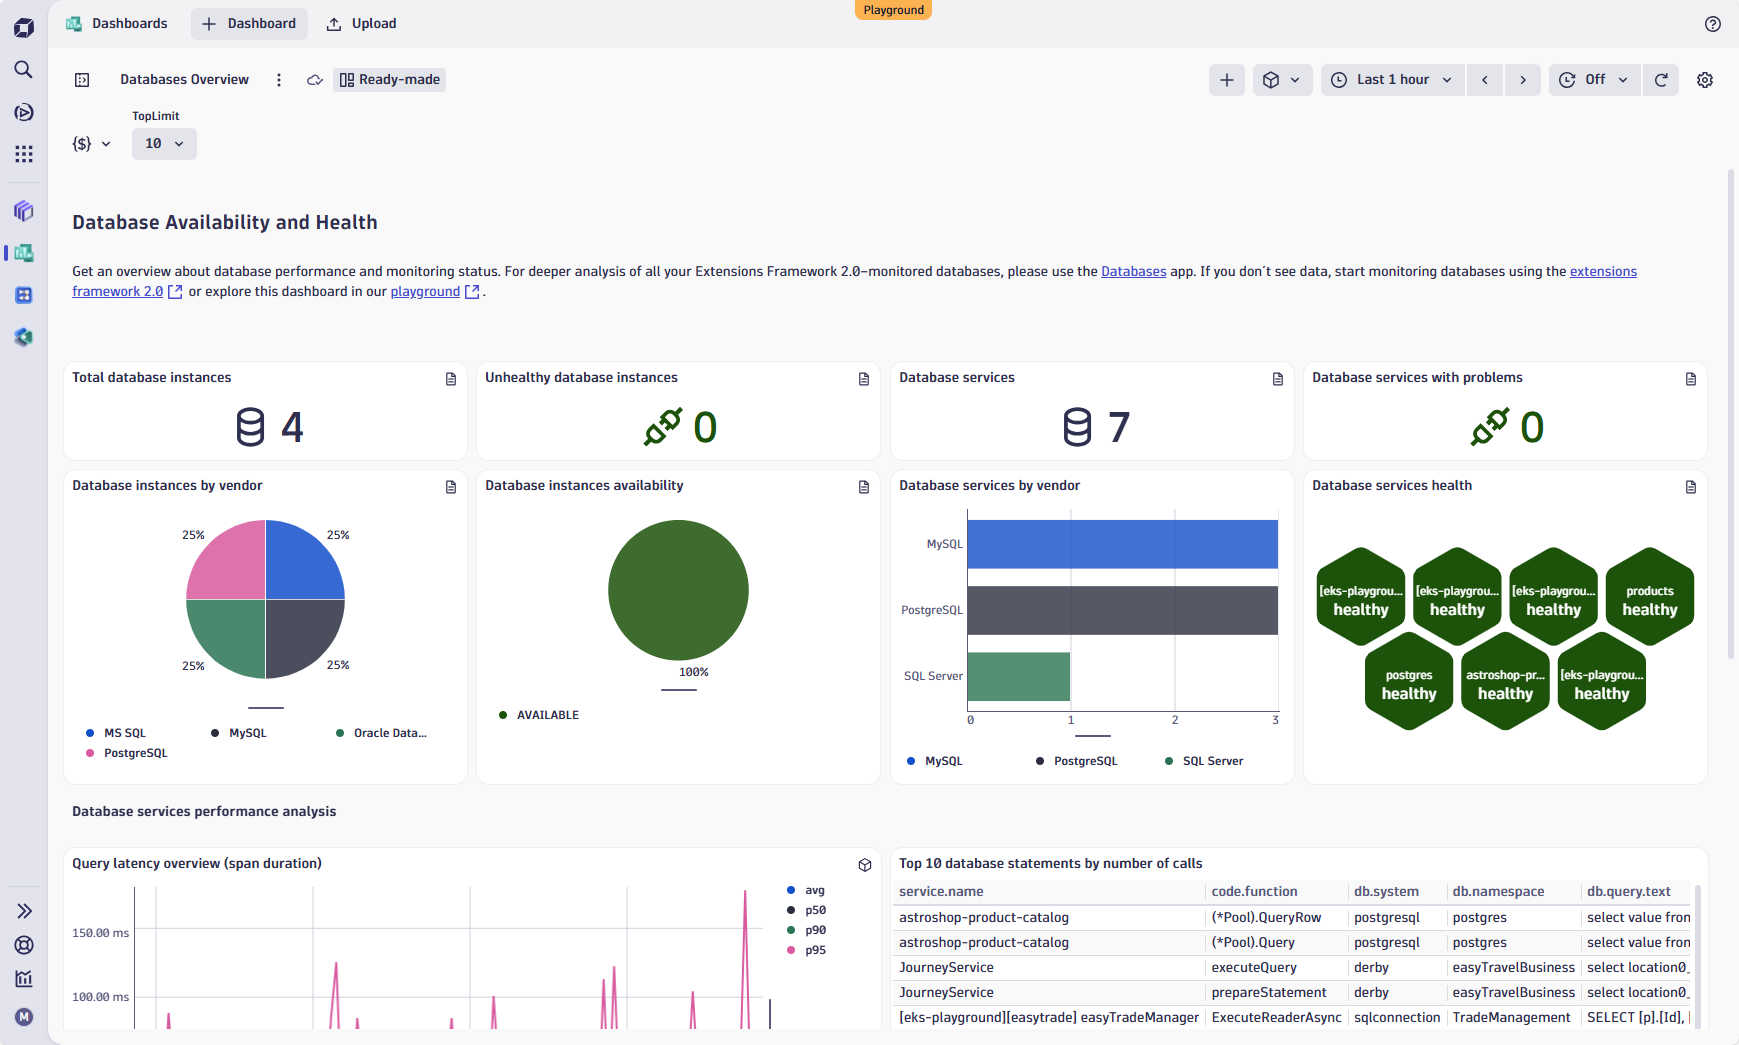 Ready-made dashboard
 -
Synthetic Web Monitors and Synthetic Network Monitors: Most important insights at first glance and consistent experience with other dashboards.
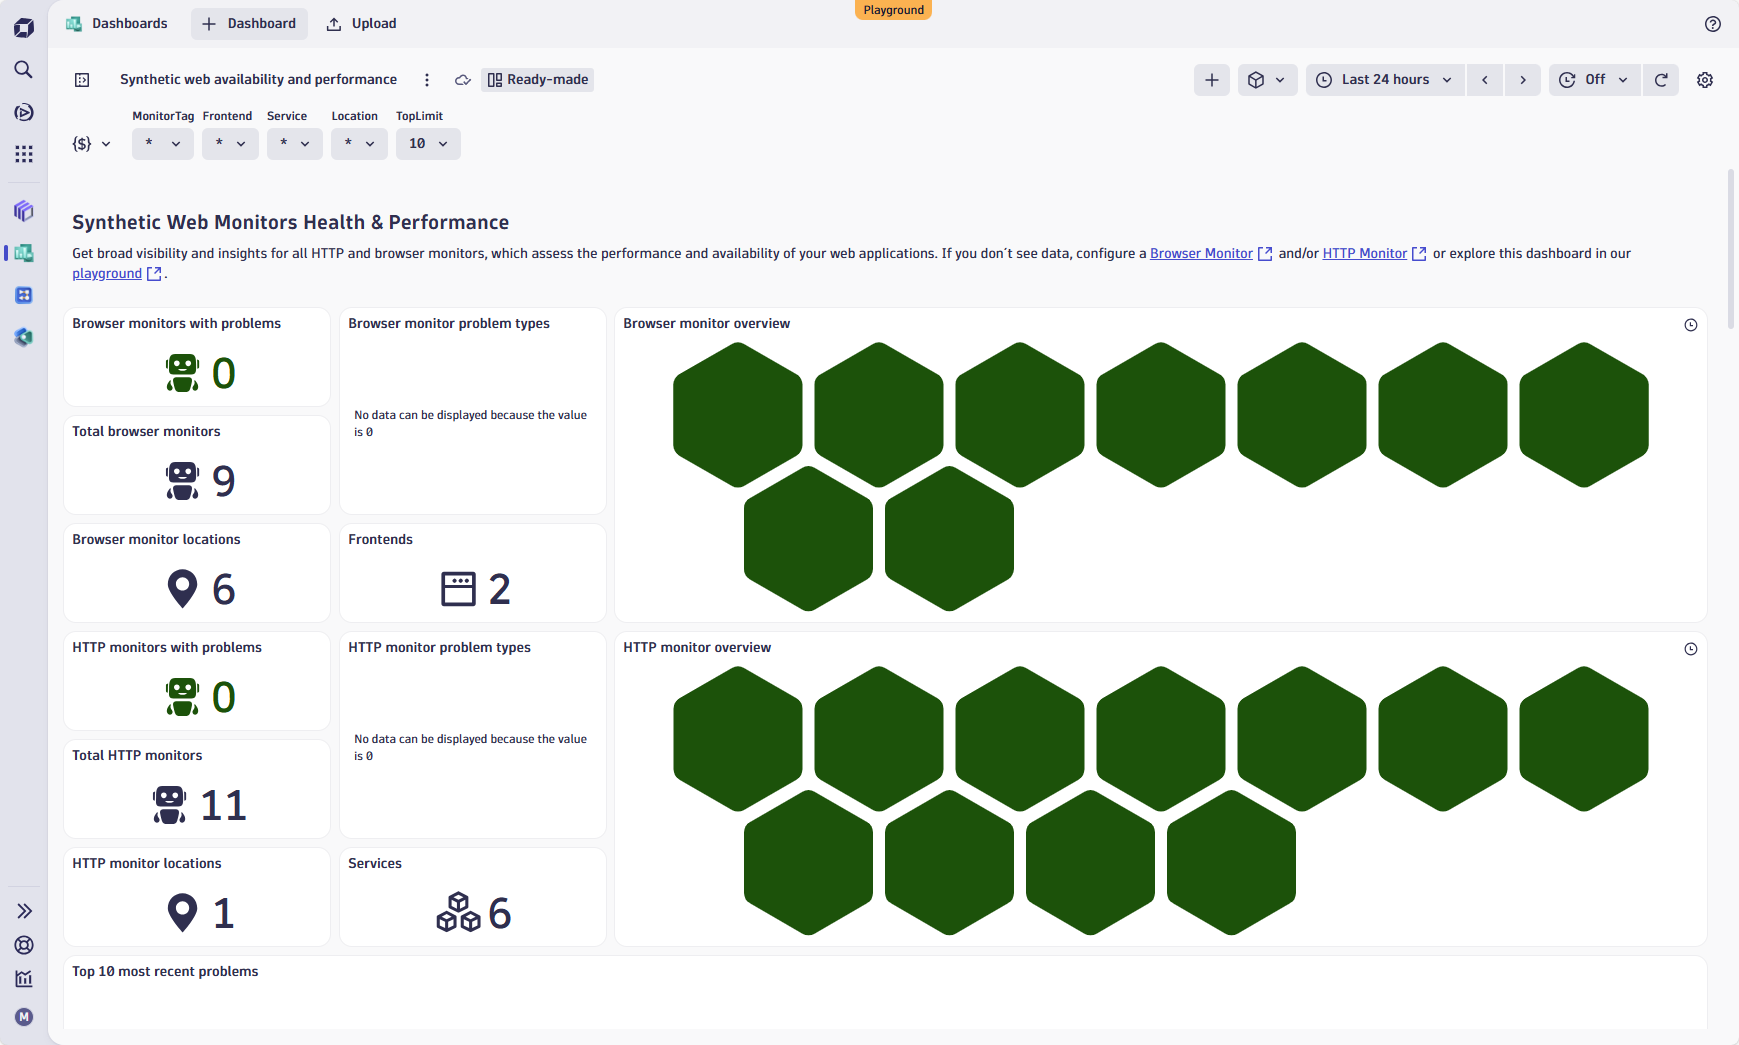 Ready-made dashboard
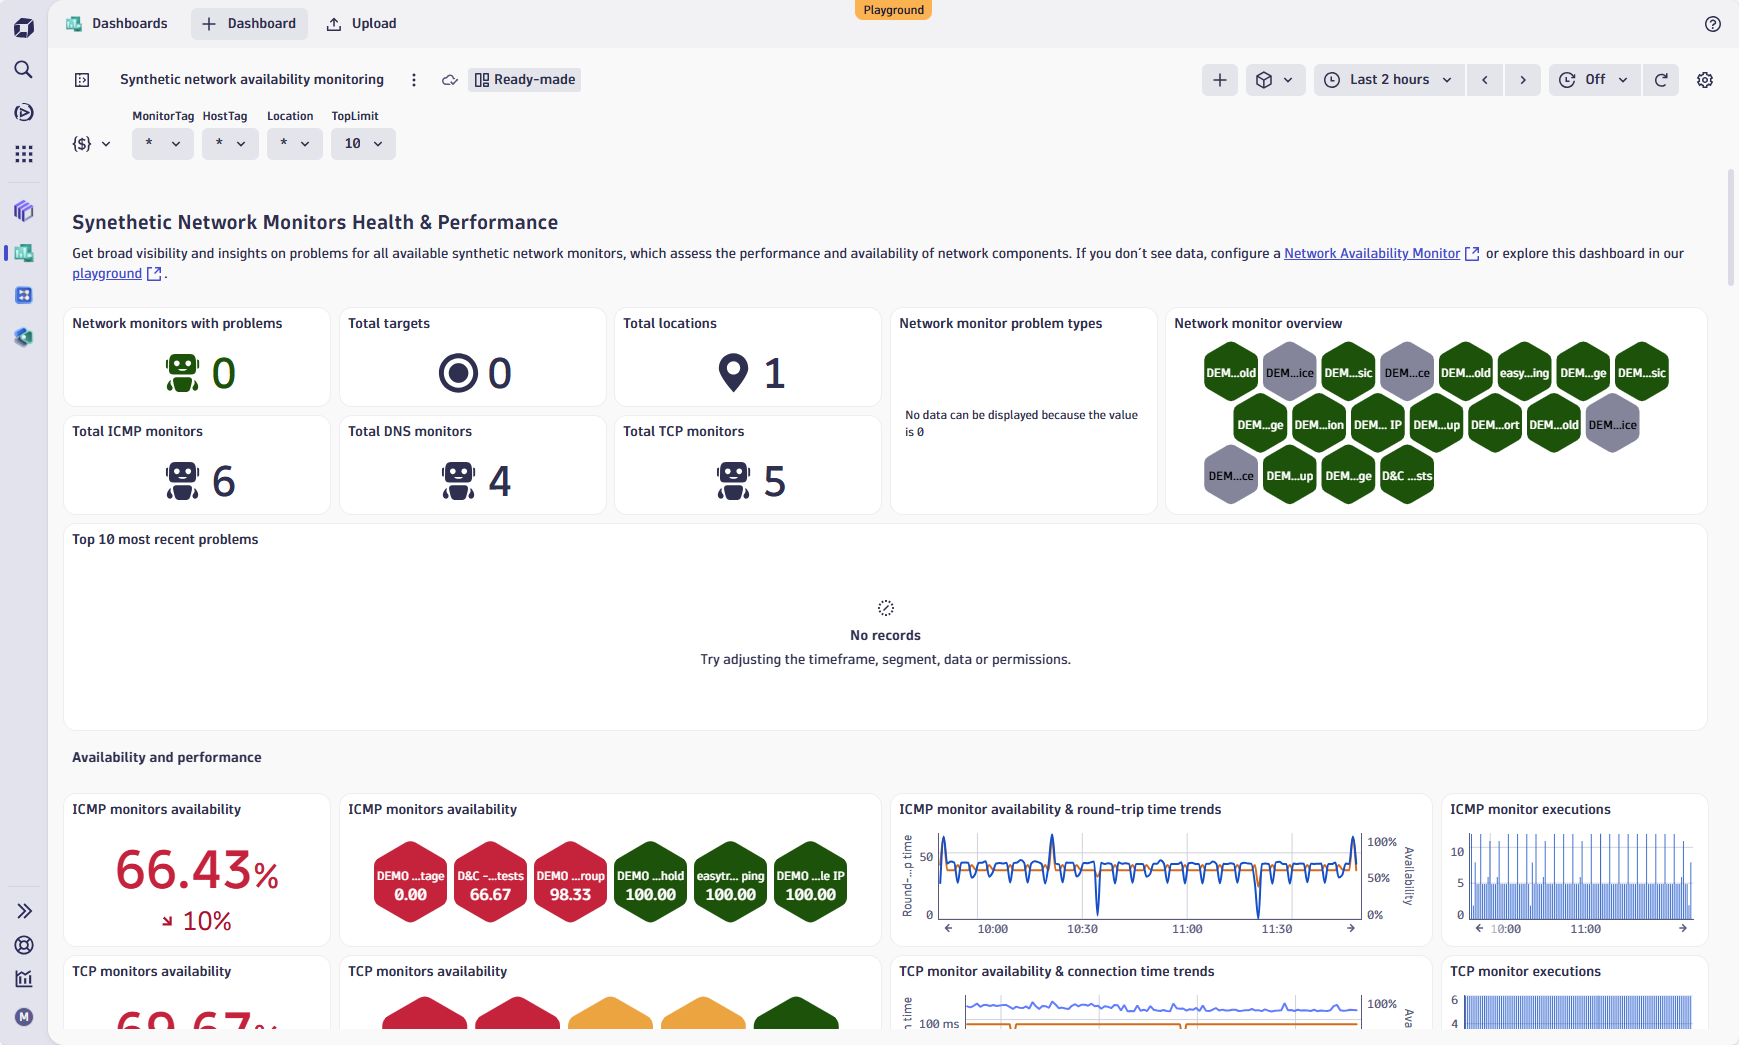 Ready-made dashboard
Breaking changes
Digital Experience
Limitations for string property values for user events and user sessions
The maximum length of string property values for user events and user sessions is now 1,000 characters.
Fixes and maintenance
Resolved issues in this release (SaaS)
- The
pathSegmentOpenPipeline configuration property of an ingest source can no longer be modified after the ingest source object is created. To use a different path segment, create a new ingest source object. (PPX-8129) - Resolved an issue with
App onlydeployments when multiple agents could overwrite each other's OneAgent version on the same host. (MGD-6868) - Fixed an issue with event template validation that prevented users from setting the
event.statusfield. (DI-24054)