VMware vSphere monitoring
- Dynatrace Classic
- How-to guide
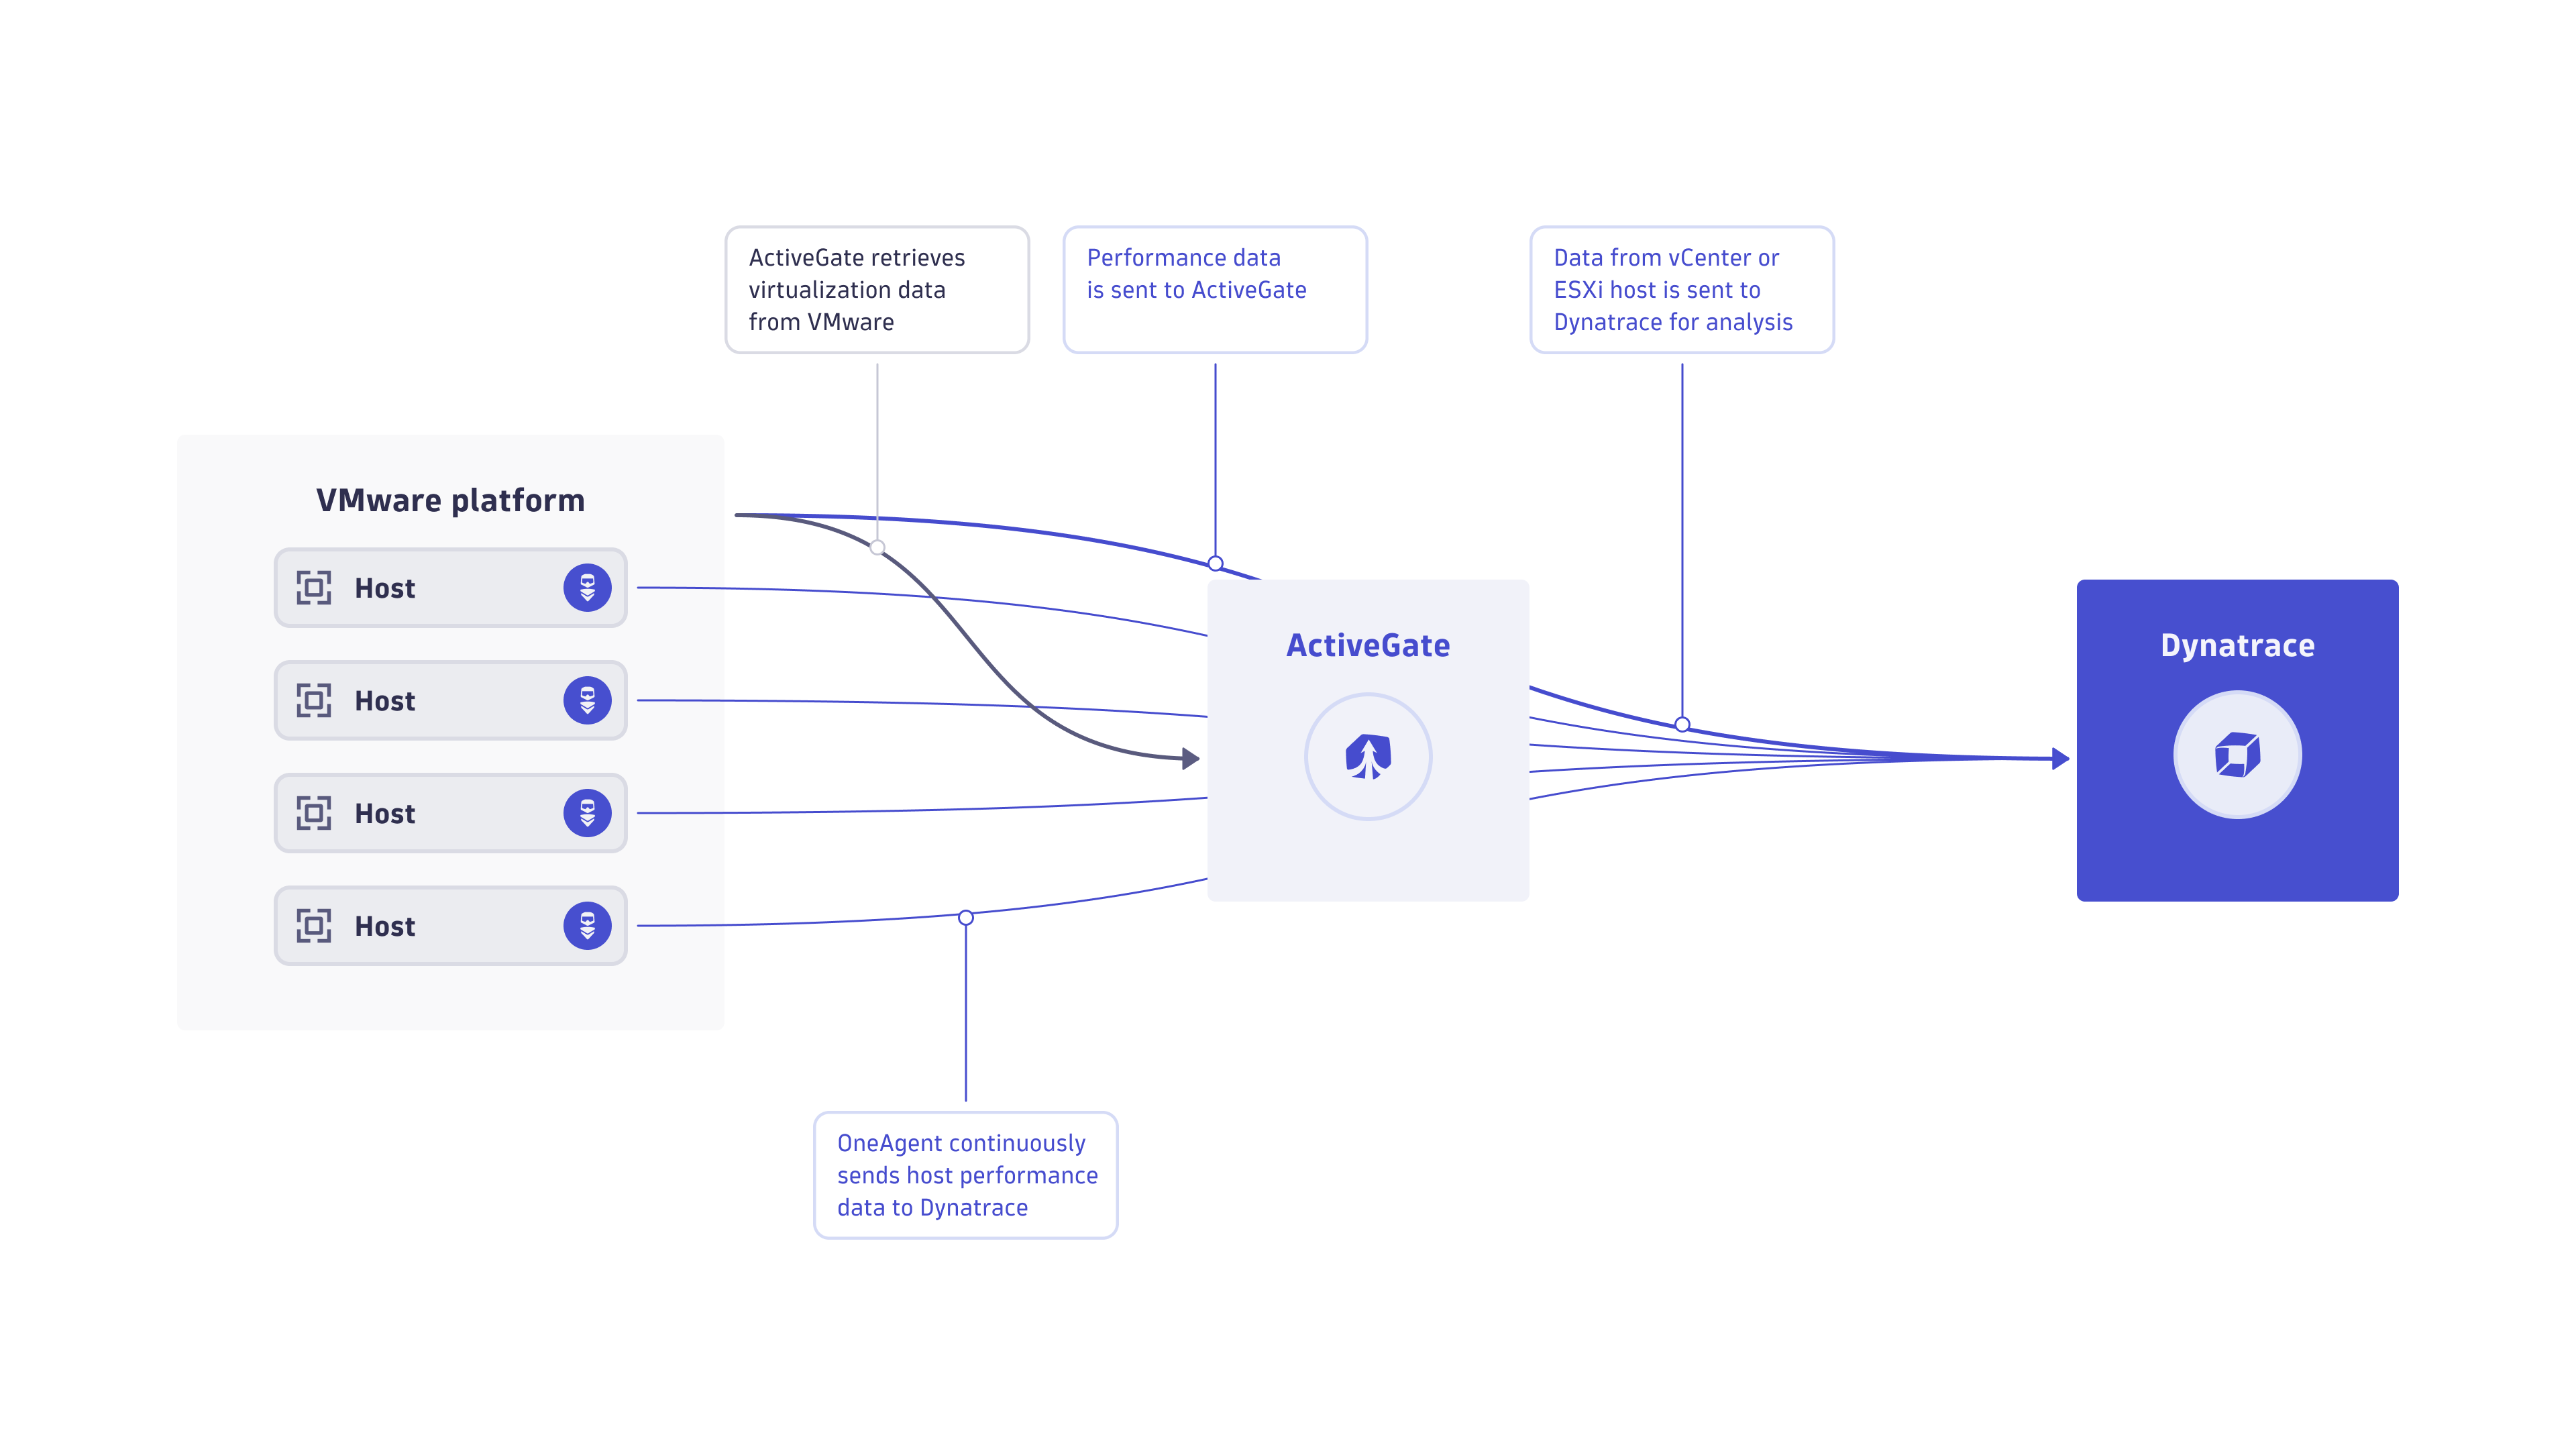
Setting up Dynatrace monitoring of a VMware platform is easy using ActiveGate as a communication gateway.
- ActiveGate receives the data from VMware and sends it to the Dynatrace Cluster.
- OneAgent, which is installed on each virtual machine, provides complementary data about your infrastructure health.

The following applies to VMware only. For other virtualization platforms, you only need to install OneAgent for virtualized host monitoring, as the monitoring of virtualization management layers is supported only for VMware.
Once Dynatrace OneAgent is installed and process monitoring is activated on a virtual machine, you can see what's happening in your operating system—specifically, how your host-based processes behave and communicate.
Dynatrace collects information related to virtualized CPU usage, memory consumption, and storage-related activities. Dynatrace also detects virtual machine migrations (vMotion) and the creation of new virtual machines.
Follow the steps below to set up monitoring on the virtualization management layer of your VMware vCenter or standalone ESXi hosts.
Prerequisites
- Read-only access to vCenter server, or access to the standalone ESXi host.
Install and configure ActiveGate
Install an Environment ActiveGate in your data center before connecting Dynatrace to your VMware platform.
For Dynatrace Managed you can use the embedded ActiveGate running on the cluster node. However, the Cluster ActiveGate is typically used to forward RUM and/or Synthetic monitoring data to the Dynatrace Cluster. We recommend that you don't overutilize this ActiveGate with another type of monitoring data. Depending on the VMware size, you might consider using a dedicated ActiveGate per environment.
For virtualization monitoring, the vmware_monitoring_enabled property in custom.properties must be set to true (default value).
See Customize ActiveGate properties for details.
Connect Dynatrace to your VMware platform
To connect Dynatrace to your VMware platform
-
Go to Settings > Cloud and virtualization > VMware, and select Connect new instance.
-
Select the IP address or name of the vCenter server or standalone ESXi host you want to monitor (skip the
http://orhttps://protocol prefix). -
Check the network/proxy settings.
If you get a communication error even though the data provided is correct, it might be because of your network/proxy settings. We recommend that you revise the network/proxy settings when adding a new VMware integration.Optional You can also bypass the proxy for connecting with vCenter or ESXi when configuring the VMware integration. Modify ActiveGate configuration to exclude a specific host from the proxy.
-
Enter the associated user credentials so that ActiveGate can sign in and collect monitoring data. The required privileges for this user are view and read-only access. Administrator-level access isn't required to enable monitoring (no changes to your VMware settings are required).
You don’t need to add ESXi hosts individually if they're managed by a vCenter server.
-
ActiveGate version 1.268+ Specify a filter condition to limit the number of monitored clusters:
$prefix(parameter)—property value starts withparameter$eq(parameter)—property value exactly matchesparameter$suffix(parameter)—property value ends withparameter$contains(parameter)—property value containsparameter
-
Select Test connection to verify that the entered data has successfully connected to your vCenter.
CredentialsThe credentials are no longer validated automatically, so it's important to provide valid credentials that connect to your vCenter. If you provide invalid credentials, Dynatrace will still attempt to connect to your vCenter, which can create unnecessary network traffic.
If your credentials for a particular vCenter change over time and you forget to update them in the settings, Dynatrace will detect five failed attempts to connect to your vCenter. After this, this setting will be disabled to prevent your VMware account from being blocked.
-
Select Save changes.
Time synchronizationDifferences in system time can lead to missing VMware metrics. For Dynatrace to properly display monitoring data, synchronize time settings on all monitored host environments and vCenters with an NTP server.
To cover your entire virtual infrastructure, repeat these steps for all other vCenter servers or standalone ESXi hosts in your environment.
Limit VMware infrastructure monitoring
After you set up VMware monitoring, you might want to limit which infrastructural elements (such as hosts and VMs) should actually be monitored by Dynatrace. To do this, you can use the permissions mechanism available in VMware. For more information, see Limit VMware infrastructure monitoring using permissions.
Troubleshoot VMware connection
- Option 1 - vCentre Event Console
- Option 2 - VMware PowerCLI Windows only
- Monitoring invalid credentials
Configure vSphere monitoring using Settings API
You can use the Settings API to configure VMware vSphere monitoring.
- To learn the schema, use GET a schema with
builtin:virtualization.vmwareas the schemaId. - Based on the
builtin:virtualization.vmwareschema, create your configuration object. - To create your configuration, use POST an object.