Create an HTTP monitor (classic)
- How-to guide
- 6-min read
- Published Aug 20, 2018
You can create synthetic HTTP monitors to check the availability of your resources—websites or API endpoints. Because HTTP monitors can be executed by an Environment ActiveGate, you can use them to check the availability of internal resources that are inaccessible from outside your network.
HTTP monitors can be run from our global public or private Synthetic locations, or from cluster-wide private locations in Dynatrace Managed.
See Create a private Synthetic location for details on using ActiveGate for Synthetic Monitoring. See Requirements for private Synthetic locations for more information on supported Windows and Linux versions.
Create a new HTTP monitor
-
Go to Synthetic Classic > Create a synthetic monitor > Create an HTTP monitor.
-
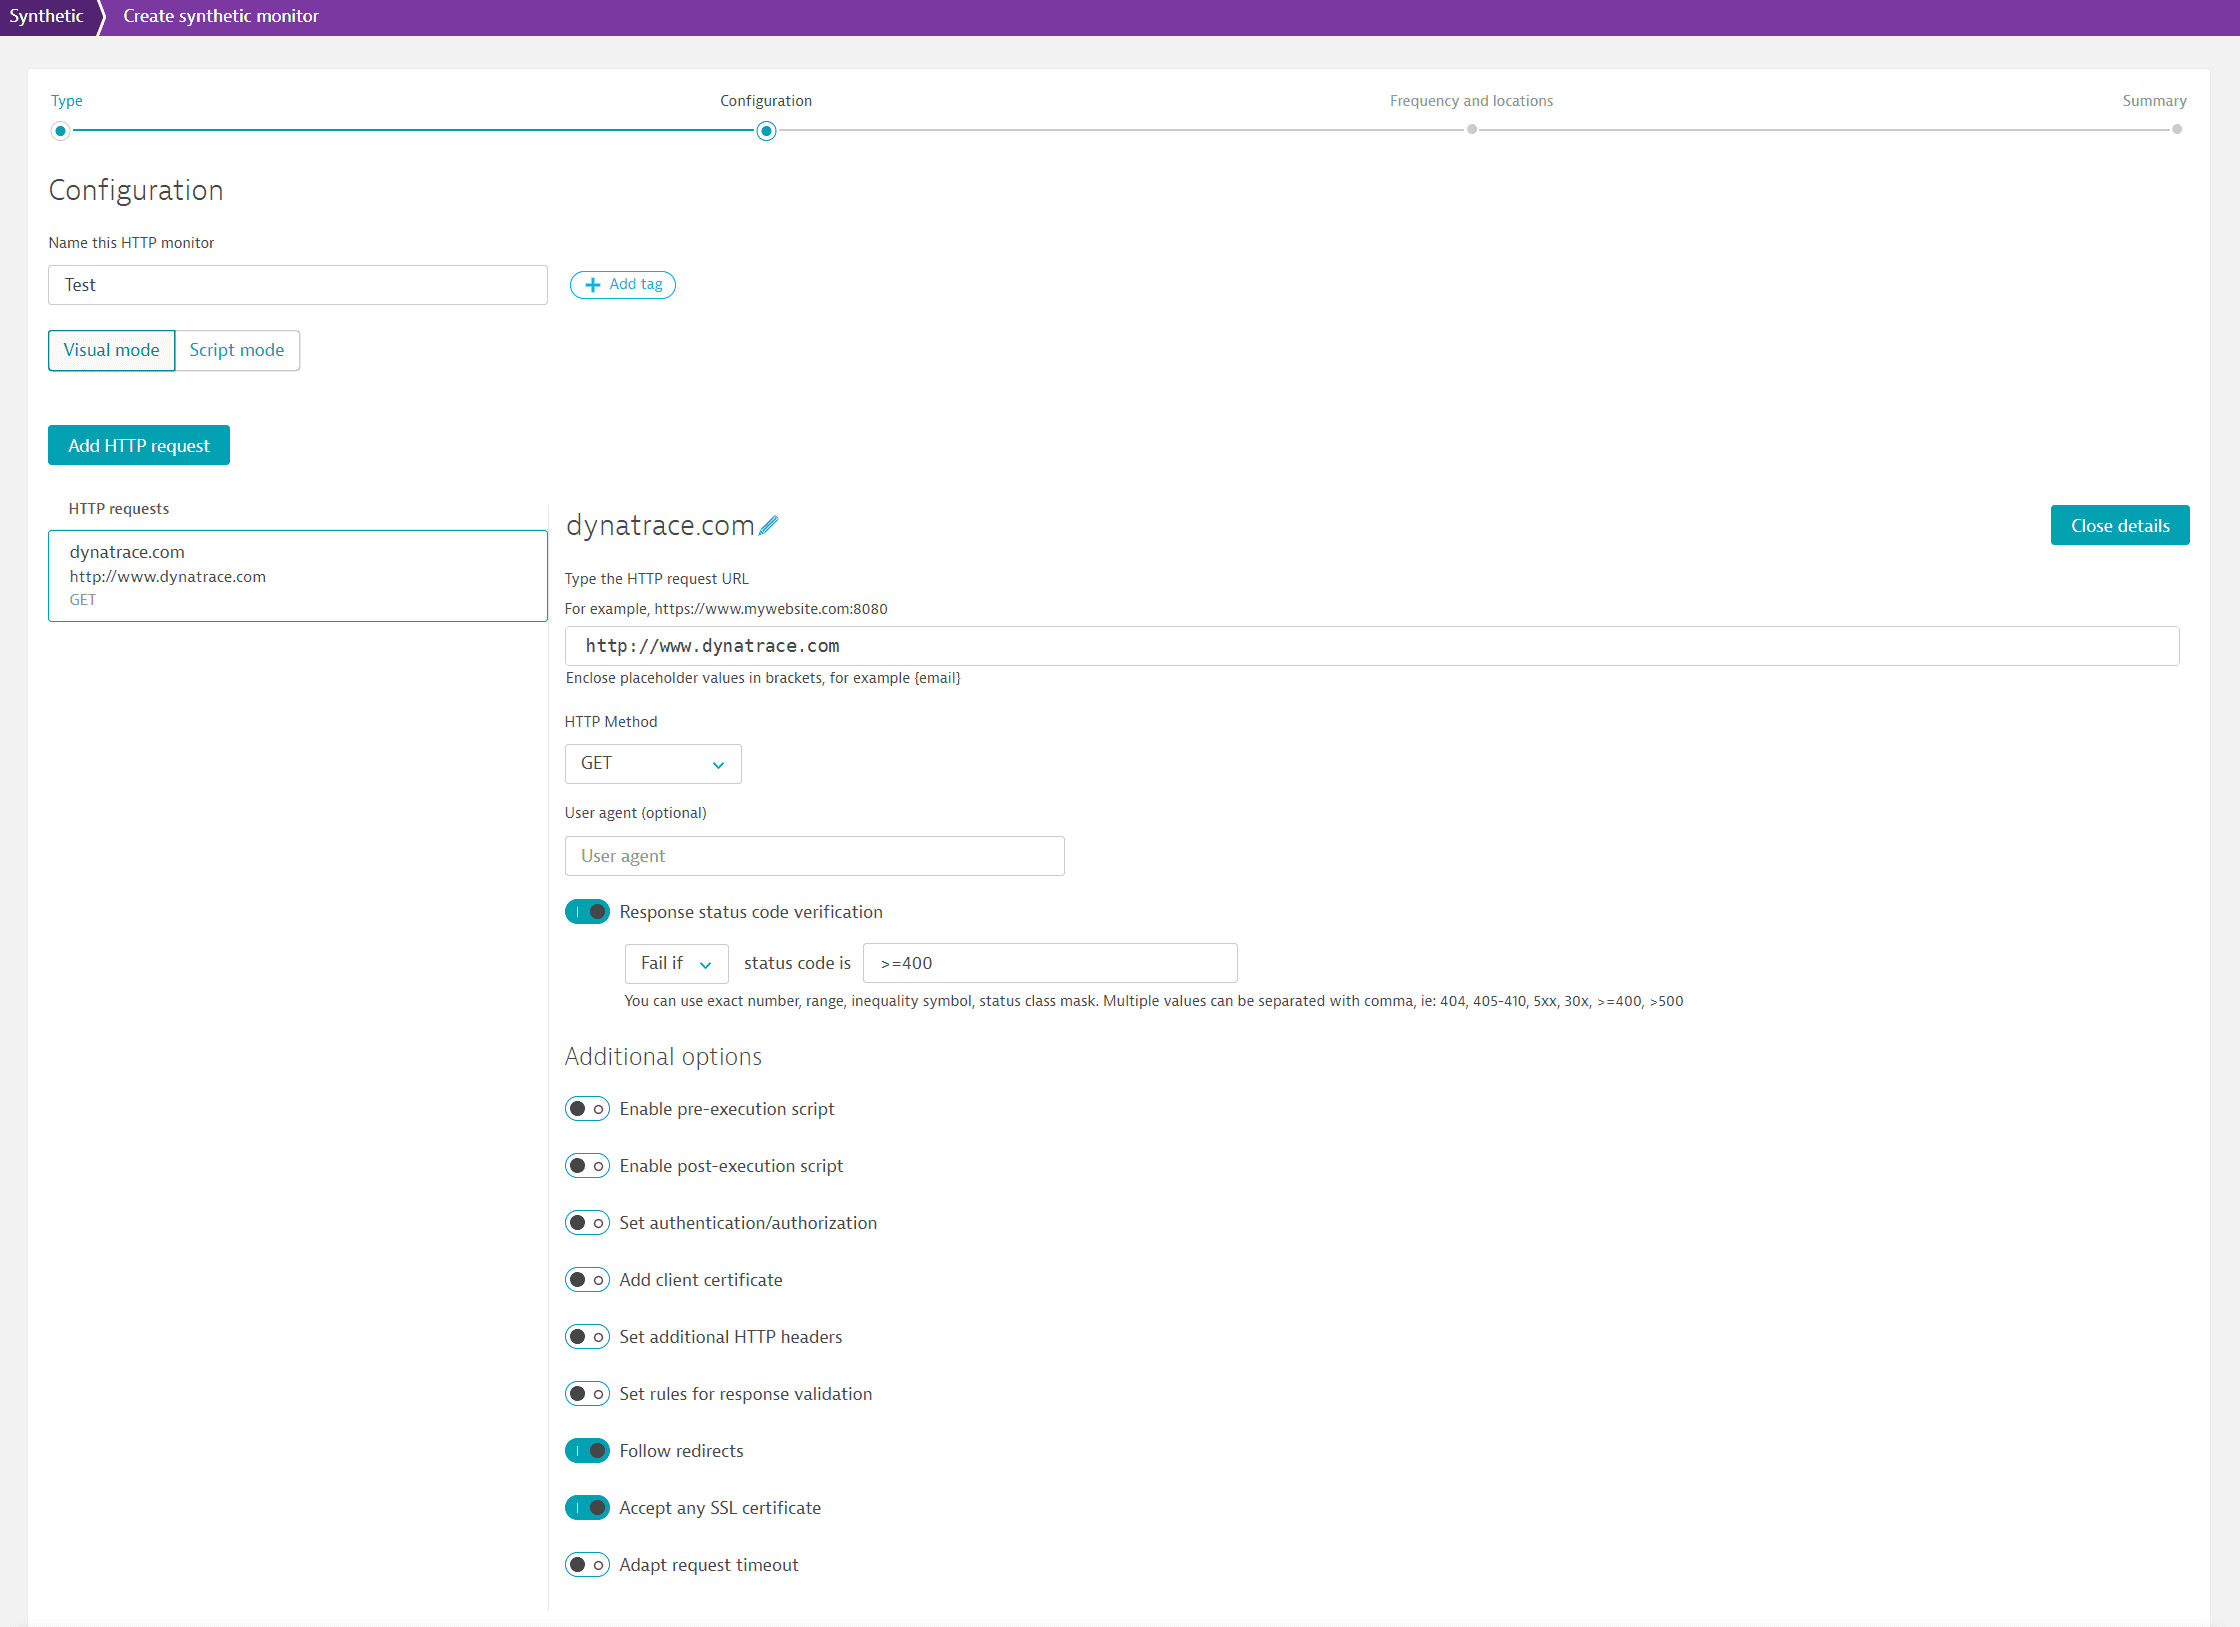
Name this HTTP monitor—Enter a name (up to 500 characters) for the synthetic monitor. This name should generally describe all the requests in this HTTP monitor.
-
Select Add tag to apply manually created tags to the monitor. You can choose from auto-complete suggestions as you type or create your own. (After the monitor has been created, you can manage tags from the HTTP monitor details page.
-
Visual mode (default) enables you to view and set up HTTP requests through UI controls. Script mode enables you to view and edit request settings as a JSON script. You can switch between visual and script mode as you set up your monitor.
-
Add an HTTP request (Add HTTP request).
-
Specify the request type (Choose request type) and enter the basic request settings.
-
HTTP request—Enter the request URL, enter the request Name (if the default is insufficient), and select an HTTP method. Next, select Add HTTP request to create the request and display expanded settings.
To enhance synthetic monitor security, Dynatrace blocks monitors from sending requests to a local host (for example,
localhostor127.0.0.1). -
OAuth2 authorization request—Enter the Access token URL and give the request a Name (if the default is insufficient). Next, select Add OAuth2 authorization request to create the request and display expanded settings.
See Supported authentication methods in Synthetic Monitoring for more on using OAuth 2.0 authentication.
Once you've added a request, you cannot change the request type.
-
-
Once you've created your request, in the expanded request settings, fully configure the basic request settings, including an optional User agent and specifying success/failure based on Response status code verification.
In the expanded request settings, you can add token credentials to the HTTP request URL—see more in Configure HTTP monitors.
-
Configure Additional options for the request, which vary based on the request type.
See details in Configure HTTP monitors.
-
-
You can add multiple HTTP requests—select Add HTTP request again and repeat the steps above for describing the additional request.
-
After you have defined one or more requests for this HTTP monitor, select Next in the lower-left corner to specify monitor frequency and locations.
-
Choose monitor frequency. Scroll down to select locations. Your private and public locations are displayed by continent. Your selections are displayed on the map.
See more on monitor frequency and locations in Configure HTTP monitors.
-
Select Next for a final review of monitor settings.
-
On the Summary page, review the properties of your HTTP monitor and select Create HTTP monitor to save your changes and activate the monitor.
The HTTP monitor details page is displayed and starts showing results data as it's acquired.
Select the expand button  from the quick links in the upper-left corner to access monitor settings. (Or, if you're viewing the older version of the details page, select the Browse button (…) > Edit to make changes.)
You can configure several additional settings such as outage handling and performance thresholds that are available only after monitor creation. For more on monitor settings, see Configure HTTP monitors.
While you cannot play back an HTTP monitor locally, you can execute it on demand from assigned locations.
View the analytics of an HTTP monitor
- Go to Synthetic Classic.
- Optional Select HTTP on the left to filter the list for HTTP monitors.
- From the list of HTTP monitors, select the monitor you want to examine.
The details page of each monitor displays monitoring analytics, including:
- Availability
- Performance (response time)
- Response size
- HTTP status codes
Enable, disable, or delete an HTTP monitor
Monitors are enabled by default when you create them.
Disabling a synthetic monitor suspends further executions but retains the monitor and its measurement data. Any open performance and availability problems time out when a monitor is disabled (see Synthetic calculations for details). Deletion removes a monitor and its associated measurement data; this is irreversible. Before deleting a monitor, we recommend that you disable it first and ensure that you no longer require its measurement data.
To disable or delete a monitor
-
Go to Synthetic Classic.
-
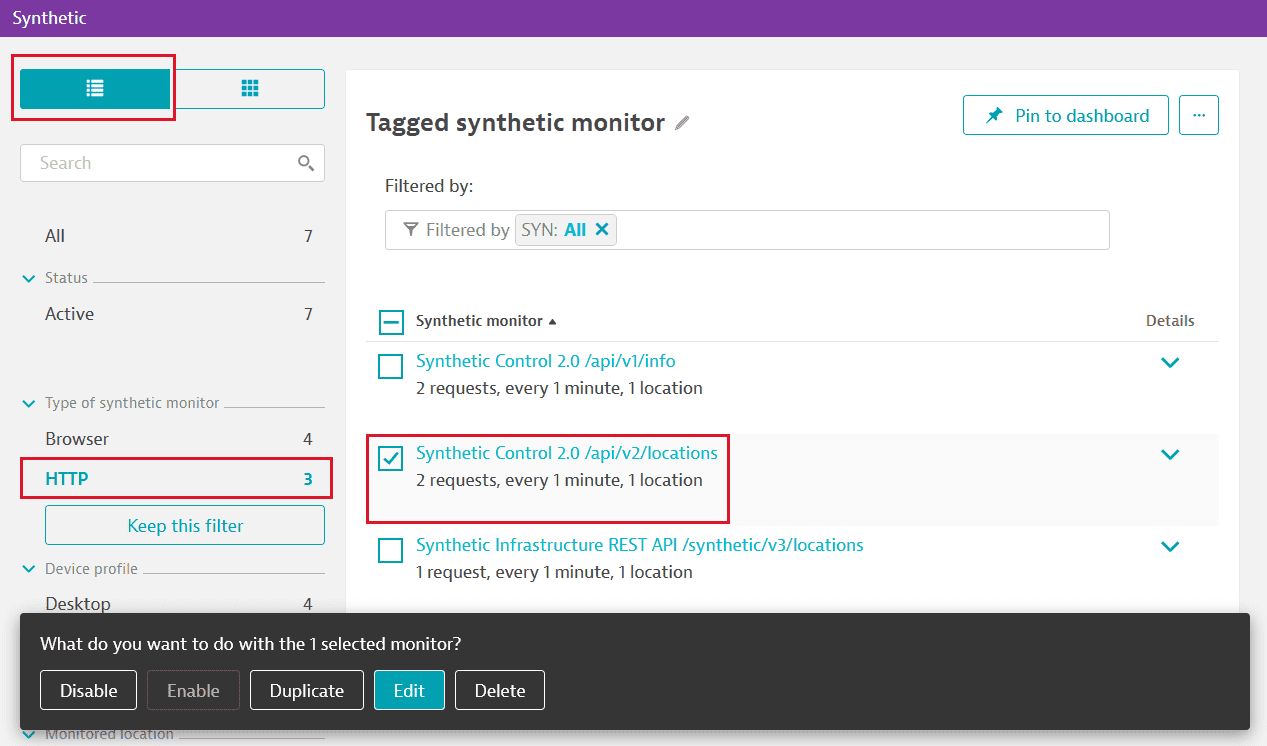
Opt to view your monitors in list format.
-
Optional Select HTTP on the left to filter the list for HTTP monitors.
-
Select the check box for the monitor you want to delete or disable.
-
Select Delete or Disable in the lower-left corner.
You can also disable or delete a monitor from the details page.
-
Go to Synthetic Classic.
-
Select the monitor you're interested in.
-
Select the expand button
from the quick links in the upper-left corner.Or, if you're viewing the older version of the details page, select the Browse (…) button in the upper-right corner.
-
Select either Disable or Delete.
Similarly, you can enable a previously disabled monitor.
-
In Synthetic Classic, opt to view your monitors in list format. Check the box next to your disabled monitor and select Enable in the lower-left corner.
-
On the HTTP monitor details page, select the expand button
in the upper-left corner > Enable.If you're viewing the older version of the details page, select the Browse (…) button in the upper-right corner > Enable.
Synthetic monitor execution may be disabled during a maintenance window in maintenance window settings.
Duplicate an HTTP monitor
-
Go to Synthetic Classic.
-
Opt to view your monitors in list format.
-
Optional Select HTTP on the left to filter the list for HTTP monitors.
-
Select the check box for the monitor you want to duplicate.
-
Select Duplicate in the lower-left corner.
The duplicate monitor page is displayed with a number appended to the original name.
-
To edit the default name and make other configuration changes, select the expand button
> Edit.If you're viewing the older version of the details page, select the Browse (…) button > Edit.
Note that the duplicate monitor is disabled by default. You must enable it in order to start seeing data.
Bulk HTTP monitor management
-
Go to Synthetic Classic.
-
Optional Select HTTP on the left to filter the list for HTTP monitors.
-
Select the check box for each monitor you want to manage.
Applicable command buttons are displayed in the lower-left corner of the page.
-
Select the option you want to apply to all selected monitors: Delete, Disable, Enable, Duplicate, or Edit.
Bulk monitor management options
When selecting multiple HTTP monitors for bulk management:
-
If a button is unavailable, that option does not apply to all selected monitors. For example, if all selected monitors are active, the Enable button is grayed out.
-
The Duplicate button is not available when you select more than one monitor.
-
If you select a mix of active and inactive monitors, both the Enable and Disable buttons are displayed. If you select one of these options, it is only applied to the applicable monitors.
-
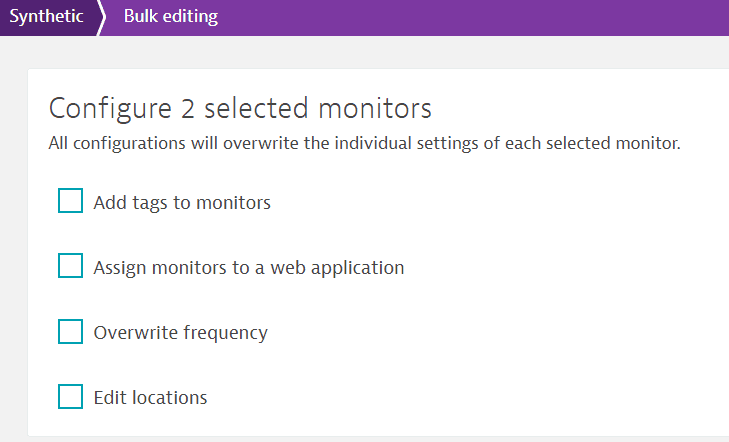
The bulk Edit option only enables you to change certain features of the selected HTTP monitors—you can overwrite monitor frequency, change or add locations, add tags, and change associated applications.
Related topics
 Synthetic Classic