Understand and manage Code Monitoring consumption (DPS)
- Latest Dynatrace
- Explanation
- 5-min read
Code Monitoring is a DPS capability that provides real-time, code-level visibility into running applications, enabling developers to debug and analyze production code without redeployments or issue reproduction.
This page explains how Code Monitoring consumption is calculated, and how you can manage your Code Monitoring spend in Dynatrace.
Code Monitoring consumption is primarily tied to the use of  Live Debugger. For more information, see Live Debugger.
How consumption is calculated
Code Monitoring consumption is measured in container-hours, using the Code Monitoring rate card item.
Key terms
- Container
In the context of Code Monitoring, a container represents a concurrent process monitored at the code level. For containerized workloads, each container with OneAgent running counts as one concurrent process. For non-containerized workloads, each concurrent process running on the host is counted individually.
- Concurrent process
In the context of Code Monitoring, a concurrent process is an instrumented process that is actively running and reporting code-level data to Dynatrace. When multiple instrumented processes run on a single host, each process is counted separately and all counts are summed toward container-hour consumption.
- Container-hour
The unit of measure for Code Monitoring. Container-hours are used to calculate Code Monitoring consumption, and apply to both containerized and non-containerized workloads. Containerization is not required to use Live Debugger or to be billed for Code Monitoring.
What's included in a container-hour
Each container-hour of Code Monitoring includes:
-
10 days of retention.
-
Live Debugger snapshots under fair use.
Fair use means usage that aligns with typical customer patterns, your contracted consumption, and the feature's intended purpose. As a guideline, this means 6 GiB per 24-hour interval (equivalent to 0.05 GiB per container-hour), pooled across all containers within the 24-hour interval.
If your usage materially exceeds fair use, Dynatrace may notify you and subsequently apply charges at the applicable line item on the rate card.
Counting rules and billing granularity
Each concurrent process that is actively monitored generates one container-hour of consumption per hour. Consumption is independent of container memory size, CPU allocation, or the language/runtime being monitored.
- Consumption begins when a process starts being monitored at code level.
- Consumption stops when the process terminates or code-level monitoring ends.
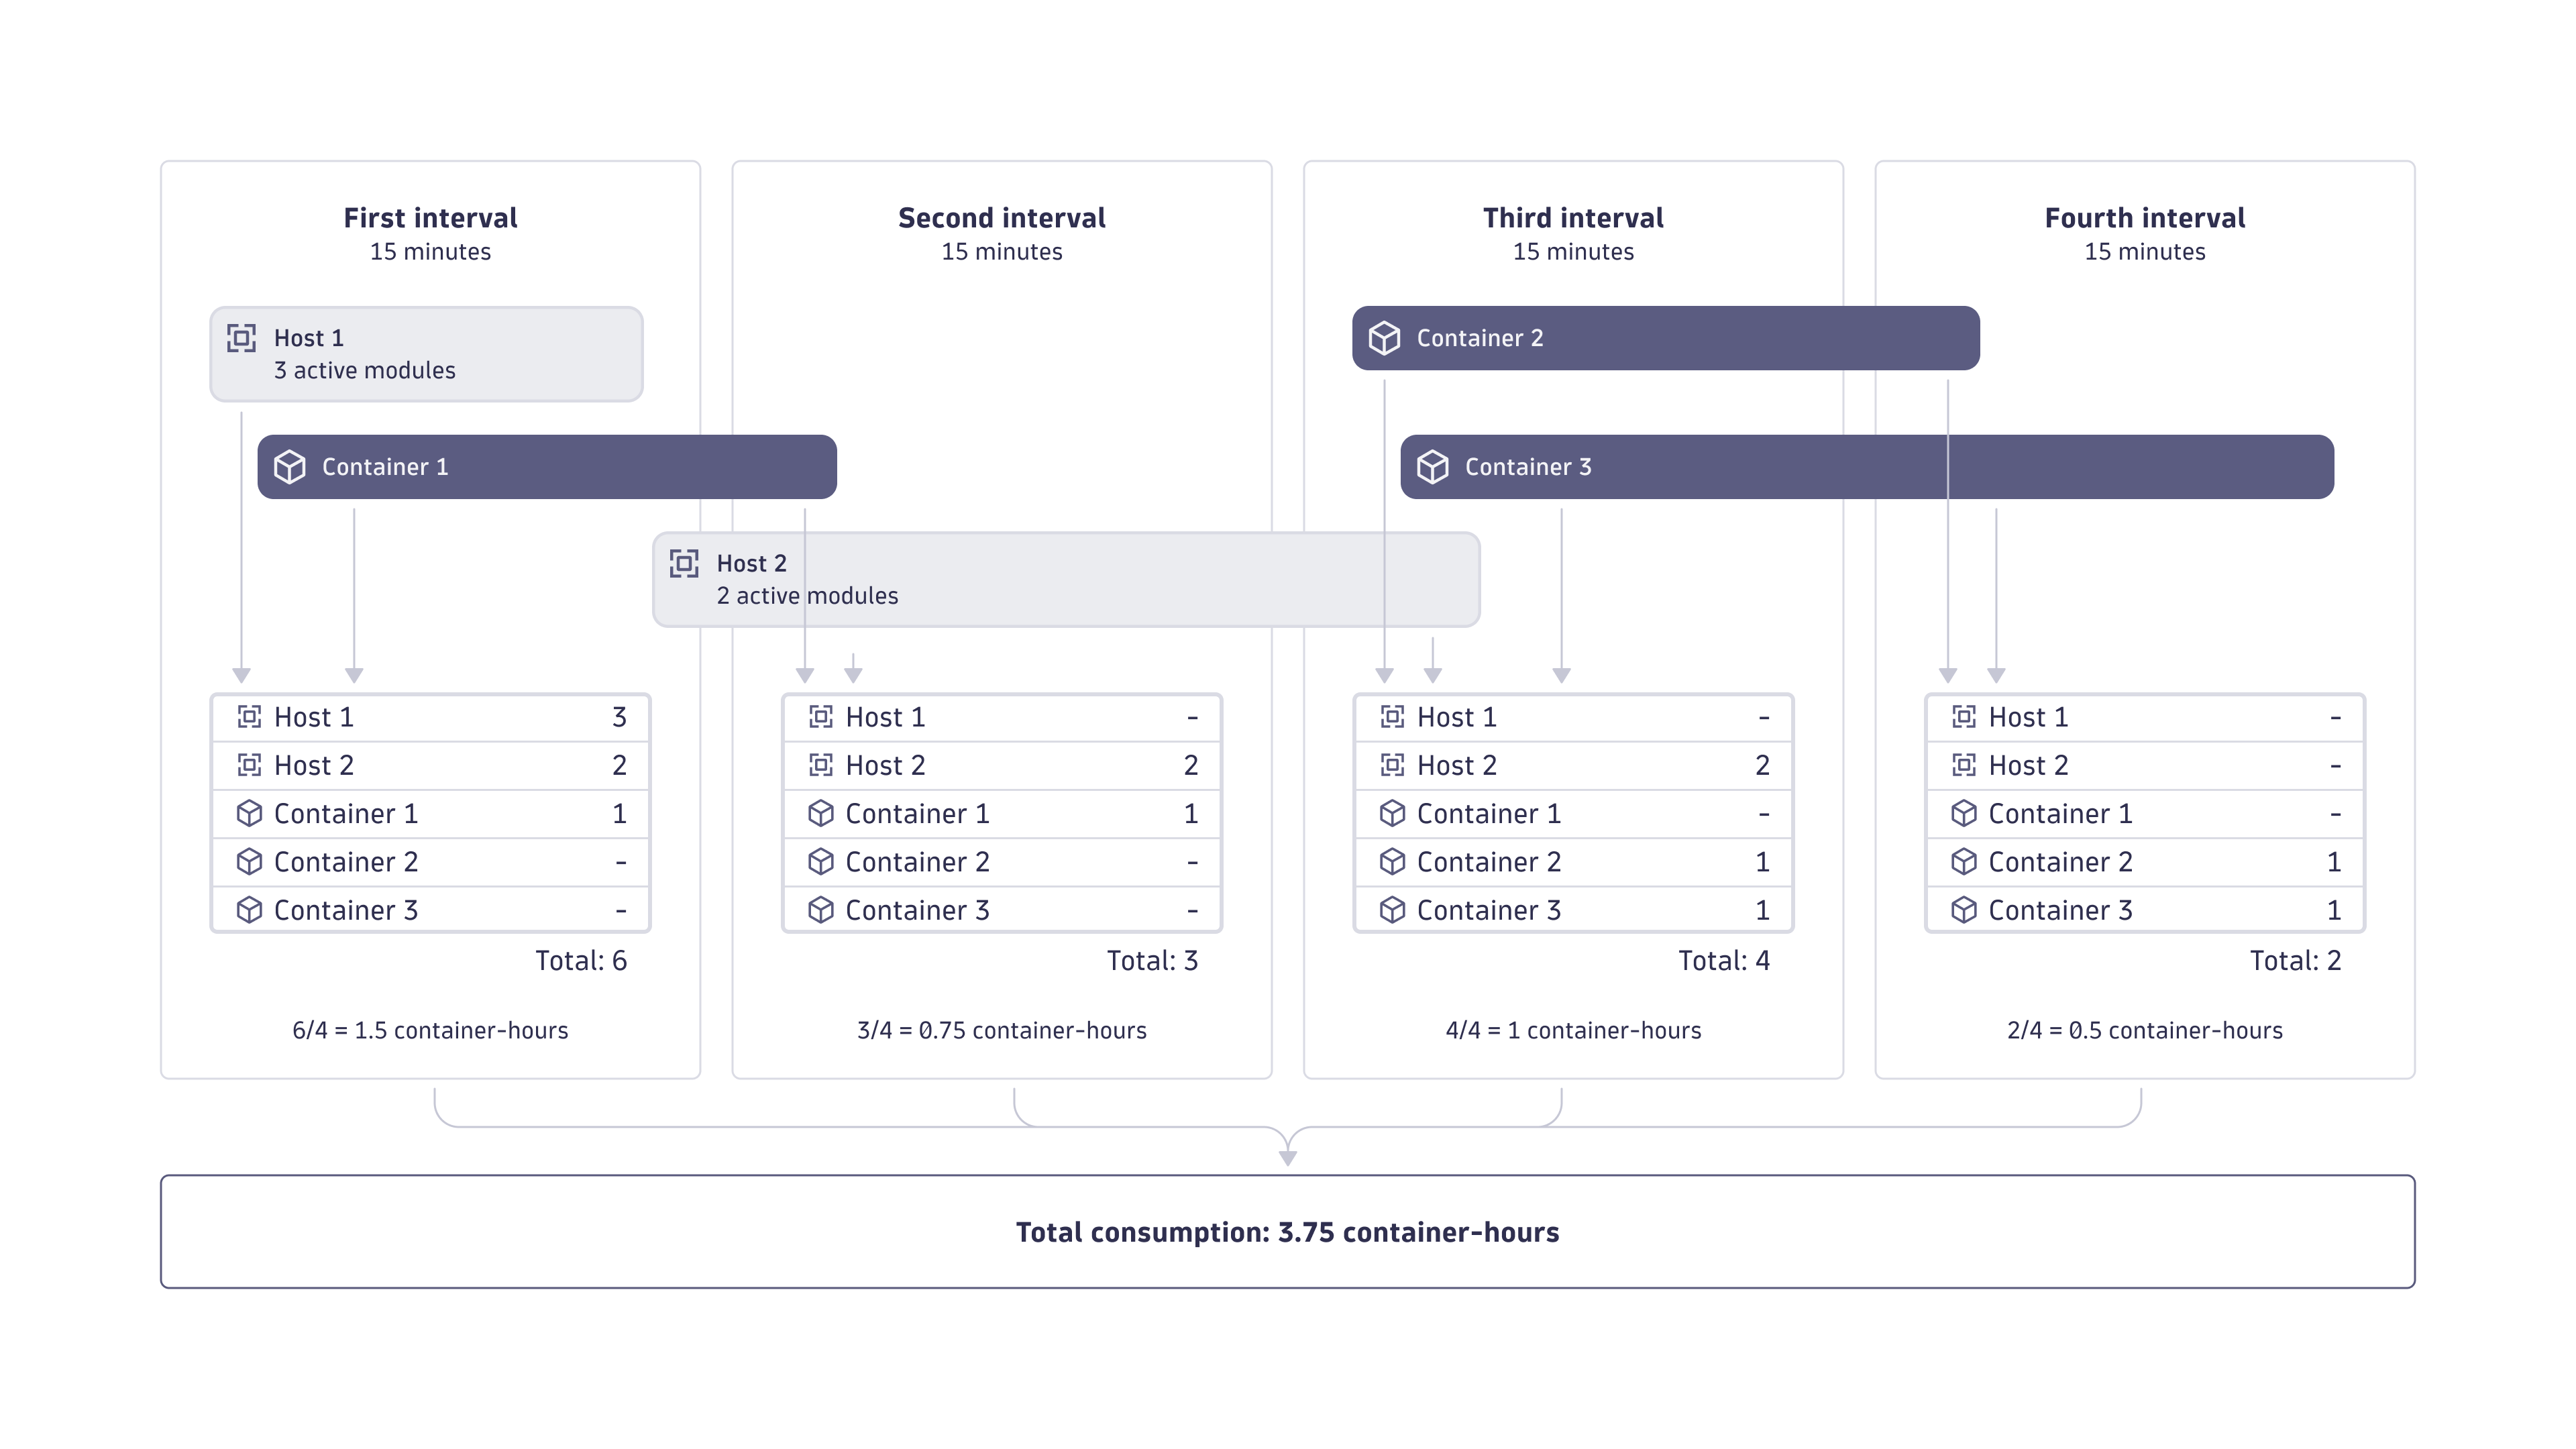
Dynatrace is built for elastic cloud-native environments where services are often short-lived, which is the case for containerized and ephemeral workloads. Therefore, billing granularity for container-hour consumption is calculated in 15-minute intervals. One 15-minute interval is equivalent to 0.25 container-hours. If a process is monitored for fewer than 15 minutes in a given interval, its consumption is rounded up to 15 minutes.
The figure below illustrates how container-hour consumption is calculated over the course of an entire hour (four 15-minute intervals).
Estimate your cost
The following example demonstrates how to calculate your monthly cost for Code Monitoring.
-
Calculations are based on the following list prices (which may differ from your rate card prices):
- Code Monitoring: $0.005 per container-hour.
- All costs are in USD.
-
One month is equivalent to 30 days, 24 hours per day.
-
250 concurrent processes are under code-level monitoring:
-
200 containerized processes running continuously, 24 hours per day.
-
50 non-containerized concurrent processes running across hosts, 24 hours per day.
-
- 250 concurrent processes × 24 hours × 30 days = 180,000 container-hours per month
- 180,000 container-hours per month × $0.005 = $900 per month
Understand and manage your consumption
Dynatrace provides several ways to monitor and analyze your Code Monitoring consumption.
Insights via Account Management
License managers can view usage and costs in Account Management.
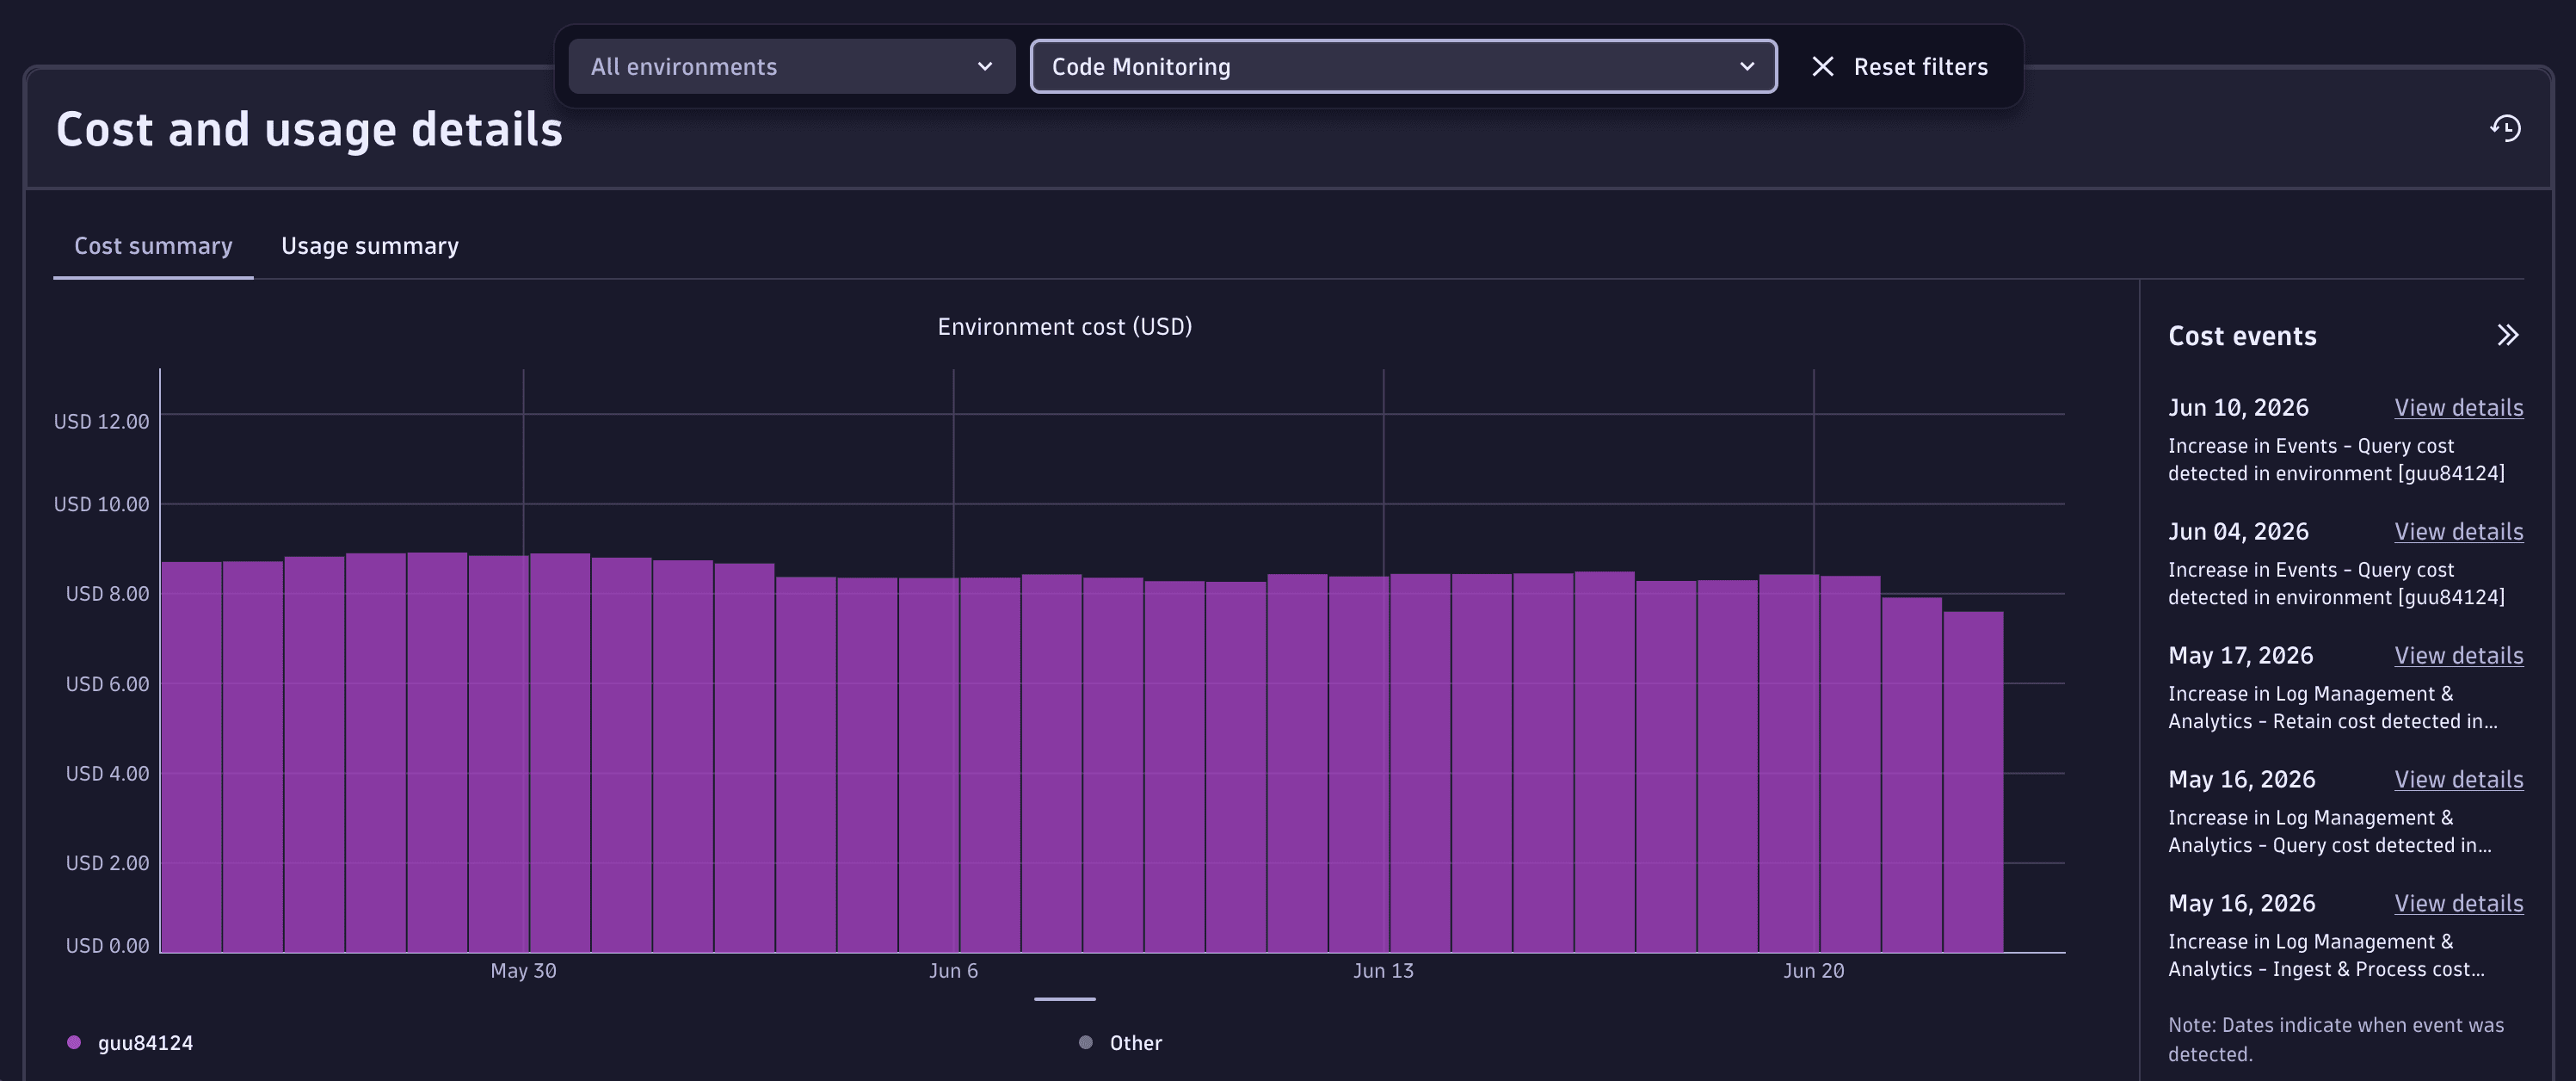
- Go to Account Management > Subscription > Overview > Cost and usage details > Usage summary.
- Select Code Monitoring > View details.
- From this screen, you can also drill down into usage detail at the capability and environment level.
- Capability level: Select View Details next to the capability you want to explore.
- Environment level: In the Environments table, select … > Open details with Notebooks.
For more information, see Overview (Dynatrace Platform Subscription).
Insights via billing usage events
Billing usage events (billing_usage_event) are system events emitted by Dynatrace that represent the authoritative record of billable usage. Use them to build reliable cost dashboards and chargeback reports by host, Kubernetes namespace, cloud account, or cost-center tag.
Each billing usage event for Code Monitoring contains:
- The DPS capability consumed (Code Monitoring).
- The usage amount in container-hours that contributes to billing.
- The time window the usage belongs to.
- The entity context (host, plus Kubernetes namespace/cluster or cloud account identifiers where applicable).
Query billing usage events with DQL
-
Total Code Monitoring usage over time:
fetch dt.system.events| filter event.kind == "BILLING_USAGE_EVENT" and event.type == "Code Monitoring"| dedup event.id| fieldsAdd day = formatTimestamp(bin(timestamp, 24h), format: "yyyy-MM-dd")| summarize totalUsage = sum(billed_container_hours), by: {day}| sort day desc
Insights via API
Query Code Monitoring consumption programmatically via the Account Management API for integration with external reporting systems. You can also query the underlying metrics through the Environment API – Metrics API v2.
FAQs
Is it possible to monitor only some processes on a host?
Yes. You can opt in to Code Monitoring at the level of specific process groups, Kubernetes namespaces, clusters, or the entire environment. You are billed only for the processes that you have opted-in to for code-level monitoring.
Can I combine Code Monitoring with other rate card item?
Yes. Code Monitoring can be combined with any other rate card item. The most common pairings are with:
What Dynatrace components are needed for Code Monitoring?
Code Monitoring is only available for DPS customers with a SaaS environment. It requires OneAgent version 1.309+ with the Java Live-Debugger and/or Node.js Live-Debugger OneAgent features enabled. The OneAgent must be deployed in Full-Stack, Infrastructure, or Discovery monitoring mode (with container code-module injection).
How is container-hour consumption affected by container size?
Consumption is not affected by container size. A container-hour is independent of the container's memory size, CPU requests, or resource limits. Each monitored concurrent process contributes one container-hour per hour, regardless of how large or small it is.
How are non-containerized workloads counted?
Each concurrent process running on a host is treated as a unique container for the purpose of container-hour consumption calculations. A host with multiple instrumented processes consumes the total container-hours of all those processes combined.
Is Live Debugger included in Code Monitoring?
Yes. Live Debugger is included in the Code Monitoring capability at no additional charge beyond the container-hours consumed. This includes plugins for Visual Studio Code and JetBrains IDEs.
Are container-hours consumed when a process is idle?
Yes. Container-hours are consumed as long as the instrumented process is running and being monitored at code level, regardless of whether the process is actively serving traffic. To reduce consumption, terminate or scale down processes you do not need monitored, or disable Observability for Developers for the relevant process groups.
How do I attribute Code Monitoring costs to specific teams or applications?
Billing usage events for Code Monitoring are dimensioned by host and, where applicable, by Kubernetes cluster/namespace or cloud account identifiers (AWS account, Azure subscription, GCP project). You can also assign usage to a team or product by setting the dt.cost.costcenter and dt.cost.product fields on host entities, and use Account Management to set up chargeback rules. For more information, see Cost Allocation.
What happens if my Code Monitoring usage exceeds the fair-use quota?
Dynatrace currently does not charge for usage in excess of the amount allowed under your fair-use quota. However, if your usage consistently or significantly exceeds the fair-use quota, contact your account team to discuss your requirements.
What if I need snapshot retention beyond the included 10-day retention period?
A container-hour includes 10 days of snapshot retention. If your use case requires retention beyond this period, contact your account team to discuss your requirements and available options.