Anomaly Detection app
- Latest Dynatrace
- App
- 3-min read
 Anomaly Detection provides you with a unified overview of all anomaly detection configurations in your Dynatrace environment.
Prerequisites
Permissions
The following table describes the required permissions.
User permissions can only be changed by your Dynatrace administrator in Account Management > Identity and Access Management. To learn more about user groups and assigning permissions, see Working with policies.
Installation
Make sure the app is installed in your environment.
Starting with Dynatrace 1.333+, authorization settings for Anomaly Detection are no longer required. Analyzers are now part of the standard configuration and no longer need additional authorization in the app.
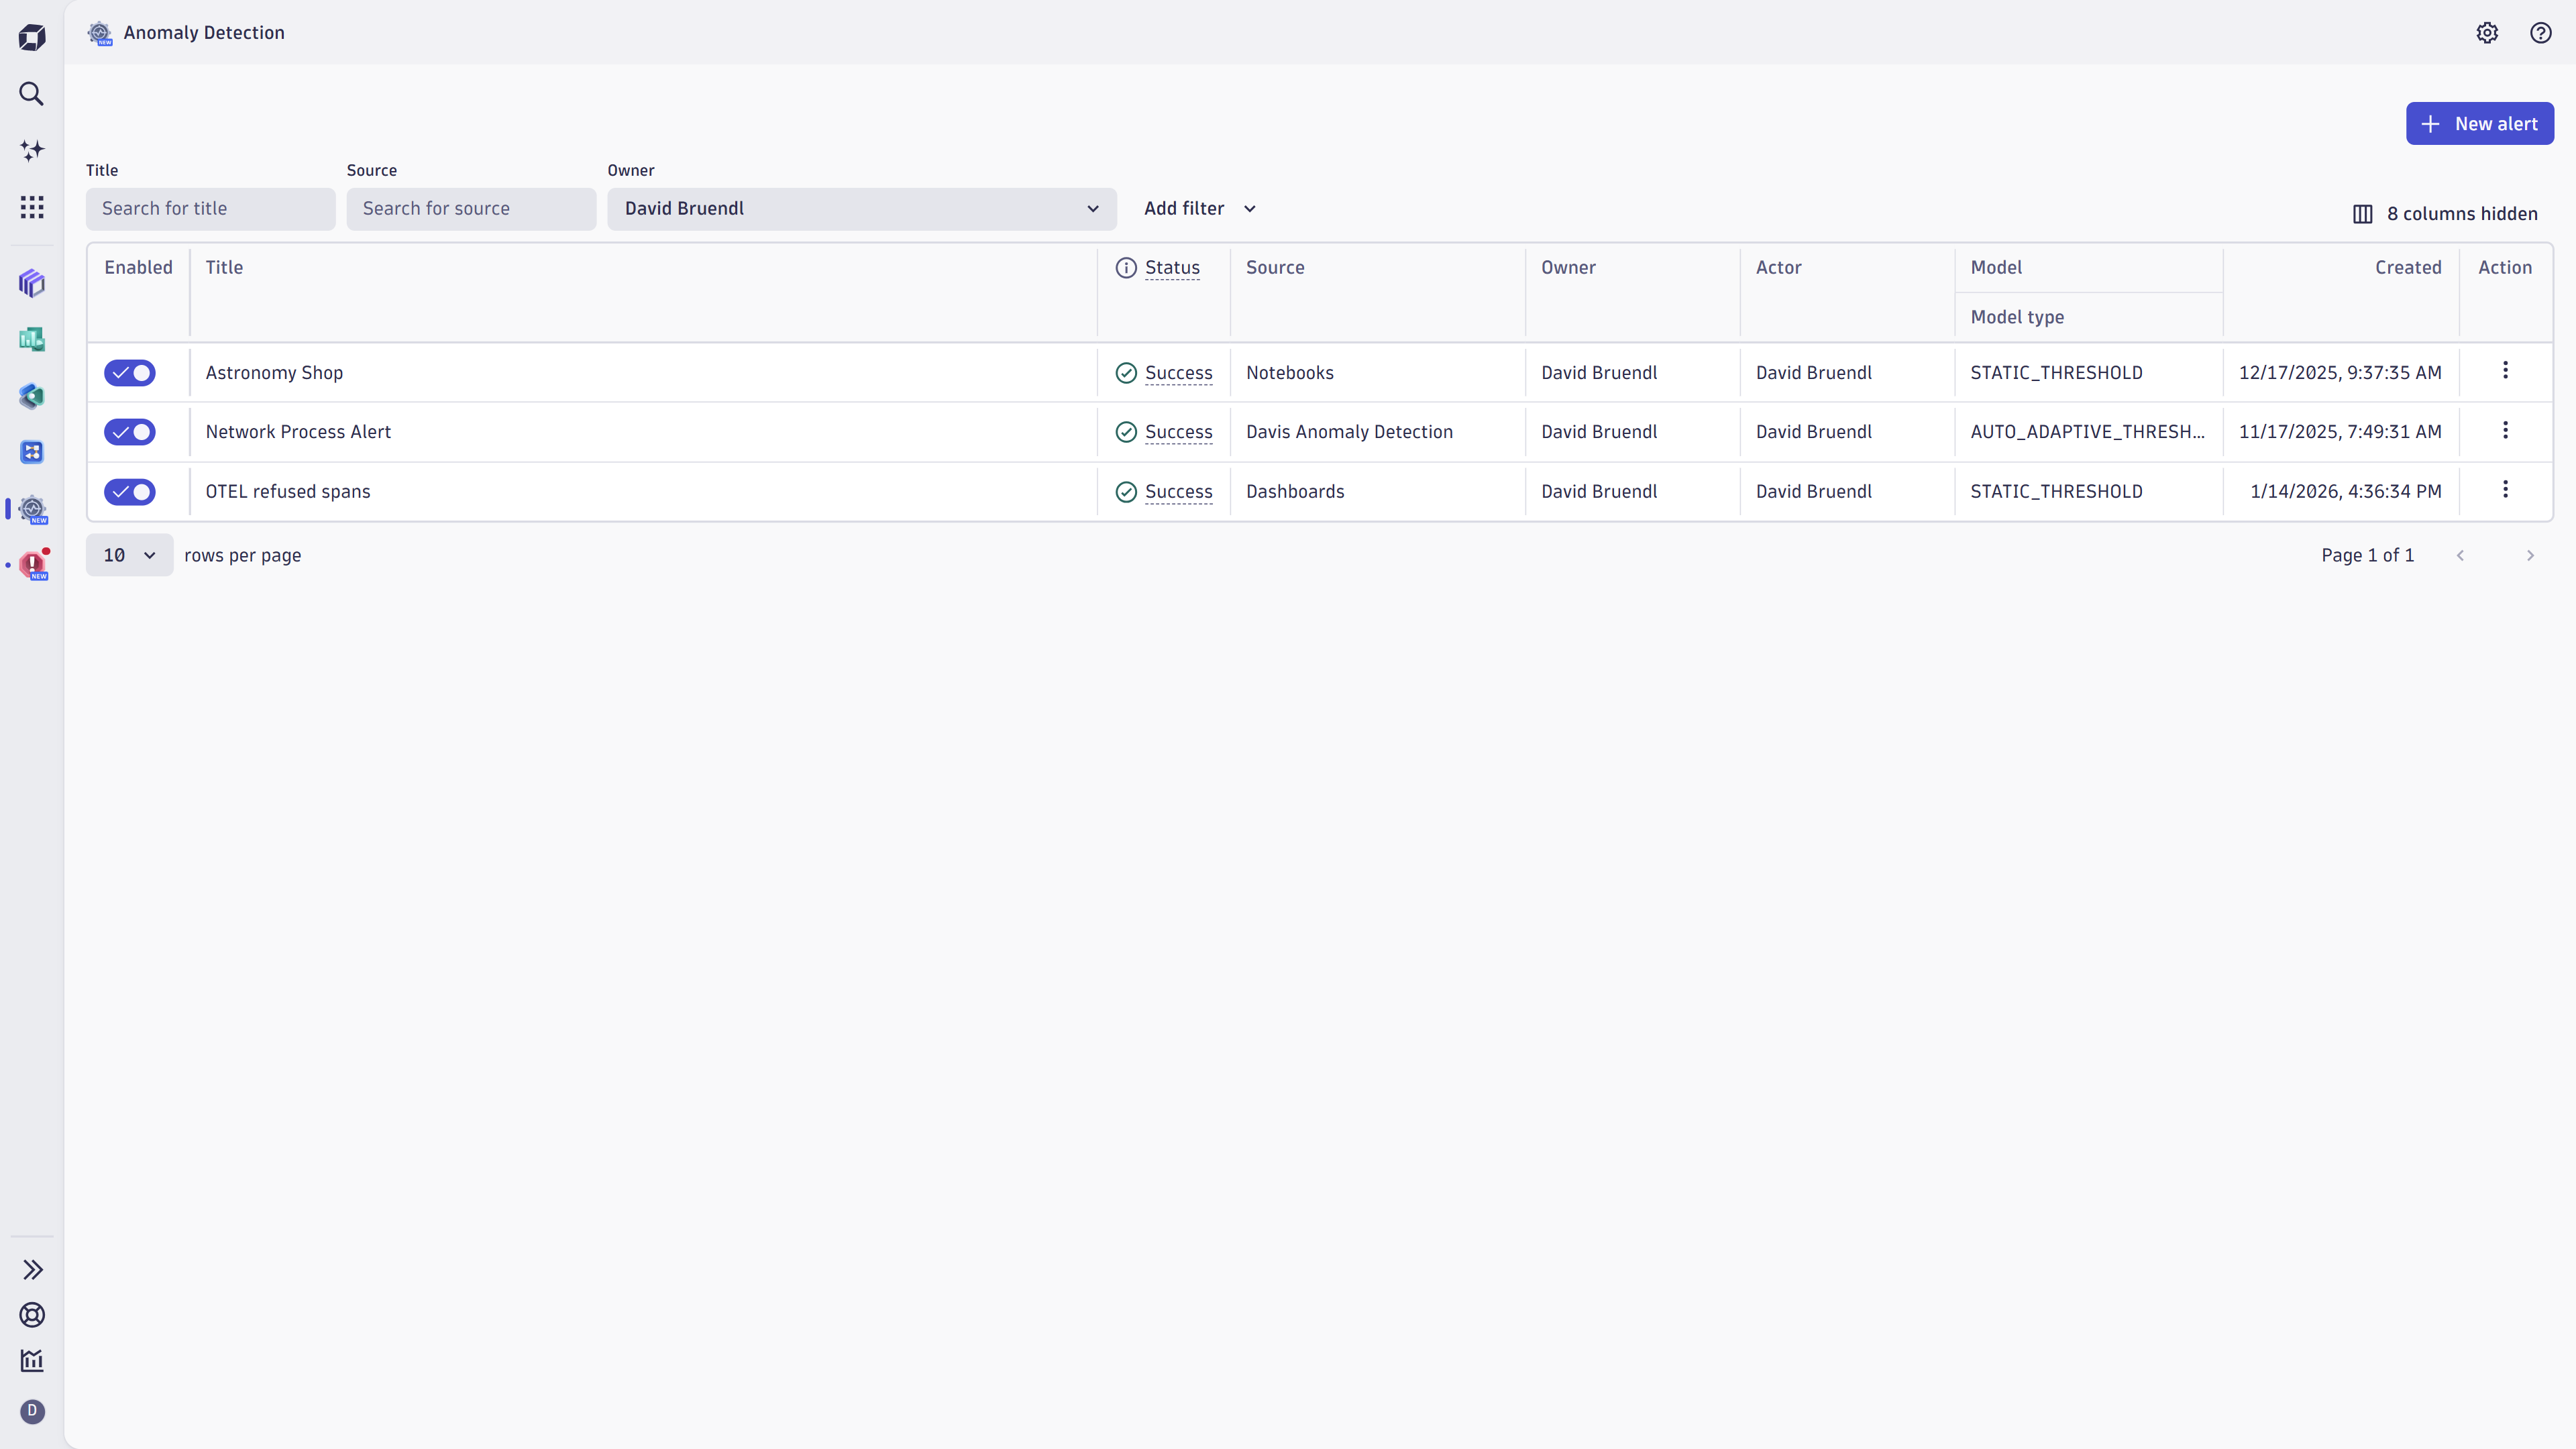
When you open the app, you can see the information about your existing anomaly detection configurations, such as:
- Status—If there's an error, the status is displayed as Error, select it to open the detailed report in a notebook.
- Source
- Type of anomaly prediction model
To show or hide columns, select Column settings and then select the columns you want to display. You can also filter the table by any of these parameters.
Learning modules
Go through the following processes to learn how to use Anomaly Detection:
- How-to guide
- Best practices for creating Anomaly Detection custom alert DQL queries.
- How-to guide
- Best practices for optimizing Anomaly Detection DQL queries.
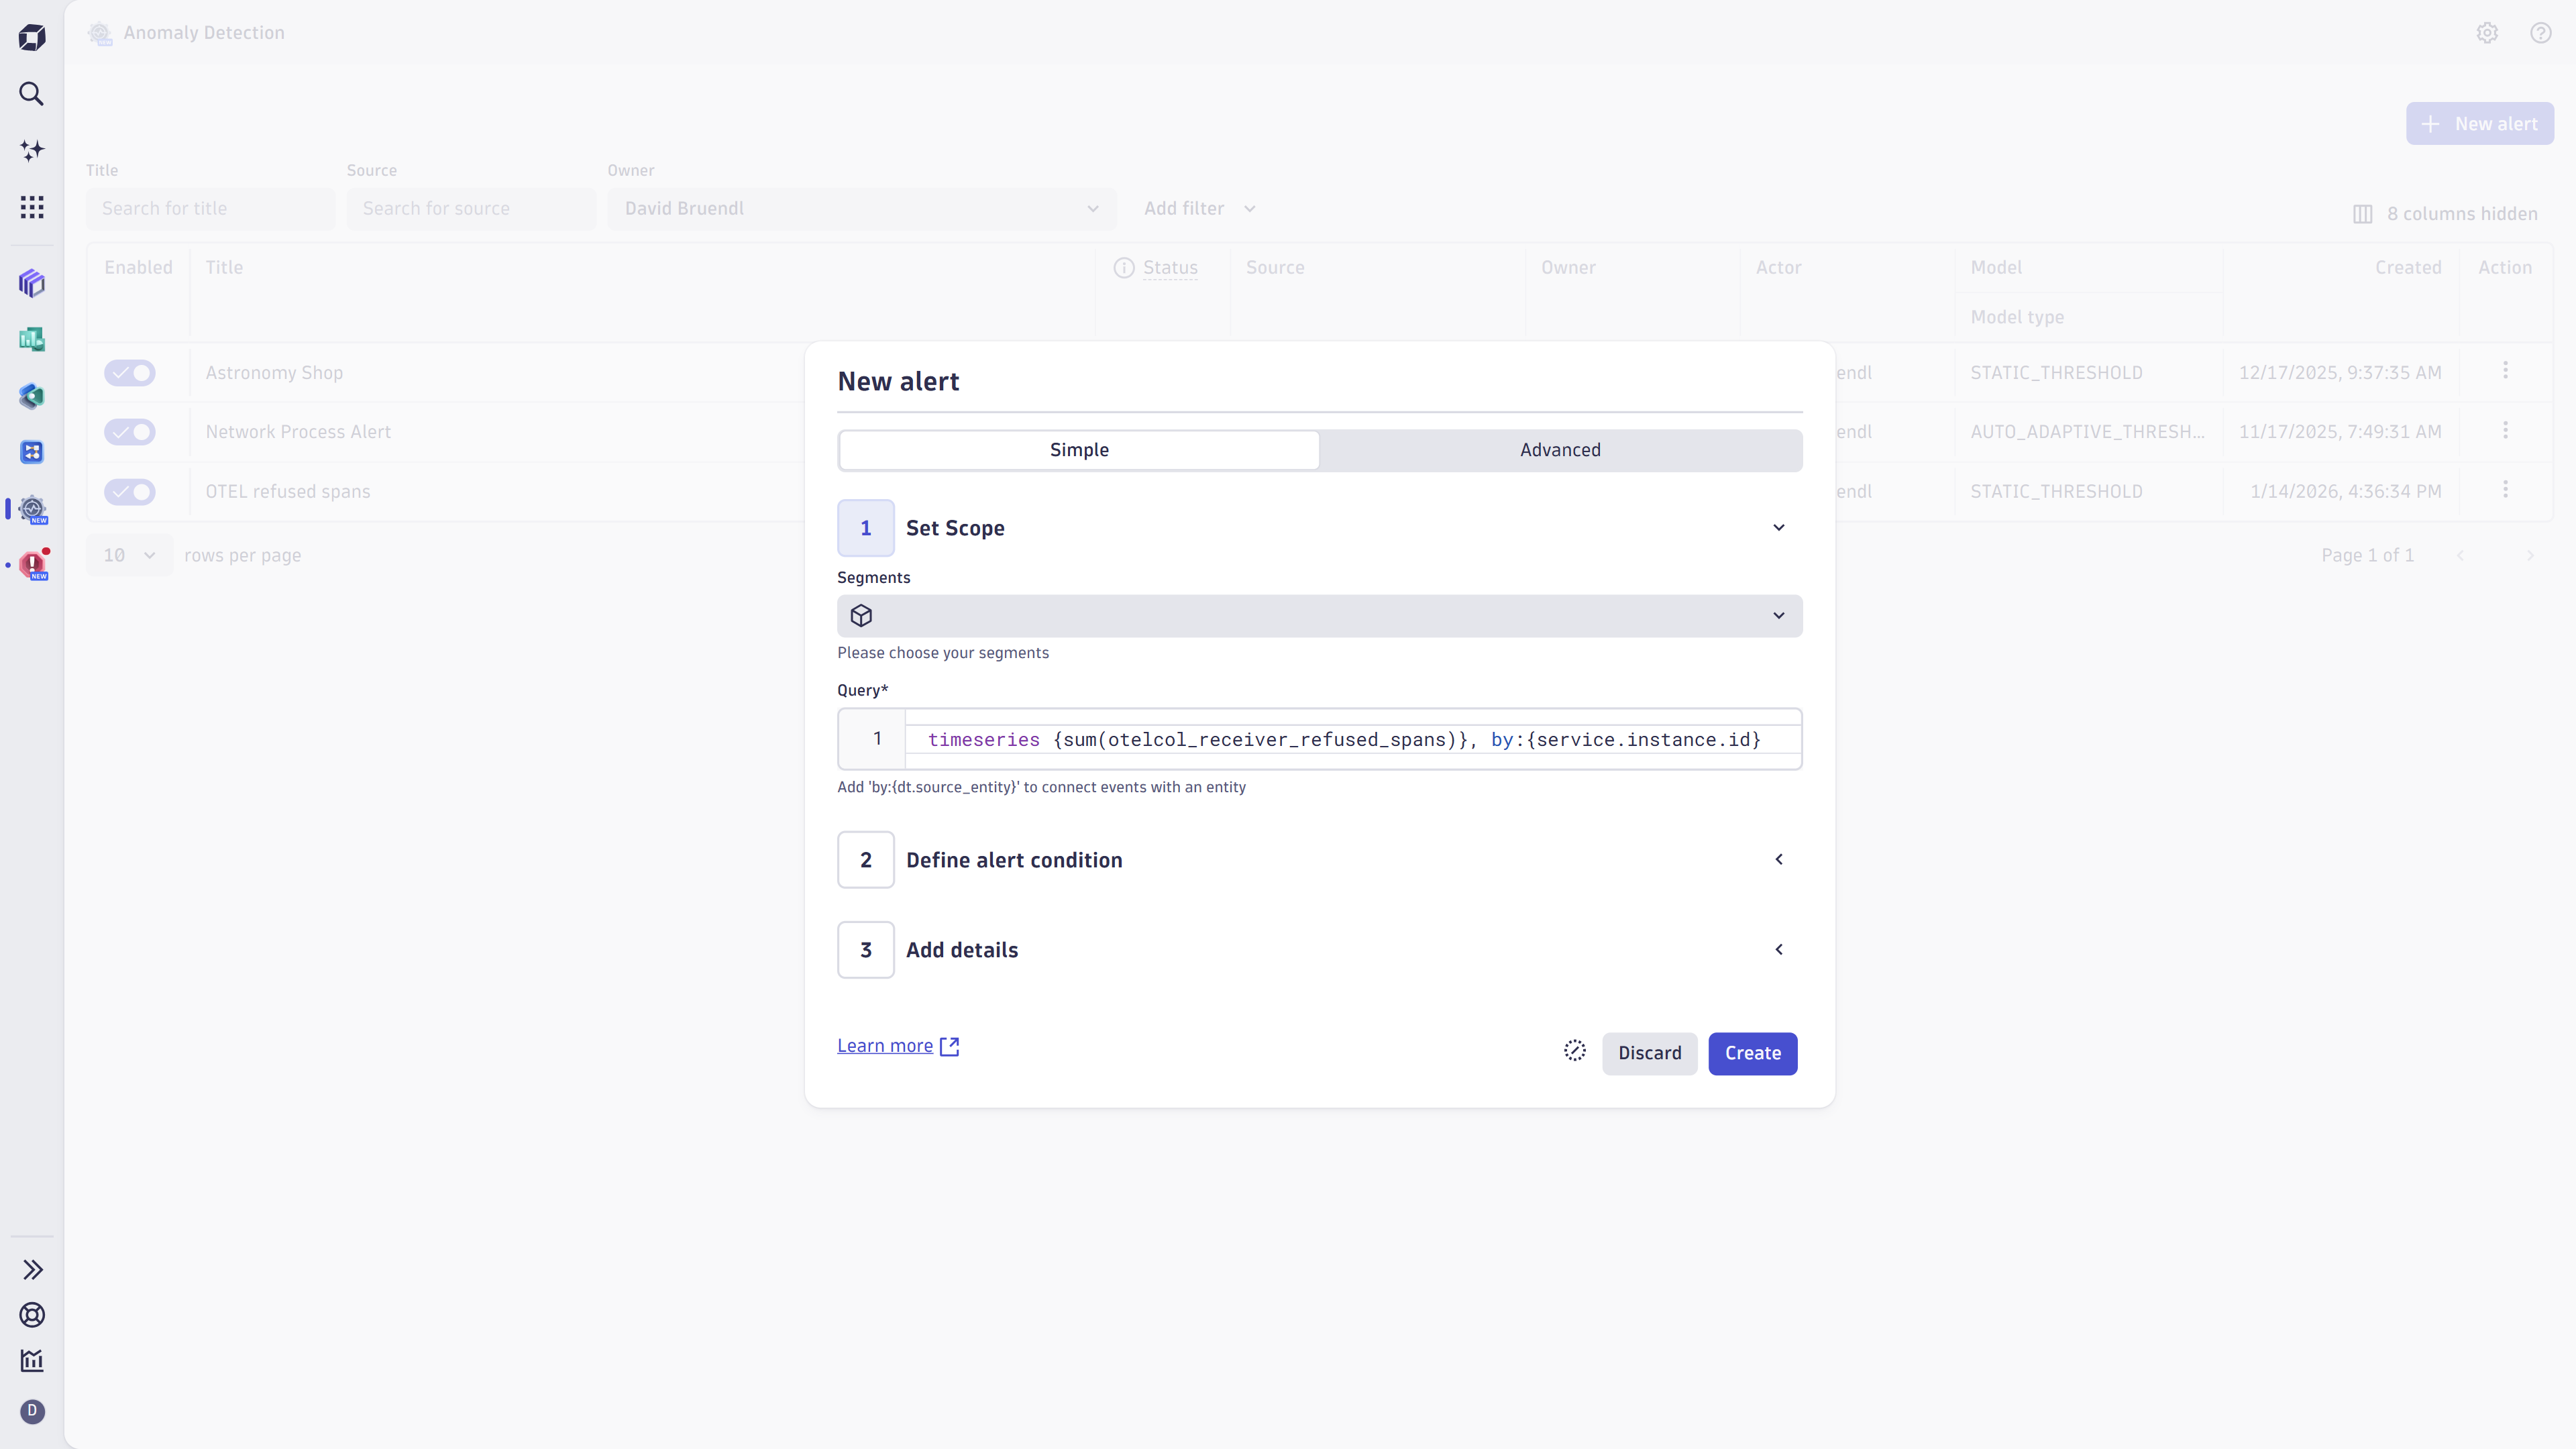
- How-to guide
- Learn how to create and edit simple custom alerts in the Anomaly Detection app.
- How-to guide
- Learn how to create and edit advanced custom alerts in the Anomaly Detection app
- Explanation
- Understand the health status types in Anomaly Detection and what they mean and learn about safety mechanism for failing quesries.
 Anomaly Detection