Add dynamic filters to a Dynatrace dashboard
- How-to guide
- 8-min read
The dashboards discussed here are classic dashboards created using the dashboarding functionality integrated with previous Dynatrace.
- For more about classic dashboards, see Dashboards Classic.
- For more about dashboards created with the Dashboards app in the latest Dynatrace, see Dashboards.
- To improve your dashboard experience, you can upgrade existing dashboards from Dashboards Classic to the Dashboards app in the latest Dynatrace.
You can add multiple dynamic filters to a dashboard. They are all displayed as filter options when you select in the dashboard filter bar.
What is a dynamic dashboard filter?
Suppose you have a very simple dashboard with just Host health and CPU usage for all hosts in your environment.
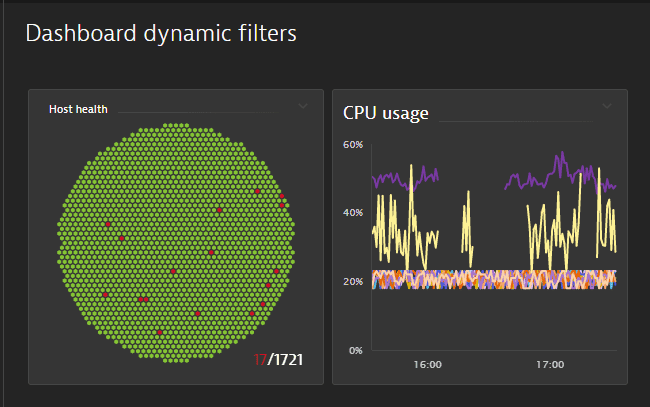
If you add a dynamic filter for operating system:
-
A filter bar is added to the dashboard.

-
You are still able to display the unfiltered dashboard as above, with all hosts displayed regardless of the operating system, but you now have the option to filter the dashboard by operating system.
-
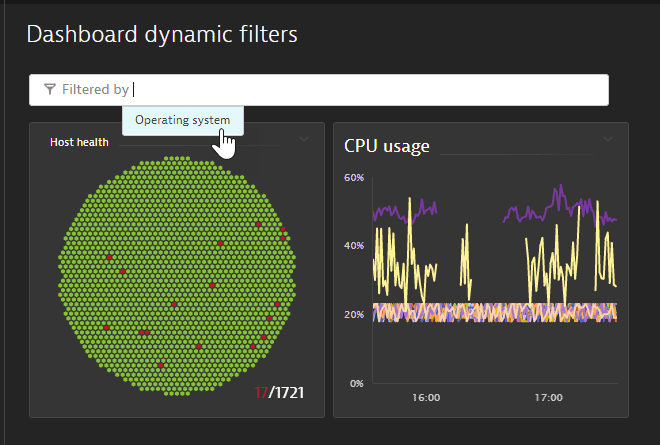
Select the filter name. In this case, there is only one filter available to select because that's all we added in this example.
-
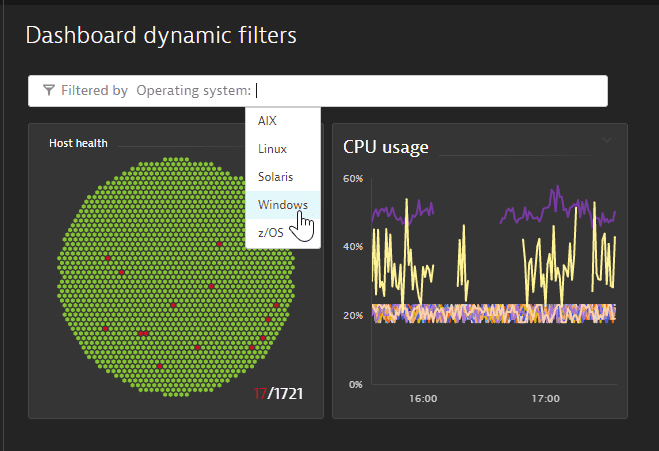
Select a filter value. In this case, there are five operating systems from which to choose.
-
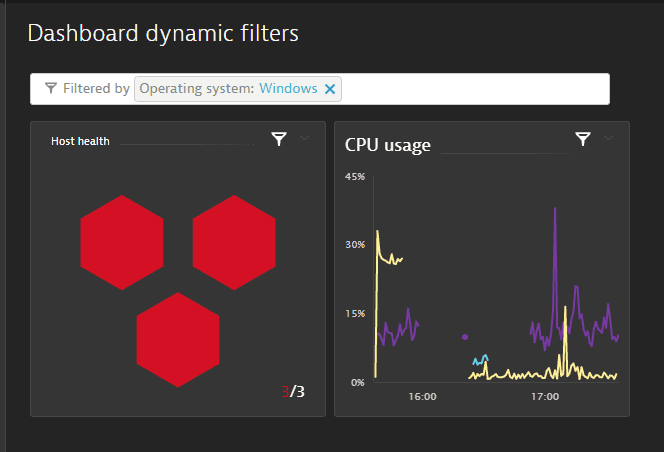
When you view the dashboard now, both tiles are filtered by the selected operating system. In this example, our 1721 hosts have been filtered down to just the three hosts in our environment that matched the filter.
-
Read below to learn how to add such filters to your own dashboards.
Limitations
If a metric has multiple entity types, management-zone filtering isn't applied. This limitation impacts metrics with the dimensions dt.entity.monitored_entity or dt.entity.device_application. For details, see Filter classic metrics by management zone.
Dynamic filters tab
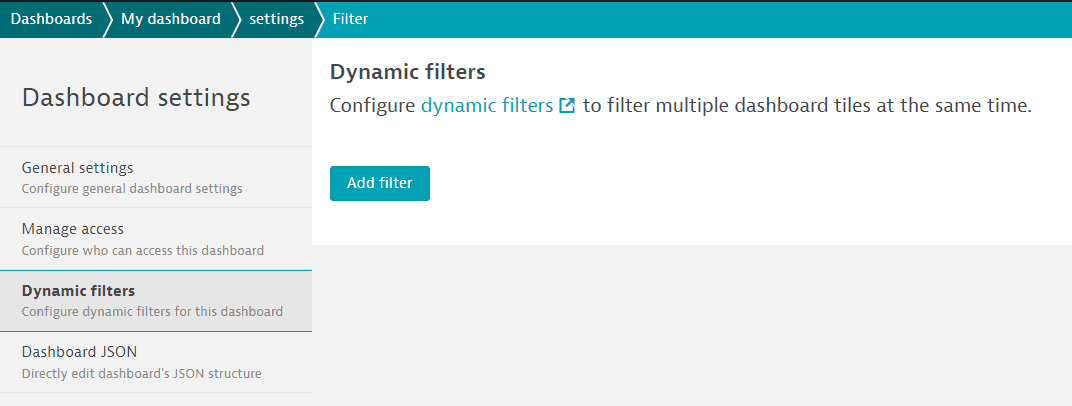
The Dynamic filters tab of the Dashboard settings page is where you define and manage filters for a dashboard.
You can get there from the Dashboards table or the currently displayed dashboard.
From the Dashboards table
- Go to
 Dashboards Classic.
 - In the Dashboards table, find the dashboard you want to edit.
- Select More (…) > Configure to open Dashboard settings for that dashboard.
If you don't see a Configure entry in the menu, you don't have edit rights for the selected dashboard. - Select the Dynamic filters tab.
From a dashboard
-
If you are already on the dashboard that you want to edit, and you have not added any filters to the dashboard, the following notice is displayed:
"No dynamic filters have been defined for this dashboard. Add dynamic filters or learn more."Select the Add dynamic filters link to go directly to Dynamic filters.
-
If you have already added filters to the dashboard, there is no such notice.
-
Select Edit in the upper-right corner of the dashboard.
If you don't see an Edit button, you don't have edit rights for the selected dashboard. -
Select the Settings tab.
-
Select Configure more.
-
Select Dynamic filters.
-
Add or edit dynamic filters
-
On the Dynamic filters tab, select Add filter.
-
Select a filter from the Filter criteria list.
Some filters require additional input. When you make a selection in the Filter criteria list, an additional entry field is displayed.
For details, see Example 2: filter by application tag key and Example 3: filter by custom dimension.
-
Select Save changes.
-
Repeat the above steps for each filter you want to add to the dashboard.
-
Display the dashboard.
A filter bar is displayed under the dashboard name. -
In the filter bar, select a filter and a value.
The dashboard is filtered by your selection.
Filter evaluation
-
A filter can only be used with those dimensions that exist on the metric.
-
Individual filters on a dashboard are AND-conjuncted.
Tag filters and custom dimension filters for the same dimension key/entity are OR-conjuncted.
If there are multiple filters (either predefined or for another custom dimension), these are AND-conjuncted.
-
Custom dimension filters and generic tag filters apply only to tiles that you create in Data Explorer and pin to the dashboard.
They do not apply to standard tiles that you drag to the dashboard from the Tiles pane in the dashboard editor, or that you pin to the dashboard from another page such as Hosts.
-
Remember:
- An explicit filter is defined in a Data Explorer query and applies to any tile created from that query. It applies only to series related to the selected dimension in that tile.
- A custom dimension dynamic filter also applies to all series that don’t have the selected dimension in a tile.
Example 1: filter by operating system
-
Go to the Dynamic filters tab for the dashboard you want to edit.
-
Select Add filter.
-
Select
OS typefrom the Filter criteria list. -
Select Save changes.
-
Display the dashboard. The Host health tile displays the host health for all hosts in the environment, regardless of operating system.

-
In the filter bar, select Operating system, and then select an operating system. The dashboard is now filtered by the selected operating system. If you selected
Windows, the Host health tile now displays the host health only for the Windows hosts in the environment.
-
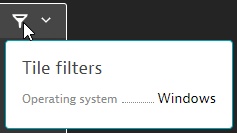
To check which filters are applied to a tile, hover over the filter icon in the upper-right corner of the tile. In this case, "Operating system: Windows" is displayed in a tooltip.
You can add multiple filters to a dashboard. They are all displayed as filter options in the dashboard filter bar.
Example 2: filter by application tag key
To filter a dashboard by tags, you first need to tag the components (applications, hosts, services, process groups, or process group instances) in your environment to which your dashboard applies. In this example, we filter our dashboard by tags applied to applications.
To filter a dashboard by application tags
- Apply tags (key/value pairs) to applications
For each application to which your dashboard applies, tag the application with key/value pairs that can be filtered on. - Create a filtered dashboard
Create a dashboard with application-relevant content—for simplicity, we have added a single Application health tile—and add an optional Application tag filter for the keys with which you tagged your applications. - Display the filtered dashboard
Display the dashboard and set the filter. This focuses the dashboard on the applications that are tagged with matching key/value pairs.
Apply tags (key/value pairs) to applications
- Go to Settings and select Tags > Manually applied tags.
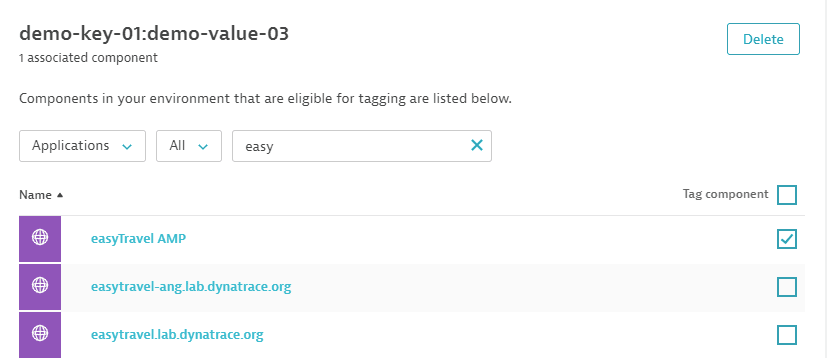
- Enter key/value pairs and apply them to applications. In this example, we applied the following:
apply demo-key-01/demo-value-01
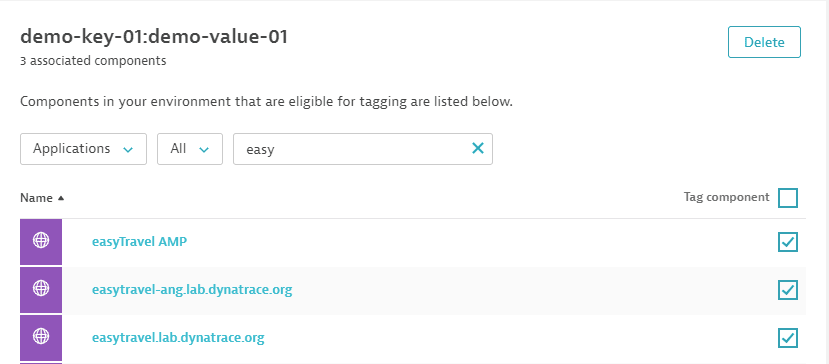
apply demo-key-01/demo-value-02
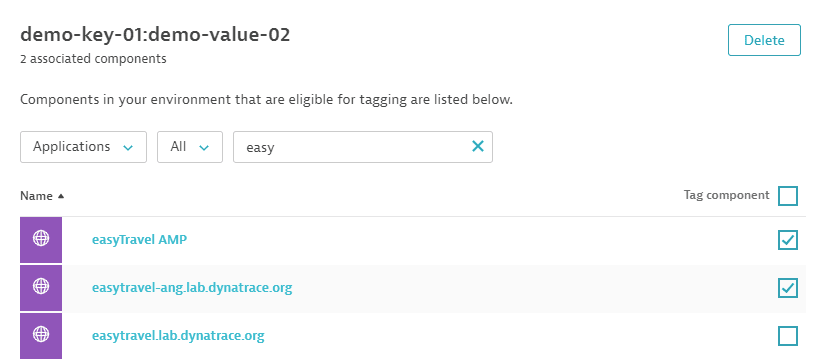
apply demo-key-01/demo-value-03
Create a filtered dashboard
-
Go to
 Dashboards Classic.
 -
Select Create dashboard, enter a dashboard name, and select Create to create a new dashboard.
-
Drag an Application health tile to the dashboard.
-
Select the Settings tab and then select Configure more.
-
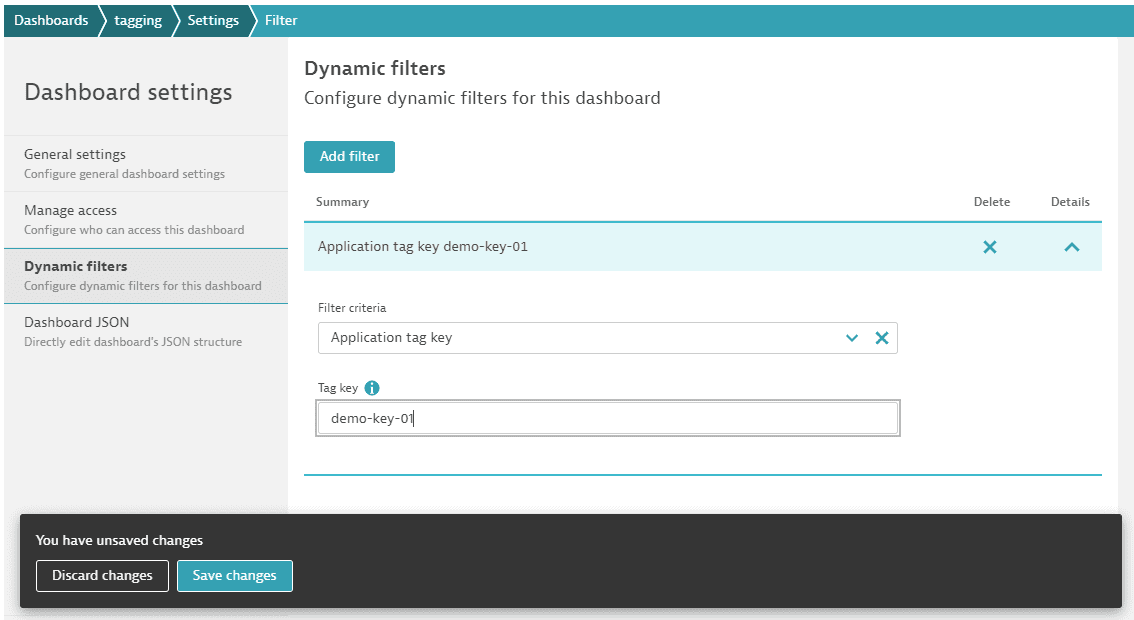
On the Dynamic filters tab:
- Select Add filter.
- From the Filter criteria list, select
Application tag key. - In Tag key, enter
demo-key-01, which is the key we used to tag some applications earlier.
-
Select Save changes.
Display the filtered dashboard
-
Display the dashboard.
With no filter set, the Application health tile displays the health of all applications monitored in your environment. -
Select in the filter bar under the dashboard name to see the available filters for this dashboard. In our example, we have added just one:
Application tag. Select it.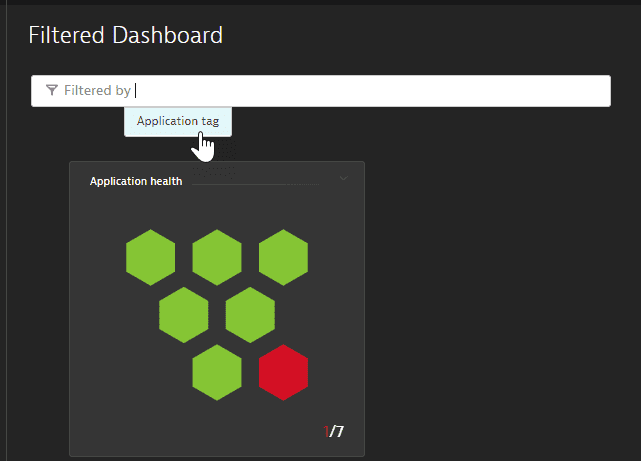
-
In our example, we have added just one application tag key:
demo-key-01. Select it.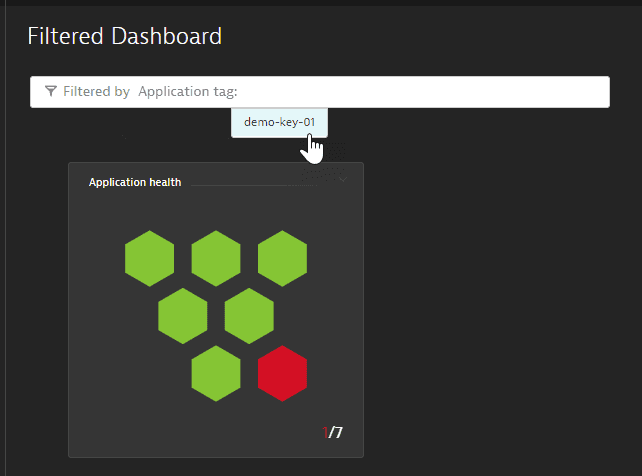
-
In our example, we have added three different values for the key:
demo-value-01,demo-value-02,demo-value-03. Select one of them.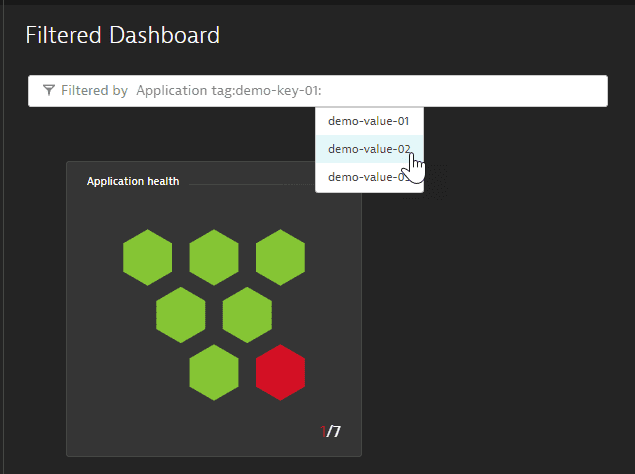
-
Now the dashboard displays the health of all applications that have the selected key/value pair. You can add other pairs to the filter. For example, you could display the health of all applications that have the key/value pair
demo-key-01/demo-value-01ordemo-key-01/demo-value-02(or both). -
If you drill down from the tile, the Applications page is displayed with the currently selected filter applied.

Example 3: filter by custom dimension
Custom dimension filters apply only to tiles that you create in Data Explorer and pin to the dashboard. They do not apply to standard tiles that you drag to the dashboard from the Tiles pane in the dashboard editor, or that you pin to the dashboard from another page such as Hosts.
To filter tiles by a custom dimension
- Go to the Dynamic filters tab for the dashboard that you want to filter by a custom dimension.
- Select Add filter.
- In the Filter criteria list, select
Custom dimension.
The Dimension key list is now displayed. - Select or type a value for Dimension key.
- Save your changes.
Remember:
- An explicit filter is defined in a Data Explorer query and applies to any tile created from that query. It applies only to series related to the selected dimension in that tile.
- A custom dimension dynamic filter also applies to all series that don’t have the selected dimension in a tile.