Manage results
- Latest Dynatrace
- How-to guide
In the following, you'll learn how to manage results on the  Vulnerabilities pages. You can
Filter vulnerabilities
See below how you can filter vulnerabilities and affected entities.
Timeframe filter
With the timeframe, you can define the period from which your data is being queried. If you don't specify the timeframe, the default Last 30 minutes is applied, meaning that the data being fetched is from the last 30 minutes.
When setting the timeframe, the end value must always be Now.
- On the Prioritization page, go to the timeframe section.
- Select one of the preset options or select the calendar for customization.
- Select Apply.
Segment selector
Segments provide quick access to predefined logical filters. The segment selector allows you to filter results based on these predefined logical filters. You can apply segments to any page in Vulnerabilities.
See below for instructions.
1. Define segments
If you already have segments defined, you can skip this step.
Open the Segments  app and create segments for your environment. For more information, see Include data in Dynatrace segments.
Make sure to use filter segments that are compatible with entity state events. For examples of such filters, see Examples of how to create segments.
2. Enable the segments filter
- On the Prioritization page, open the Settings menu in the upper-right corner.
- Enable Filter segments support. This adds the segment selector to all pages in Vulnerabilities.
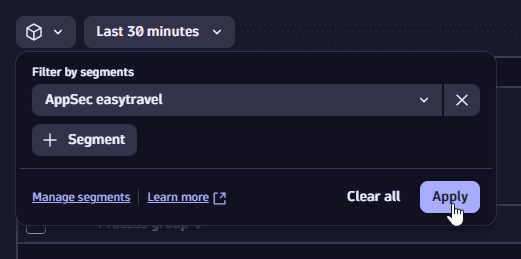
3. Filter by segments
- Open the segment selector .
- In Filter by segments, select a segment.
- Optional To add more segments, select Segments; if available, you can select a value for the selected segment.
- When you're happy with the selection, select Apply.
Selecting one or multiple segments results in
- Fewer vulnerabilities and affected entities
- Scoping the vulnerabilities' Dynatrace Security Score based on your selection
For example,
- Before selecting a segment: There are 15 vulnerabilities with a
9.4Dynatrace Security Score on the Prioritization page. - After selecting a segment: There are five vulnerabilities with a
8.0Dynatrace Security Score, because the DSS has been scoped to include less entities and the maximum DSS score of affected entities is8.0.
For more information on segments and how they work, see
Examples of how to create segments
You can create segments based on applications, services, hosts, and other relevant components monitored by Dynatrace. Here are some examples.
-
Create a new segment.
-
Create a new variable and add the following query to it.
fetch dt.entity.application| fields application = entity.name -
Add a new event-based segment and add the following filter to it.
related_entities.applications.names = $application
Filter expressions
In the filter field, you can use complex filter expressions to select which information is to be displayed:
-
Go to the Prioritization page or the overview page of affected process groups or Kubernetes nodes.
-
In the filter field, make your selection. You have the following options:
- Add multiple filters on the same filter key
- Use
ANDandORoperators - Use the wildcard (
*) to search for patterns - Filter numbers with
>and<
To reset the filters to the default mode, select  on the right of the filter field.
If the selected filter doesn't show in the table, go to the column settings  and make sure to add the corresponding column to the table.
Filter by CVSS vectors
While the Dynatrace Security Score (DSS) is a key method for prioritizing vulnerabilities, filtering by CVSS Base Vector and CVSS Modified Vector components enables advanced triage and deeper analysis.
Use cases:
- Filter by CVSS version: To find vulnerabilities scored using CVSS v4.0., select a CVSS vector in the filter field and enter
"*CVSS:4.0*". - Filter by modified vector components: To find vulnerabilities where the attack vector has been adjusted based on your environment, select the
CVSS Modified Vectorin the filter field and enter"*MAV:*". - Filter by specific risk traits: To find vulnerabilities that require no privileges (
PR:N) or affect multiple components (S:C), select a CVSS vector filter in the filter field and enter"*PR:N*"or"*S:C*".
Filtering supports:
-
Partial matches (for example,
AV:will matchAV:N,AV:A, and so on) -
Free-text input (no strict formatting required)
-
Case-insensitive search (for example,
ui:nwill matchUI:N)
To learn more about CVSS scoring and vector structure, see How Dynatrace uses CVSS.
Format table
Select which columns are to be displayed:
- Go to the Prioritization page or the overview page of affected process groups or Kubernetes nodes.
- On the upper-right of the table, select the column settings .
- Select the desired columns, then select Confirm.
Group findings
You can keep your findings organized by grouping them into several categories. To group your findings:
-
In the Findings tab, go to the Group by dropdown located next to the Overview and Detailed tabs.
-
In the Group by drop-down menu you can select the following categories:
- Core
- Extended
- AWS
- Azure
- GCP
- Kubernetes
Each category consists of several grouping options. You can select up to three groupers at a time.
-
Once you've selected the groupers you wish to apply, click anywhere outside the menu.
When results are grouped, each group appears as a collapsible row. To expand it, select the .
Sort columns
Select the order in which results in a column should be displayed:
- Go to the Prioritization page or the overview page of affected process groups or Kubernetes nodes.
- Select a column title.
- Select Sort ascending or Sort descending.