Ingest Runecast Analyzer compliance findings
- Latest Dynatrace
- How-to guide
Prioritize Runecast compliance findings with runtime context from production.
Get started
Overview
Dynatrace integration with Runecast Analyzer allows you to access data relevant to Cloud Security Posture Management (CSPM) and VMware Security Posture Management (VSPM) on the Dynatrace platform. It provides options to uniformly visualize, analyze, and automate work related to compliance findings.
Runecast Analyzer ensures continuous compliance through its configuration analysis, generating security-related results for cloud (AWS, Azure, GCP) and VMware (vSphere, NSX-T) environments.
Requirements
See below for the Runecast and Dynatrace requirements.
Runecast requirements
-
Deploy Runecast Analyzer Runecast version 6.9.12.0+ with active licenses for each system type.
-
Permissions: To configure the integration, you need access with the
Global Adminrole. -
Enable security profiles for the supported systems (AWS, Azure, GCP, vCenter, and NSX-T).
Dynatrace requirements
-
Dynatrace version 1.313+
-
Support:
- Review the Supported compliance standards and technologies.
-
Permissions:
- To query ingested data:
storage:security.events:read.
- To query ingested data:
-
Tokens:
- Generate an access token with the
openpipeline.events_securityscope and save it for later. For details, see Dynatrace API - Tokens and authentication.
- Generate an access token with the
-
To visualize findings in our ready-made dashboard, make sure
 Security Posture Management is installed.
Activation and setup
To set up the Runecast Analyzer ingestion, follow the steps below.
1. Connect Runecast Analyzer to monitoring systems
- Log in to your Runecast Analyzer instance.
- Go to Menu in the upper-right corner and select System settings > Connected systems.
- Connect Runecast Analyzer to the systems you want to monitor for compliance.
2. Set up the Dynatrace integration
-
Go to Menu in the upper-right corner and select System settings > Integrations.
-
For Dynatrace, turn on Use Dynatrace Integration.
-
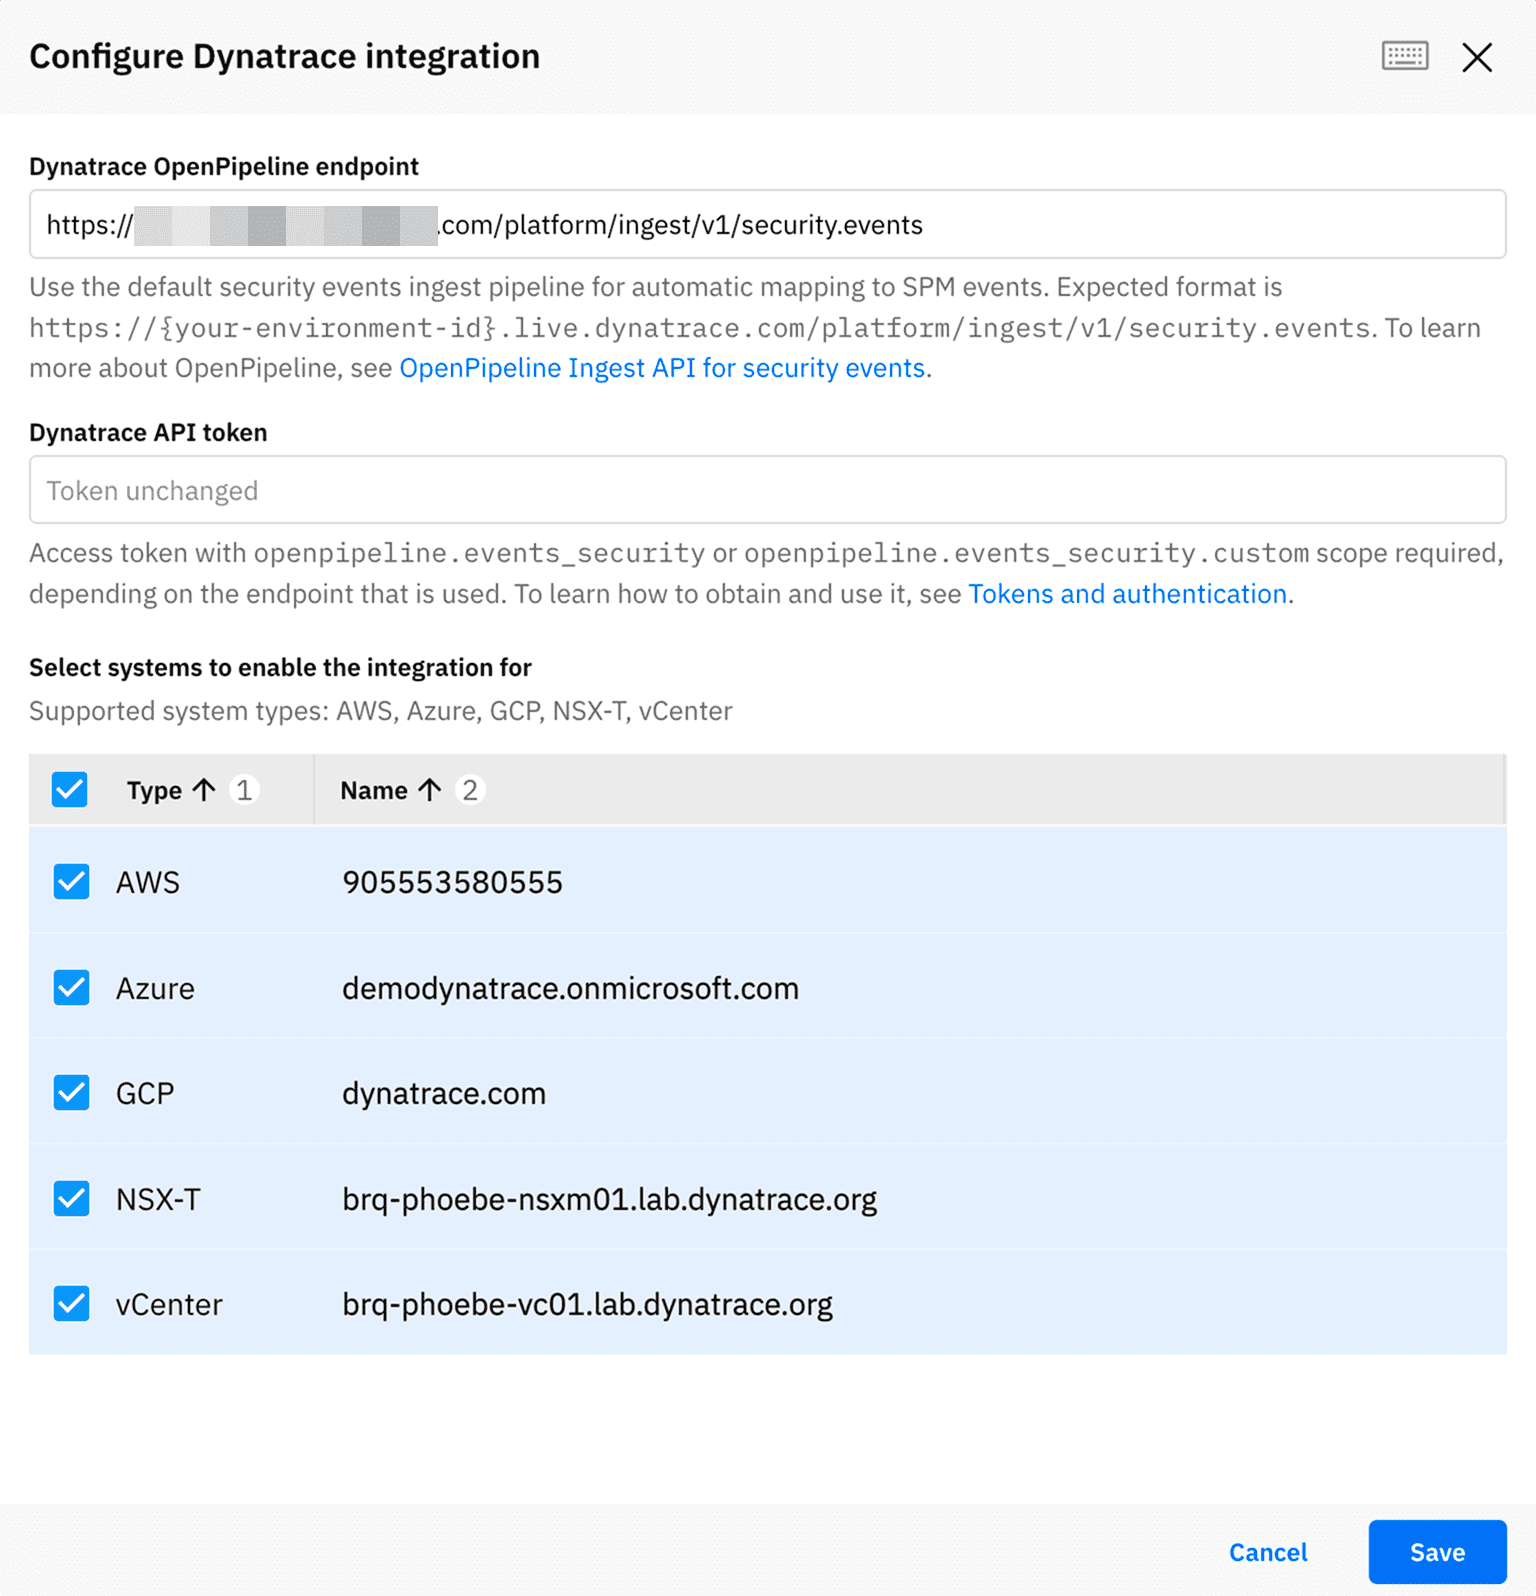
Select Edit and configure the integration as follows:
- Enter your OpenPipeline endpoint and the Dynatrace API token obtained in Prerequisites
- Select the systems for which you want to send the results to Dynatrace.
-
Select Save.
 configure integration
3. Start ingesting data
-
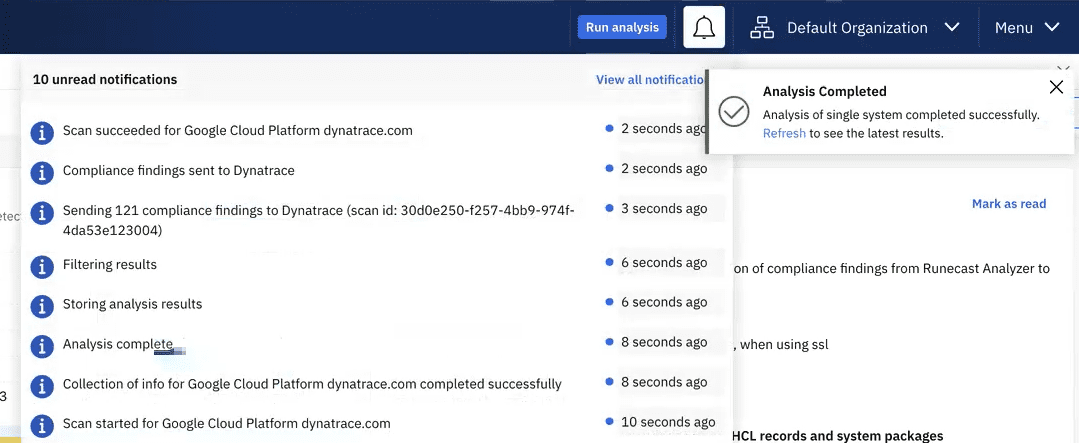
Go to Dashboard and select Run Analysis in the top menu bar. After each analysis, the results for selected systems are sent to Dynatrace.
There are several ways to trigger analysis: on demand, by periodic schedule, or via the Runecast API.
-
When analysis is complete, you can see the status in Notifications.
Details
How it works
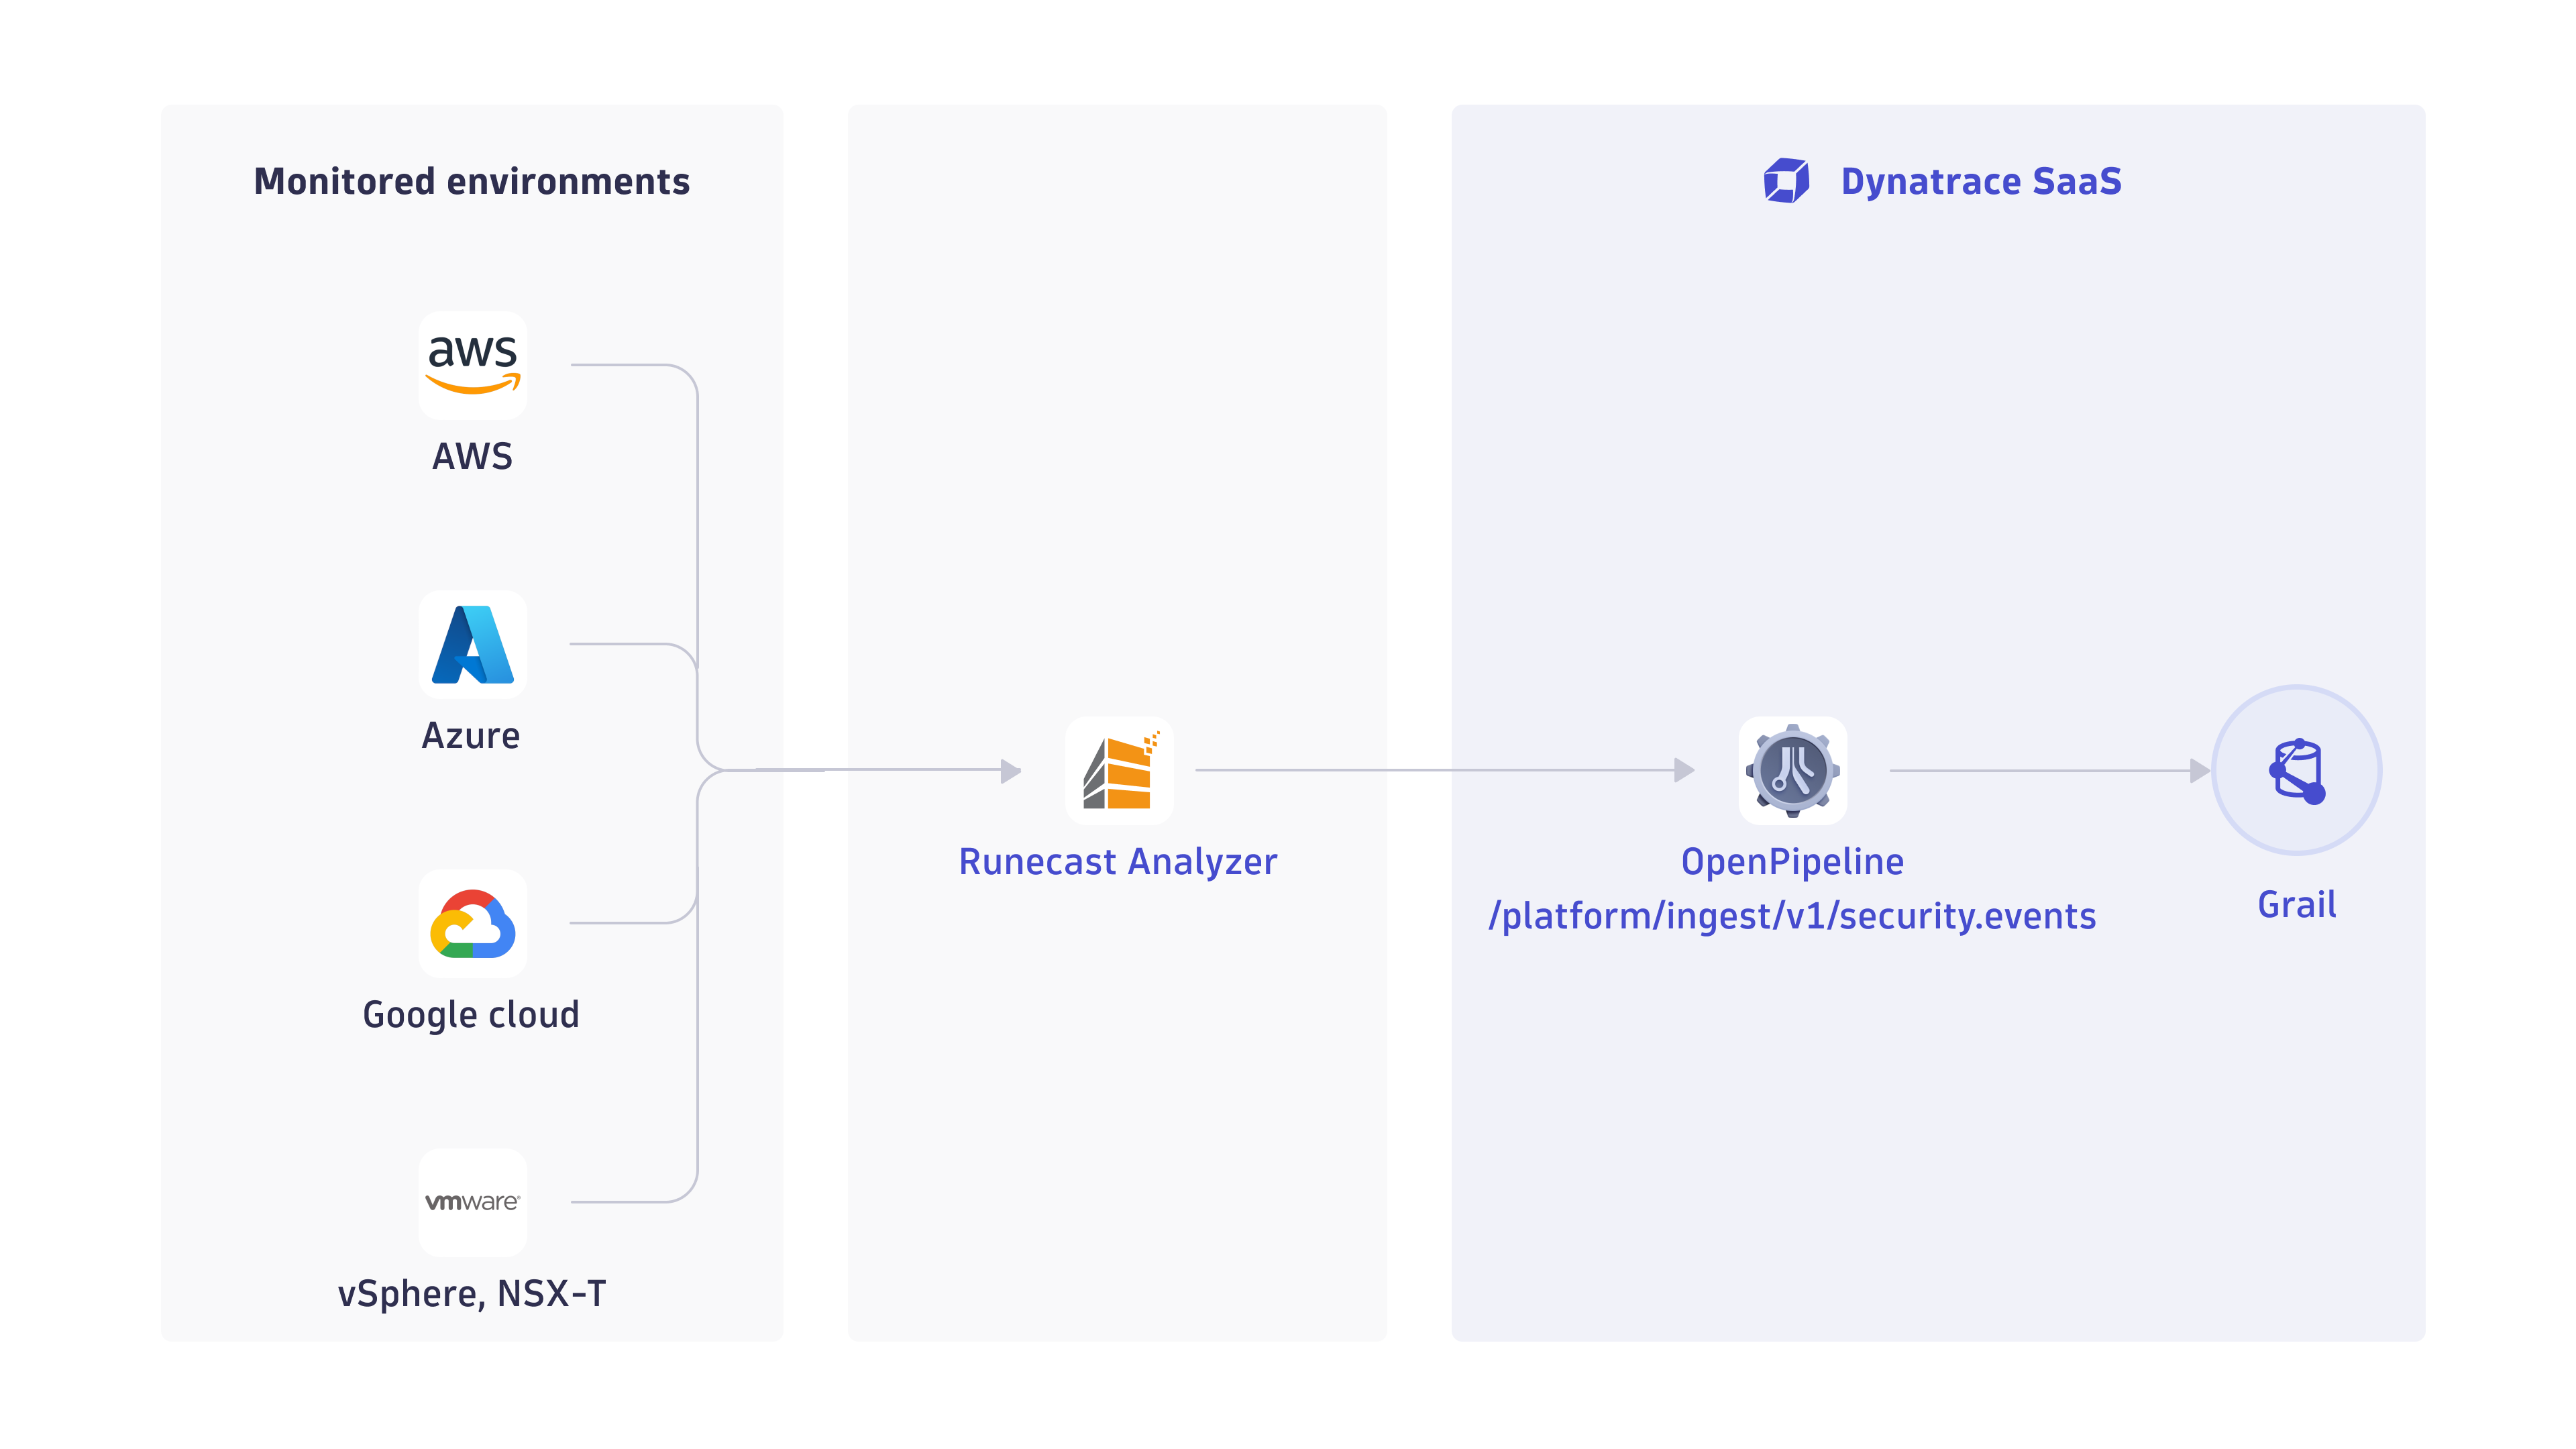
1. Runecast Analyzer monitors environments
After you deploy and configure Runecast Analyzer, it continuously runs configuration analysis on monitored environments relevant to Cloud Security Posture Management (CSPM) and VMware Security Posture Management (VSPM).
2. Analysis results are ingested into Dynatrace
When Dynatrace integration is configured for a monitored environment, all compliance results are ingested into Dynatrace via a dedicated OpenPipeline security events ingest endpoint with every analysis.
3. Security compliance findings are processed and stored in Grail
The OpenPipeline endpoint processes and maps the results to the security compliance findings according to the Semantic Dictionary conventions. These are stored in a bucket called default_securityevents (for details, see: Built-in Grail buckets).
4. Compliance results are ready to use
Once data is ingested into Grail, you can
- Analyze your environments’ security posture and evaluate your compliance with industry standard
- Visualize the posture with the ready-made dashboard, which is part of Security Posture Management
What's next
Once you set up the Runecast Analyzer integration, you can
-
Visualize data with our Security Posture Overview dashboard
-
Example dashboard
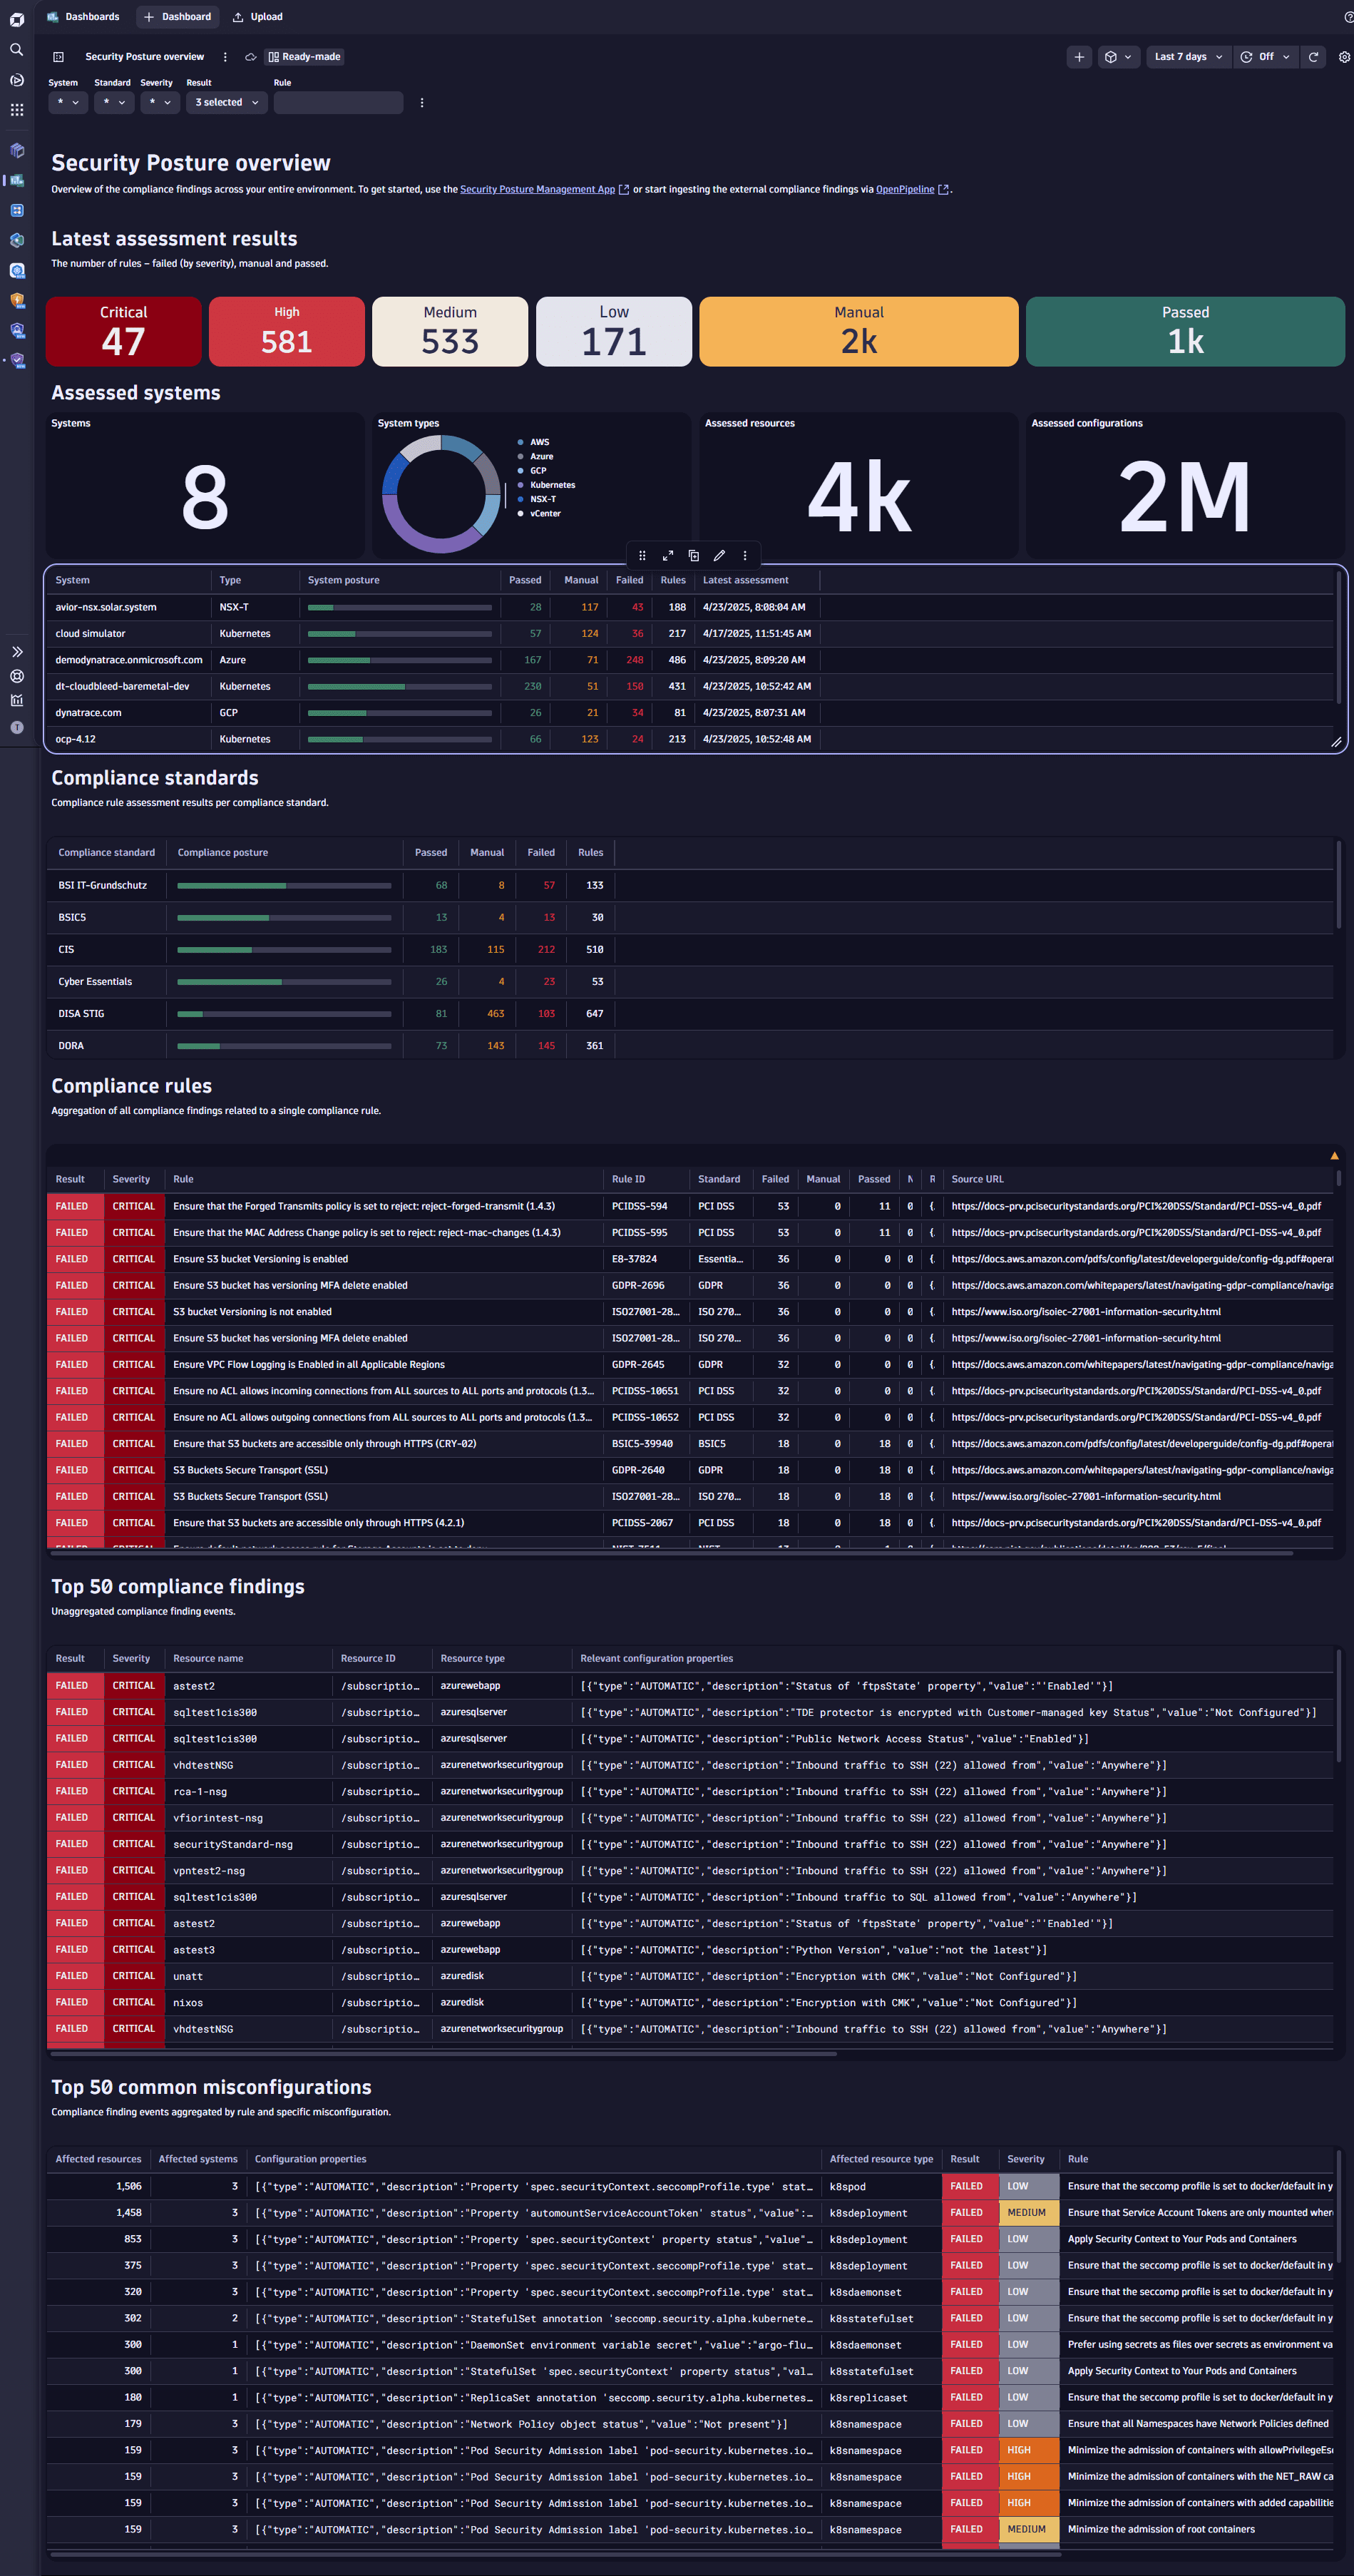 security posture overview
 -
How to access the dashboard
There are two ways to access the dashboard:
- Via
 Dashboards (in the Dashboards panel, select Ready-made)
 - Via Hub (select Security Posture Management, then look for the dashboard in the Contents tab table)
- Via
-
-
Query compliance events with
 Investigations or
  Notebooks.
- For a list of DQL examples based on compliance events that you can use for further investigation or reporting, see Query compliance events.
Licensing and costs
For billing information, see Events powered by Grail.