Ingest Kyverno compliance findings
- Latest Dynatrace
- How-to guide
Ingest Kyverno compliance findings into Dynatrace as security events. With runtime context from Dynatrace, you can analyze Kubernetes policy results together with the services and workloads they affect.
Get started
Overview
The Dynatrace integration with Kyverno allows you to unify and contextualize Kubernetes policy and compliance findings with other security data on the Dynatrace platform.
Kyverno is a Kubernetes-native policy engine that validates, mutates, and generates resource configurations. When validating policies are deployed in a cluster, Kyverno evaluates targeted resources and produces standardized OpenReports reports.
This integration deploys a custom OpenTelemetry Collector distribution that reads Kyverno OpenReports, transforms policy results into Dynatrace security events, and pushes them to the OpenPipeline security events ingest endpoint.
Dynatrace maps the ingested data to runtime entities that are part of your monitored environment for unified analysis, prioritization, and orchestration.
Use cases
With the ingested data, you can accomplish various use cases, such as
Requirements
See below for the Kyverno and Kubernetes and Dynatrace requirements.
Kyverno and Kubernetes requirements
- A running Kubernetes cluster version 1.26 or later.
kubectlconfigured with permissions to createClusterRoleandClusterRoleBindingresources.- Helm 3 or 4.
- Kyverno installed with OpenReports enabled.
- Validating Kyverno policies deployed in the cluster. For policy types that produce reports, see Which Kyverno policy types produce reports?.
Enable OpenReports and configure Kyverno metrics
Enable OpenReports and configure Kyverno controllers to send metrics over OTLP gRPC with the following minimum Helm values:
openreports:enabled: trueinstallCrds: trueadmissionController:metering:disabled: falseconfig: grpcport: 4317collector: otel-collector.dynatrace.svc.cluster.localbackgroundController:metering:disabled: falseconfig: grpcport: 4317collector: otel-collector.dynatrace.svc.cluster.localcleanupController:metering:disabled: falseconfig: grpcport: 4317collector: otel-collector.dynatrace.svc.cluster.localreportsController:metering:disabled: falseconfig: grpcport: 4317collector: otel-collector.dynatrace.svc.cluster.local
For the full list of metrics emitted by Kyverno, see Kyverno metrics. To decide which policy types to deploy, see Kyverno policy types.
Dynatrace requirements
Generate a platform token or a Classic access token and save it for later.
| Platform token scope | Classic access token scope | Purpose |
|---|---|---|
|
| Ingest security events through |
|
| Send OTLP metrics to Dynatrace. |
|
| Send OTLP logs to Dynatrace. |
|
| Send OTLP traces to Dynatrace. |
Activation and setup
To integrate Kyverno OpenReports with Dynatrace, deploy the custom Dynatrace Security Events Collector in your Kubernetes cluster.
The required collector image is available at
ghcr.io/dynatrace-oss/dynatrace-security-events-collector:latest
This collector image can ingest, parse, and transform Kyverno OpenReports into Dynatrace security events that follow the Dynatrace Semantic Dictionary.
Use one of the following deployment approaches.
Recommended
Use this option if you already have the OpenTelemetry Operator installed or if you prefer CRD-based lifecycle management.
1. Prepare the environment
-
Create the namespace.
kubectl create namespace dynatrace -
Create a Kubernetes Secret with your Dynatrace endpoint, API token, and cluster name.
kubectl -n dynatrace create secret generic dynatrace-secrets \--from-literal=endpoint=https://<your-environment>.dynatrace.com \--from-literal=api-token=dt0XXX.XXXXXXXX \--from-literal=cluster-name=<your-cluster-name>Replace:
-
<your-environment>with your Dynatrace environment. -
dt0XXX.XXXXXXXXwith the platform token or Classic access token you generated for this integration. -
<your-cluster-name>with a name that identifies this cluster in Dynatrace (for example,prod-eu-1). The cluster name is optional but recommended for multi-cluster setups.
-
-
Apply RBAC permissions.
The collector needs read access to OpenReports resources and core Kubernetes objects to enrich security events with workload context. The
rbac.yamlmanifest creates aServiceAccount, aClusterRole, and aClusterRoleBindingwith the required read-only permissions.curl -O https://raw.githubusercontent.com/dynatrace-oss/dynatrace-security-events-collector/refs/heads/master/manifests/rbac.yamlkubectl apply -f rbac.yaml
2. Install the OpenTelemetry Operator
Skip this step if the OpenTelemetry Operator is already installed in your cluster.
helm repo add open-telemetry https://open-telemetry.github.io/opentelemetry-helm-chartshelm install opentelemetry-operator open-telemetry/opentelemetry-operator \--namespace opentelemetry-operator-system --create-namespace
3. Deploy the collector
The openTelemetry-manifest_statefulset.yaml file defines an OpenTelemetryCollector custom resource that the operator manages.
curl -O https://raw.githubusercontent.com/dynatrace-oss/dynatrace-security-events-collector/refs/heads/master/manifests/openTelemetry-manifest_statefulset.yamlkubectl apply -f openTelemetry-manifest_statefulset.yaml
Use the custom collector image from ghcr.io/dynatrace-oss/dynatrace-security-events-collector:latest. The default upstream OpenTelemetry Collector image doesn't include the required Security Event Processor and Exporter plugins.
4. Verify the deployment
-
Check pod status.
kubectl -n dynatrace get podsYou should see a pod named
security-events-collector-*with the statusRunning. -
Check the logs.
kubectl -n dynatrace logs -l app.kubernetes.io/name=security-events-collector --tail=50Look for log lines that mention OpenReports being processed and events being exported.
-
Verify events in Dynatrace.
After the first findings are sent, run the following query in
 Notebooks:fetch security.events| filter dt.system.bucket == "default_securityevents"| filter event.kind == "SECURITY_EVENT"AND event.provider == "Kyverno"AND event.type == "COMPLIANCE_FINDING"
5. Uninstall the integration
Removing the collector stops new security events from being ingested. It doesn't delete events that have already been stored in Grail. These events are retained according to your environment's data retention policy.
-
Delete the
OpenTelemetryCollectorresource.kubectl -n dynatrace delete opentelemetrycollector otel -
Optional Uninstall the OpenTelemetry Operator if it was installed only for this integration.
helm uninstall opentelemetry-operator --namespace opentelemetry-operator-system -
Delete the shared resources.
kubectl delete clusterrolebinding otelcontribcolkubectl delete clusterrole otelcontribcolkubectl -n dynatrace delete serviceaccount security-events-collectorkubectl -n dynatrace delete secret dynatrace-secrets
Details
How it works
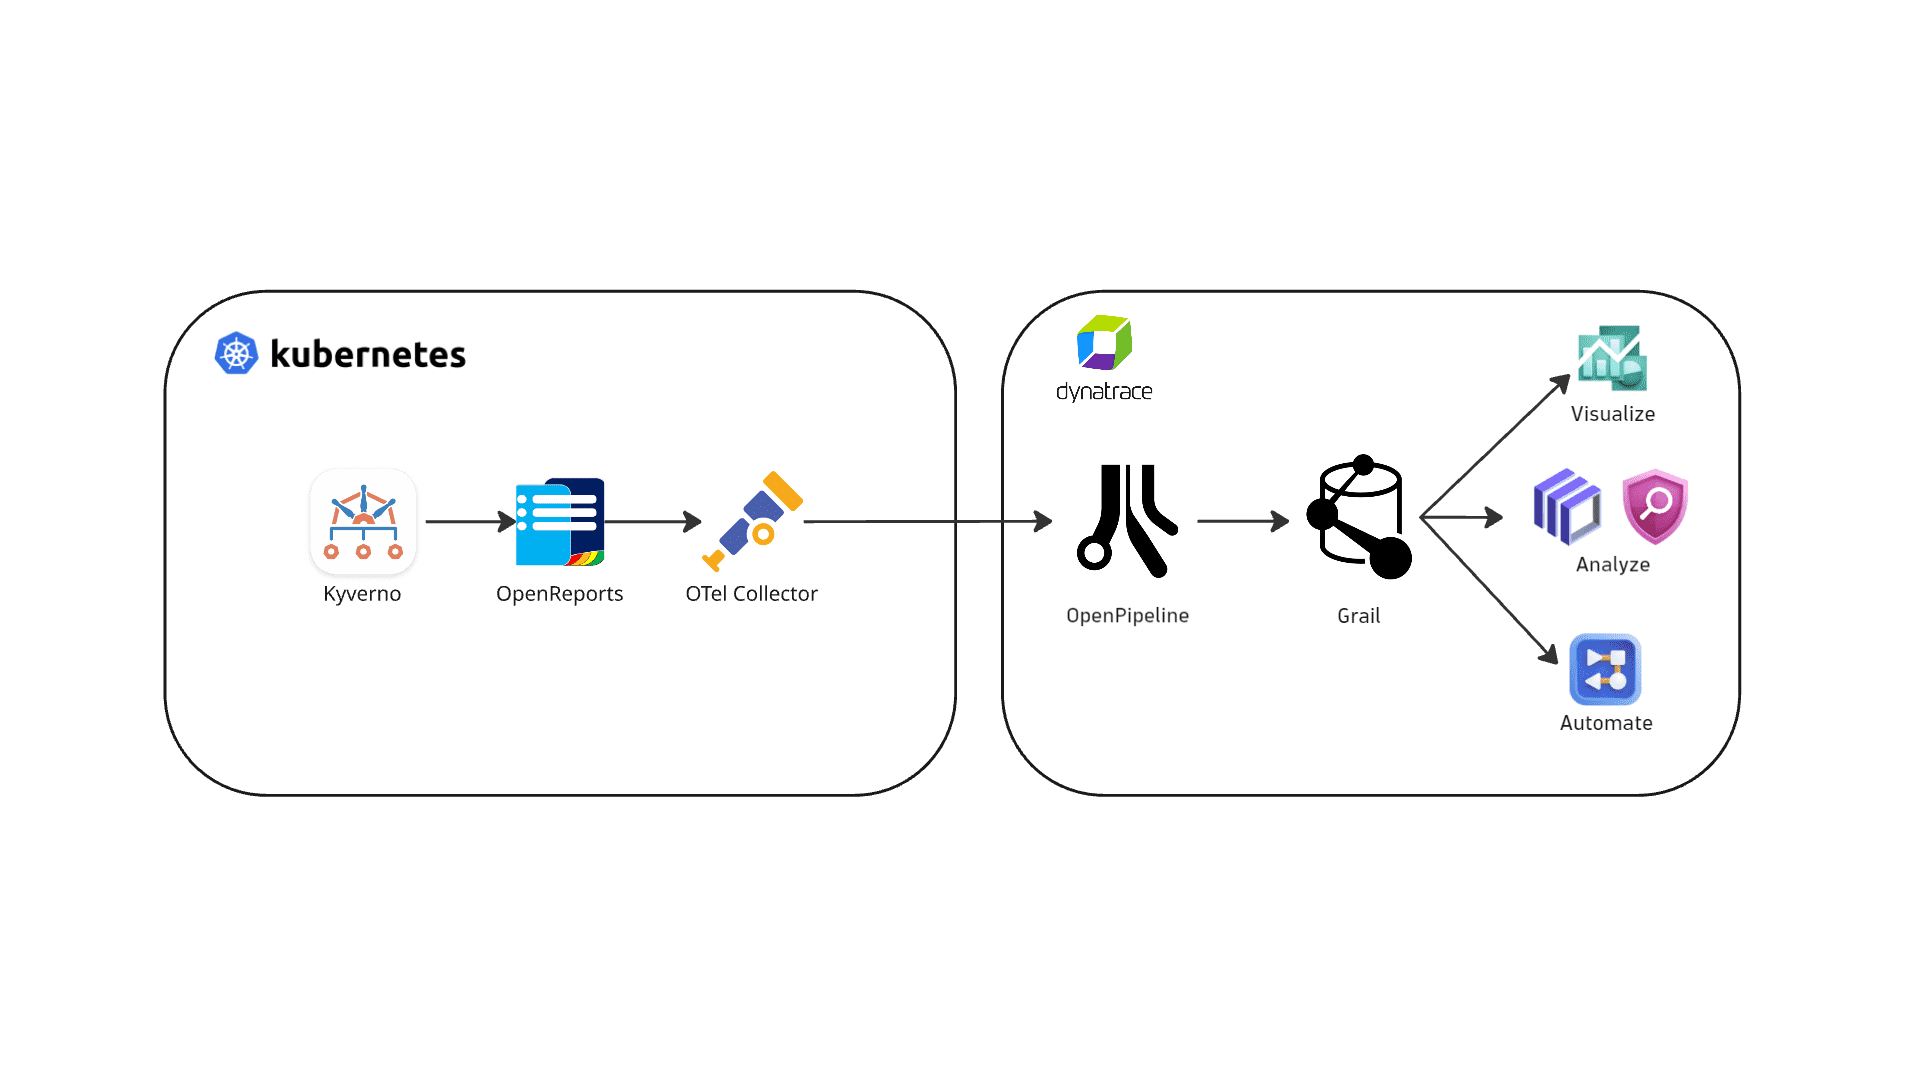
Kyverno compliance findings flow from OpenReports through the Dynatrace Security Events Collector to the OpenPipeline security events endpoint, where Dynatrace stores them in Grail as security events.
- Kyverno validates Kubernetes resources against deployed validating policies. For each policy evaluation, Kyverno produces OpenReports containing per-resource results with severity and compliance details.
- The
k8sobjectsreceiver in the OpenTelemetry Collector readsreportsandclusterreportsresources from theopenreports.ioAPI group on a configured interval. - The custom
securityeventprocessor parses each OpenReport, extracts individual policy results, and maps them to the Dynatrace security event semantic data model. The mapping adds severity, risk score, compliance status, finding title, product vendor, and Kubernetes context. - The
k8sattributesprocessor adds Kubernetes metadata, such as cluster UID and namespace. Theresourceprocessor adds the cluster name. - The custom
securityeventexporter sends batched HTTP POST requests to/platform/ingest/v1/security.events, authenticated with a Dynatrace API token. - Dynatrace stores the security events in Grail in the
default_securityeventsbucket. The events become queryable in Notebooks,  Investigations, and
  Dashboards, and you can use them in workflows.
Advanced configuration
The Dynatrace Security Events Collector is a custom OpenTelemetry Collector distribution that chains three components in a logs pipeline to transform Kubernetes policy compliance data into Dynatrace security events.
k8sobjects receiver securityevent processor securityevent exporter(pulls OpenReports) -> (transforms to events) -> (posts to Dynatrace)
The pipeline type is logs because the k8sobjects receiver emits Kubernetes objects as log records. The processor and exporter operate on these log records.
Configure OpenReports collection
The k8sobjects receiver watches or pulls Kubernetes custom resources and emits them as log records. This integration uses it to pull OpenReports from Kyverno and other policy engines that implement the OpenReports specification.
OpenReports receiver configuration
receivers:k8sobjects:auth_type: serviceAccountobjects:- name: clusterreportsgroup: openreports.iomode: pullinterval: 10m- name: reportsgroup: openreports.iomode: pullinterval: 10m
| Parameter | Description |
|---|---|
| Authentication method. Use |
| Kubernetes resource name to collect. Use |
| API group. OpenReports use |
| Collection mode. |
| How often to pull reports. The default is |
Filter by status
By default, the processor handles all Kyverno result statuses: pass, fail, error, and skip. To reduce event volume and ingest cost, you can process only specific statuses.
Status filter configuration
processors:securityevent:processors:openreports:enabled: truestatus_filter:- "fail"- "error"
Licensing and costs
For billing information, see Events powered by Grail.
FAQ
What type of data is ingested from Kyverno?
The collector ingests compliance finding events: one security event per policy result and Kubernetes resource evaluated by Kyverno. Each event represents a single pass, fail, error, or skip verdict from a Kyverno policy rule applied to a specific resource.
Dynatrace categorizes these events as COMPLIANCE_FINDING with category COMPLIANCE in the security event schema.
How are Kyverno compliance findings imported into Dynatrace?
The integration is push-based from the Kubernetes cluster to Dynatrace. The custom collector periodically reads OpenReports from the Kubernetes API and pushes transformed security events to the Dynatrace security events ingest endpoint.
The k8sobjects receiver queries reports and clusterreports resources at a fixed interval. Each pull fetches existing reports. The processor uses SHA256-based deduplication to prevent previously sent results from creating duplicate events in Dynatrace.
Kyverno's background scanner runs on its own schedule, which is 1 hour by default. The collector interval and Kyverno scan schedule are independent.
How many events does one OpenReport generate?
One OpenReport typically contains many individual policy results, with one result per evaluated resource. For example, if a policy targets 50 Deployments, the report contains 50 results, and the processor expands this into 50 individual security events.
You can monitor this expansion with the processor metrics:
processor_securityevent_incoming_logs_total: reports receivedprocessor_securityevent_outgoing_logs_total: events emitted
Which Kyverno policy types produce reports?
Only validating policy types produce OpenReports that can be ingested. Mutating, generating, deleting, and cleanup policies don't produce reports and don't appear in Dynatrace through this integration.
| Policy type | Scope | Report type |
|---|---|---|
| Cluster-wide |
|
| Namespaced |
|
| Cluster-wide |
|
| Namespaced |
|
| Cluster-wide |
|
| Cluster-wide |
|
| Namespaced |
|
How are severity and risk score mapped?
Dynatrace maps risk levels and scores from the original Kyverno policy severity. If no severity is specified in the policy, Dynatrace uses MEDIUM.
dt.security.risk.level (mapped from finding.severity) | dt.security.risk.score |
|---|---|
critical → CRITICAL | 10.0 |
high → HIGH | 8.9 |
medium → MEDIUM | 6.9 |
low → LOW | 3.9 |
missing or unknown → NONE | 0.0 |
Can I use the default upstream OpenTelemetry Collector image?
No. This integration requires the Security Event Processor and Security Event Exporter plugins. These plugins aren't part of the upstream OpenTelemetry Collector or Collector Contrib distributions. Use the pre-built image from ghcr.io/dynatrace-oss/dynatrace-security-events-collector:latest or build a custom collector that includes these plugins.
What happens if the collector restarts?
The collector reads all existing OpenReports on the next interval. The processor's SHA256-based deduplication prevents duplicate events from being sent to Dynatrace. No data is lost.
Can I use this integration with multiple clusters?
Yes. Each cluster's collector should set a unique k8s.cluster.name value through the CLUSTERNAME environment variable or the cluster-name key in the Kubernetes Secret.
You can then filter events per cluster in DQL:
fetch security.events| filter event.type == "COMPLIANCE_FINDING"| filter k8s.cluster.name == "production-eu-west-1"