Ingest Google Artifact Registry vulnerability findings
- Latest Dynatrace
- How-to guide
- Published Apr 21, 2026
Prioritize Google Artifact Registry container image vulnerabilities with runtime context from production.
Get started
Overview
The Dynatrace integration with Google Artifact Registry allows you to unify and contextualize security findings across tools and products, enabling central prioritization, visualization, and automation.
Google Artifact Analysis generates vulnerability findings for container images uploaded to Artifact Registry. The Dynatrace platform observes the runtime entities, such as containers, related to those images. Ingesting the vulnerability findings from Artifact Registry helps you analyze and prioritize those findings in the context of your production apps.
Use cases
With the ingested data, you can accomplish various use cases, such as
Requirements
See below for the Google Cloud Platform and Dynatrace requirements.
Google Cloud Platform requirements
- Install and configure the latest GCP CLI.
- Enable the Google Cloud Infrastructure Manager API.
- Configure a Google Cloud service account to use with Infrastructure Manager.
- Ensure that the default Pub/Sub topic
container-analysis-occurrences-v1exists.
Dynatrace requirements
- Generate an access token with the
openpipeline.events_securityscope and save it for later. For details, see Dynatrace API - Tokens and authentication.
Set up the integration
-
Optional When using gcloud CLI for the first time, log in and set up your project.
gcloud auth logingcloud config set project <PROJECT_ID>gcloud config set compute/region <REGION> -
Store the Dynatrace access token as a secret in GCP by running the following command in GCP CLI.
echo -n "<Dynatrace access token>" | gcloud secrets create dt-security-api-token --data-file=--
Replace
<Dynatrace access token>with the generated token for security events ingest. -
Optional Name the secret following your standards. The default name in the command is
dt-security-api-token. This ID is used in the following steps.
-
-
Clone the Dynatrace Open Source cloud-snippets repository from GitHub and navigate to the
gcp/google-artifact-registry-security-integrationdirectory.git clone --filter=blob:none --sparse https://github.com/dynatrace-oss/cloud-snippets.gitcd cloud-snippetsgit sparse-checkout set gcp/google-artifact-registry-security-integrationcd gcp/google-artifact-registry-security-integration -
Create a
terraform/terraform.tfvarsfile with the appropriate variable values. You can use the sample file provided interraform/terraform.tfvars.example. Sample content:project_id = "PROJECT_ID"region = "europe-west1"gcp_org_id = "123456789"gcp_org_name = "your-organization"dt_base_url = "https://MY_ENV.live.dynatrace.com"dt_api_token_secret_id = "dt-security-api-token"Use the same secret ID for the stored Dynatrace token from step 2 (for example,
dt-security-api-token).You can find the full variable list in the
terraform/variables.tffile. -
Create the Infrastructure Manager deployment by running the following command:
gcloud infra-manager deployments apply \projects/<PROJECT_ID>/locations/<REGION>/deployments/artifact-analysis-dt-export \--service-account projects/<PROJECT_ID>/serviceAccounts/<SERVICE_ACCOUNT_EMAIL> \--local-source="terraform" \--inputs-file="terraform/terraform.tfvars"Where
SERVICE_ACCOUNT_EMAILis the email of a Google Cloud service account with permissions to use Infrastructure Manager, andPROJECT_IDandREGIONcorrespond to the project and region where the Infrastructure Manager deployment will be created. -
After first scans occur and are sent to Dynatrace, verify events in Grail by running the following query in
 Notebooks:fetch security.events| filter dt.system.bucket == "default_securityevents"| filter event.kind == "SECURITY_EVENT"AND event.provider == "Google Artifact Registry"
 -
To delete the integration-related deployment, run:
gcloud infra-manager deployments delete \projects/<PROJECT_ID>/locations/<REGION>/deployments/artifact-analysis-dt-export
Details
How it works
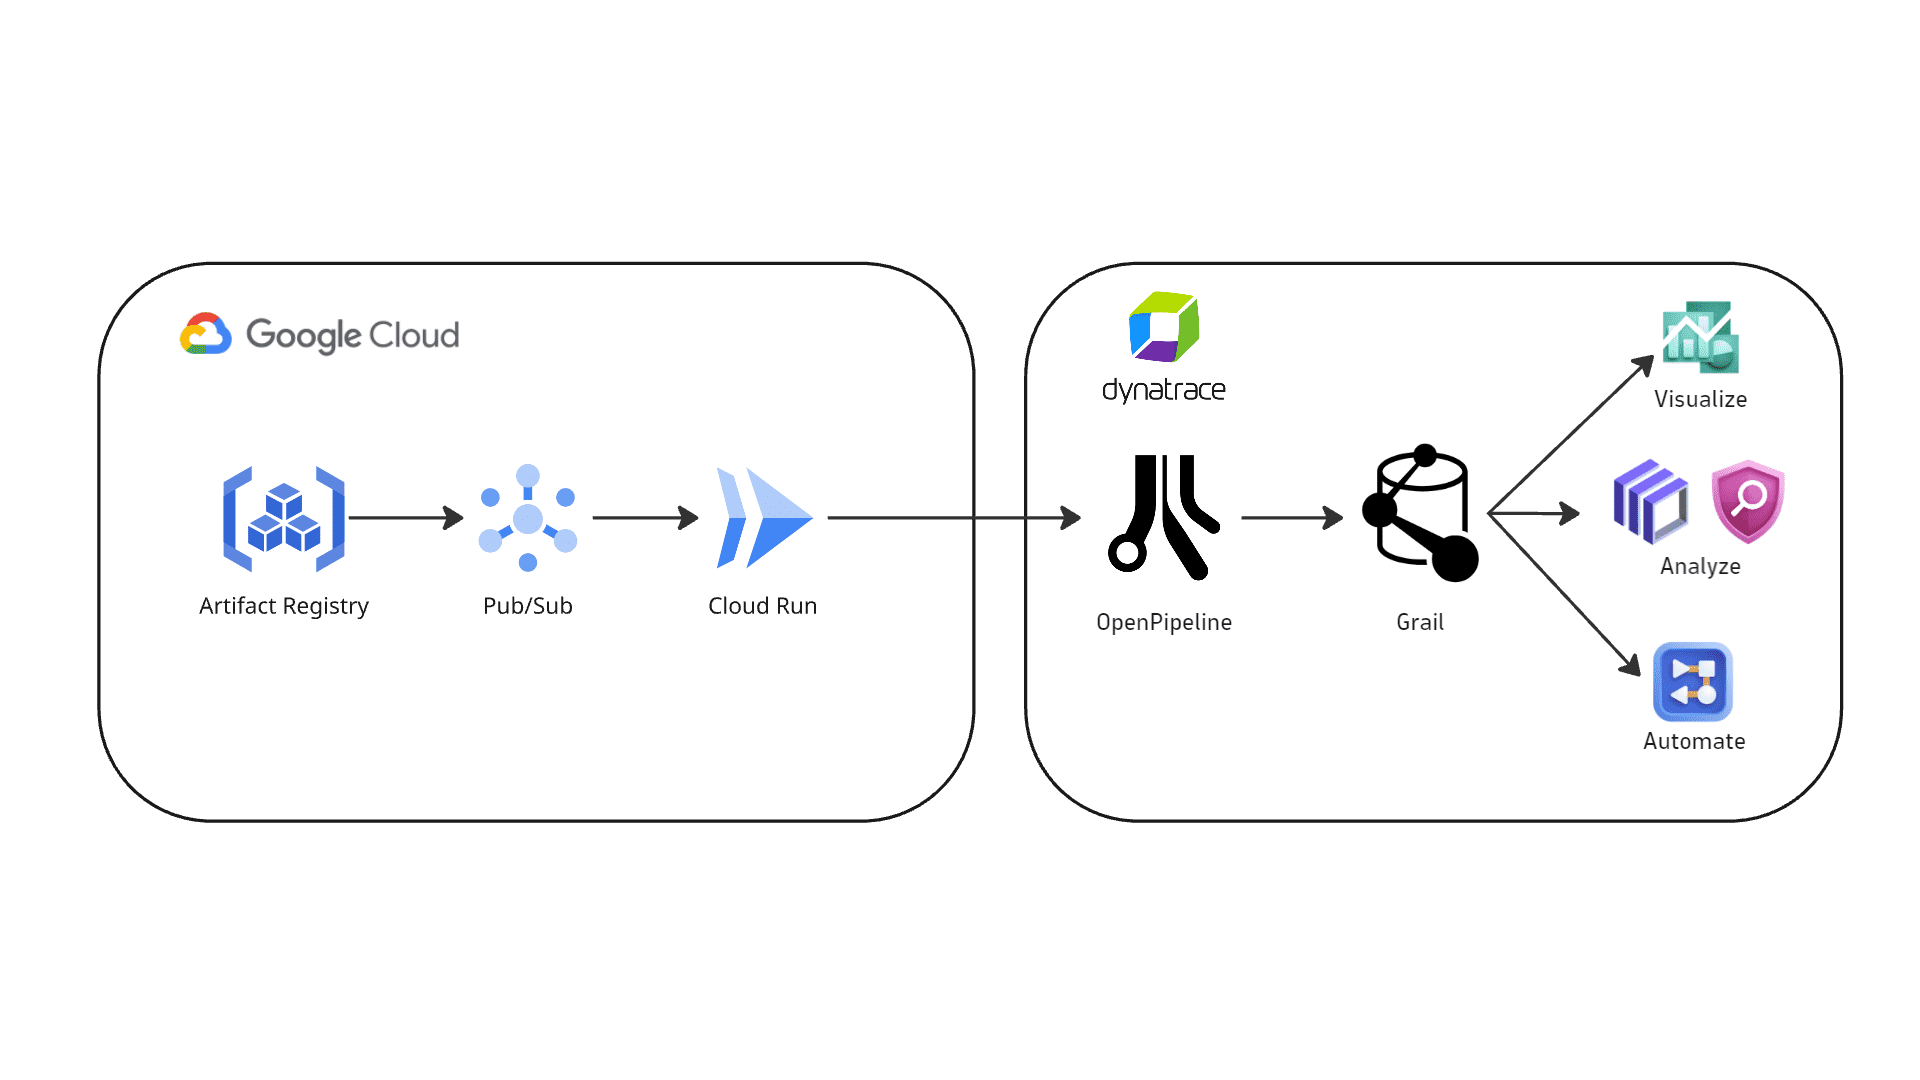
Google Artifact Registry integration — vulnerability findings flow from Artifact Registry through Pub/Sub and Cloud Run to Dynatrace OpenPipeline, where they are stored in Grail as security events.
-
Events are ingested into Dynatrace
-
Google Artifact Analysis events are sent to a Google Pub/Sub topic, which triggers a Cloud Run function. All events coming into the
container-analysis-occurrences-v1topic are forwarded to the Cloud Run function. -
The Cloud Run function pre-processes the events and sends them to Dynatrace using the dedicated OpenPipeline security events ingest endpoint. Only events that have
kind: VULNERABILITYare ingested; all others are skipped.
-
-
Security findings are processed and stored in Grail
-
The ingested data is mapped to the Dynatrace Semantic Dictionary.
-
Data is stored in Dynatrace in a unified format in a default bucket called
default_securityevents(for details, see Built-in Grail buckets).
-
Licensing and costs
For billing information, see Events powered by Grail.
FAQ
Which data model is used for security events from Google Artifact Registry?
Vulnerability finding events store the individual vulnerability findings reported per affected container image.
Where is the full vulnerability data coming from?
Google Artifact Analysis reports very limited data in the Pub/Sub message reported to container-analysis-occurrences-v1. To complement this data, the Cloud Run function calls the following APIs:
Only occurrences of kind: VULNERABILITY are reported.
Which additional fields are added to events ingested from Google Artifact Registry?
A gcp namespace is added to store GCP-related information.
How is the risk score normalized for Google Artifact Registry findings?
Dynatrace normalizes severity and risk scores for all findings ingested through this integration. This helps you prioritize findings consistently, regardless of their source. For details, see Severity and score normalization.
dt.security.risk.levelis mapped from the effective severity level determined by Google Artifact Registry.dt.security.risk.scoreis mapped directly from the effective severity level.
dt.security.risk.level (mapped from finding.severity) | dt.security.risk.score |
|---|---|
CRITICAL → CRITICAL | 10.0 |
HIGH → HIGH | 8.9 |
MEDIUM → MEDIUM | 6.9 |
LOW → LOW | 3.9 |
MINIMAL → NONE | 0.0 |
SEVERITY_UNSPECIFIED → NOT_AVAILABLE | 0.0 |
How do I troubleshoot events not showing in Dynatrace?
If events are not showing in Dynatrace, check the Cloud Run function logs:
- In the Google Cloud Console, go to Cloud Run functions > dt-artifact-analysis (or the name of your function if you changed it) > Logs.
- Filter for
dynatrace.- If the events are being sent to Dynatrace, you will see the message
Dynatrace ingest successful - If the events are not being sent to Dynatrace, you will see the message
Dynatrace ingest failedwith error details
- If the events are being sent to Dynatrace, you will see the message