Investigations concepts
- Latest Dynatrace
- Explanation
Understand essential concepts and key terms for  Investigations.
Investigation
An investigation is a scenario you create to explore, analyze, and resolve complex data-driven questions — from security incidents and performance issues to operational anomalies and compliance checks.
Once you create an investigation (in Investigations, select  Investigation), you can build, rename, or delete it; switch between investigations (all your changes are automatically saved); share it with others.
You can create an unlimited number of investigation scenarios.
- Example scenario: Threat hunting and forensics
You can create a maximum of 100 nodes per investigation.
The maximum size of an investigation is 1 GB.
- You can check the number of nodes and size of an investigation on the Investigations home page. Each investigation card contains information about the investigation size and number of queries.
Query tree
The query tree is a visual representation of your investigation history, designed to help you efficiently manage your query activities.
You can quickly
- Navigate through your query history
- Revisit executed query results
- Enhance and run queries
- Keep track of your investigation steps
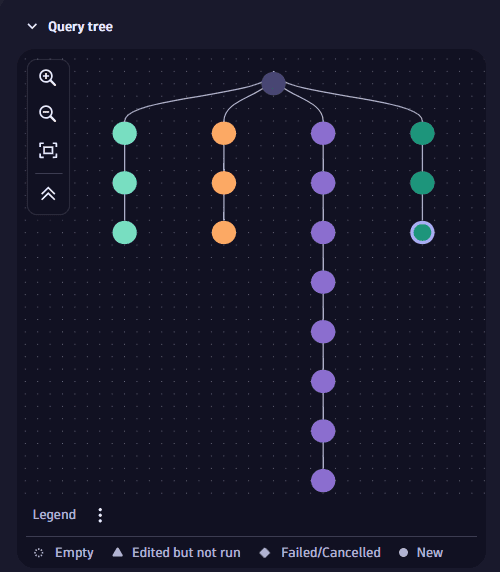
How it works
A query tree is composed of:
- Root node
The initial node created in the query tree when you execute your first DQL query.
- Query node
Each time you modify and execute a DQL query, a new query node is added to the tree. A string of query nodes forms a query branch.
- Query branch
A visual representation of your investigation path. It's made up of a string of query nodes. If you navigate to a previous query and then modify and execute it, a new query branch with a new query node is created from the respective query.
Despite any modification in the query tree, the following elements are always preserved:
- The integrity of the previously existing queries and results
- The relations among queries
- The context of the investigation
If you modify your query to a point where no further analysis is possible, you can navigate back in the tree to your last working query and continue your investigation from there. This creates a new branch in the query tree.
For details about how to use the query tree, see Manage the query tree.
Evidence list
Evidence lists are relevant fragments from logs and IP addresses saved for later use.
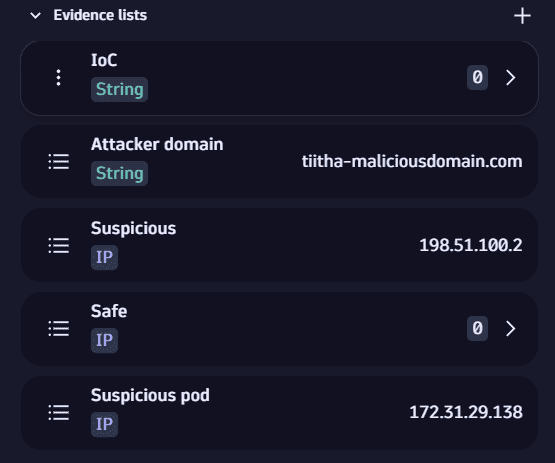
Once you add evidence to the evidence lists, you can filter or search for evidence using the saved values.
For details about how to manage evidence, see Manage evidence.
Reference time
Reference time adds the time perspective to keep track of the relative time between events you’re analyzing and the time when an incident occurred.
For details, see Define reference time.
Log pivoting
Log pivoting enables instant navigation and analysis of interconnected log data from any record across available dimensions, saving time on manual query creation and accelerating investigations.
For details, see Pivot results.
IP enrichment
IP enrichment adds external reputation data to IP addresses using trusted threat intelligence sources such as AbuseIPDB or VirusTotal. This provides additional context for faster triage and helps assess the relevance of IPs during investigations.
For details, see Enrich IP addresses.
Lookup tables for contextual enrichment
Lookup tables are structured datasets stored in Grail that enrich your investigations with external or behavioral context. They allow you to correlate raw events with known patterns, user behavior, or asset metadata—helping you identify anomalies and reduce false positives.
For example, a successful login might seem typical for a user. But when compared against a lookup table showing the user's usual login location or time of access, it could reveal suspicious behavior.
You can create lookup tables by uploading files or saving query results, and then manage and use them to enrich your queries directly within Investigations. For instructions, see Create and use lookup tables. For details on how lookup data works, see Lookup data in Grail.
Performance metrics correlation
Performance metrics correlation enables investigators to view system-level indicators—such as CPU, memory, or network usage—alongside log data. This helps identify whether performance anomalies align with other events in your investigation and supports more precise root cause analysis.
For details, see Correlate logs with performance metrics.