Infrastructure & Operations
- Latest Dynatrace
- App
- 13-min read
The  Infrastructure & Operations app simplifies infrastructure health monitoring and facilitates root cause analysis for problems.
- Health indicators powered by Dynatrace Intelligence help you detect early signs of performance degradation to quickly see which areas of your environment need attention.
- Check infrastructure host health metrics, logs, and events for all infrastructure entities.
- Drill down from Infrastructure & Operations to any infrastructure entity metrics, logs, or events.
Prerequisites
- Deploy Dynatrace OneAgent on your hosts—it's the optimal choice to collect the most granular metrics and network insights.
- If you are using cloud services, integrate your cloud infrastructure with Dynatrace. Follow the specific integration guides for AWS, Azure, Google Cloud, or other cloud providers.
- OneAgent version 1.337+ is required for Smartscape support.
- Older OneAgent versions are supported in backward compatibility mode. In that mode, an additional Explorer Classic tab appears in the UI.
Permissions
The following table describes the required permissions.
Get started
Infrastructure & Operations provides an up-to-date and comprehensive view of your monitored environments. Use the app to quickly identify areas that require attention and drill down to the exact root cause of issues.
Navigation
Infrastructure & Operations provides an Explorer tab where you can monitor and analyze your hosts, containers, processes, network devices, and technologies.
For details, see Explorer view in Dynatrace apps.
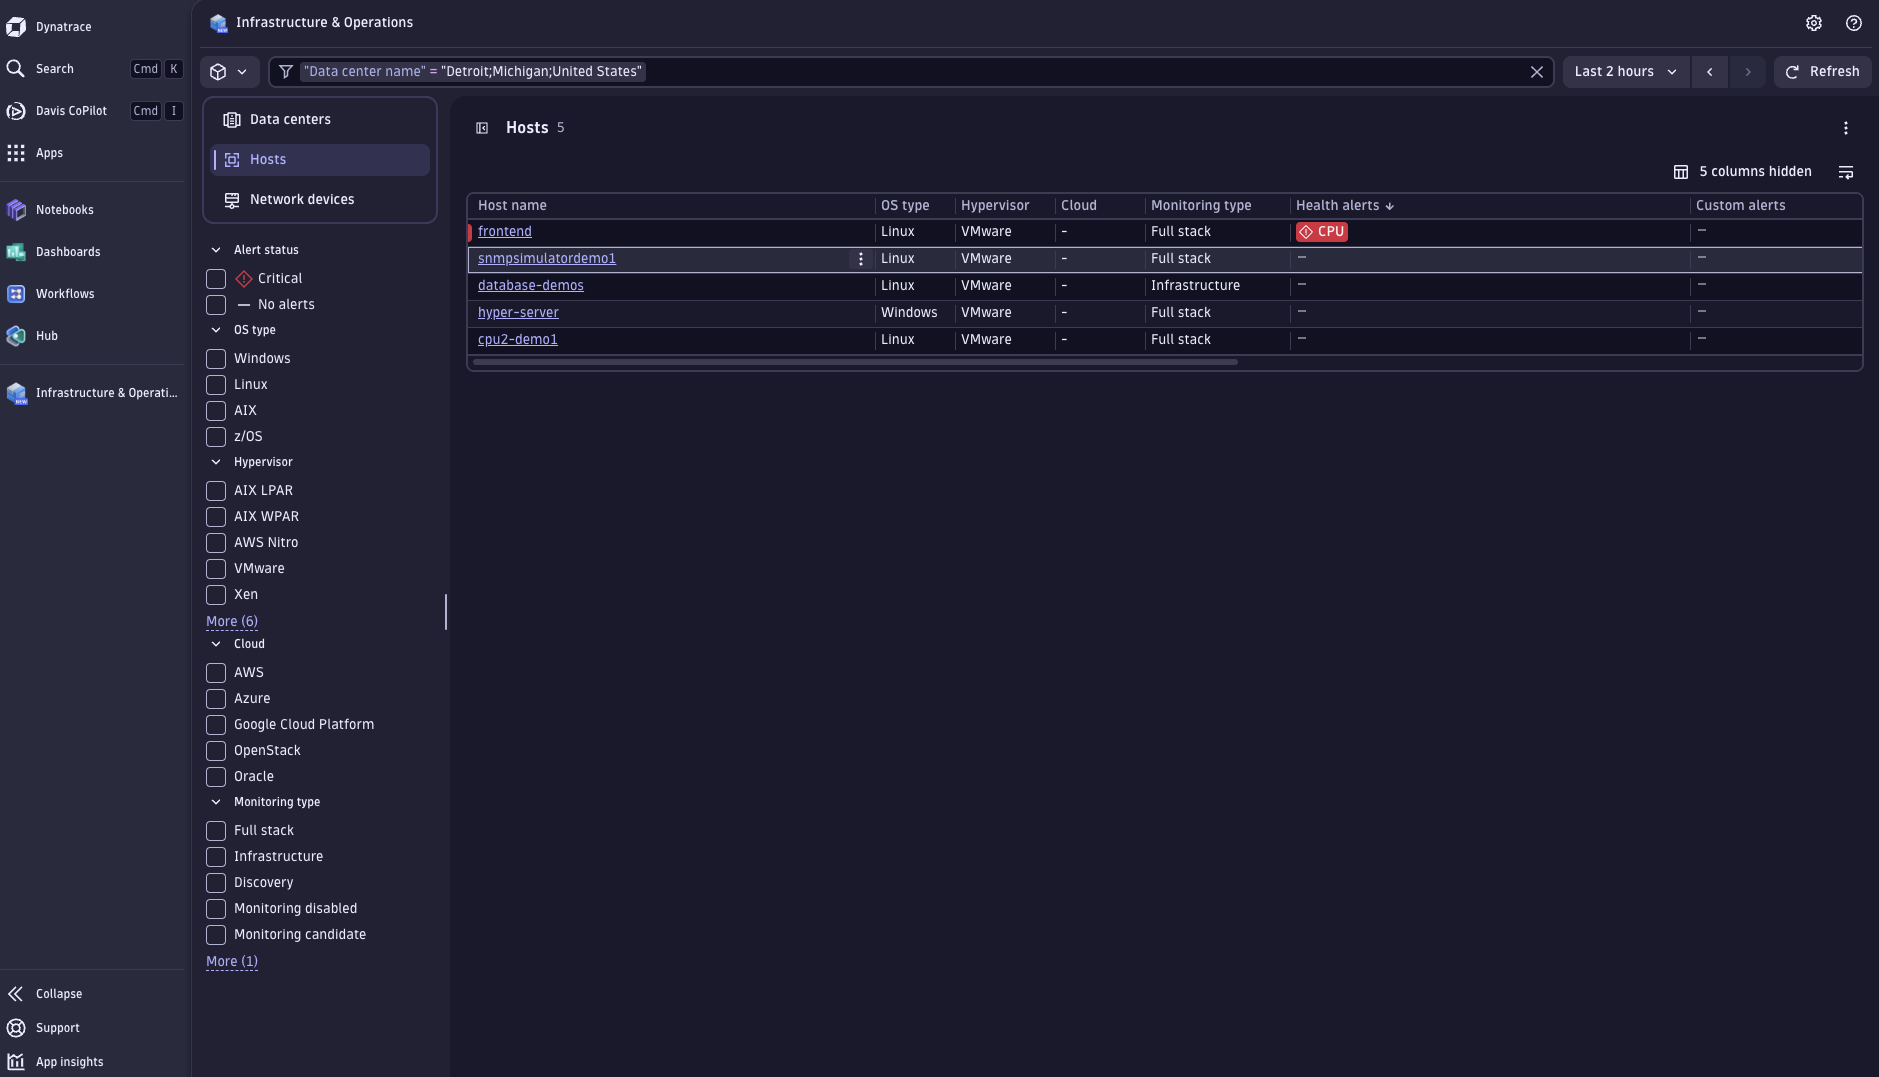
Access details of entities
-
Go to
Infrastructure & Operations and select Hosts, Containers, Processes, or Network devices. -
Select an entity from the list. You can sort and filter the list as needed.
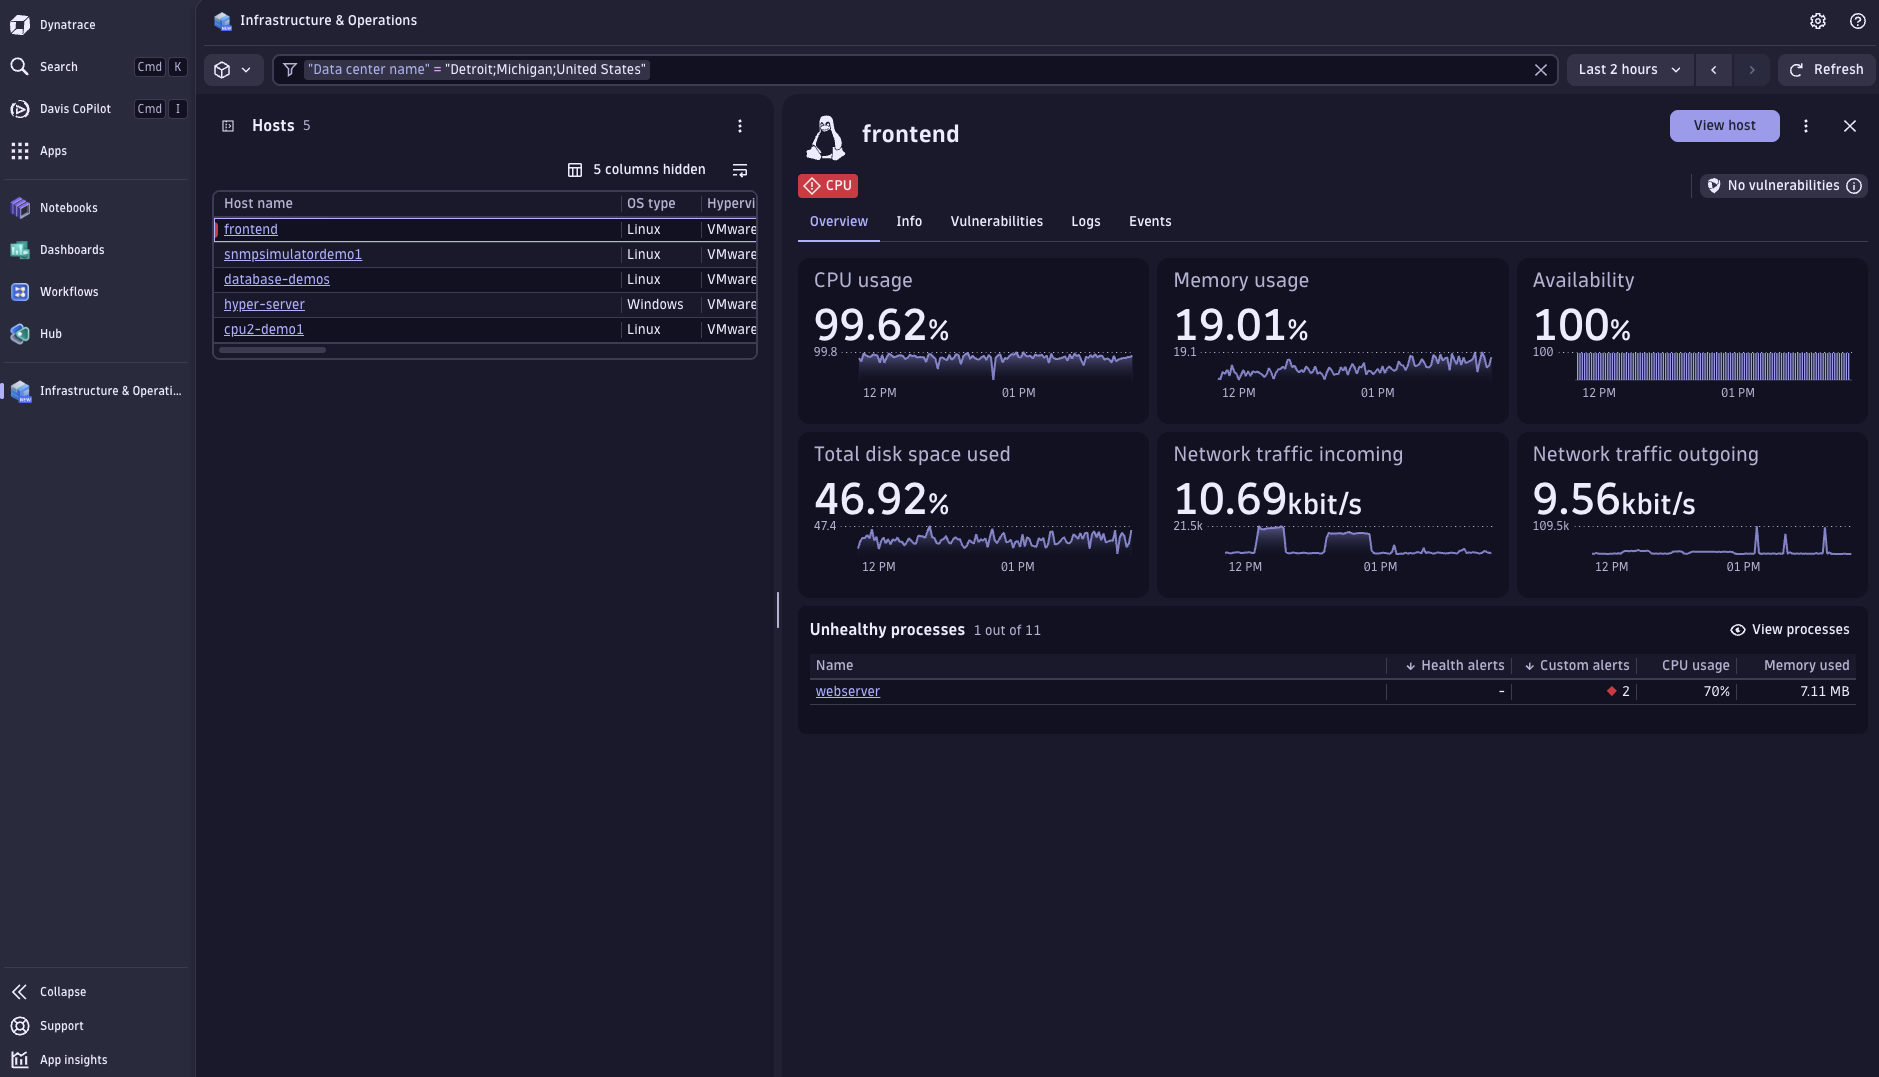
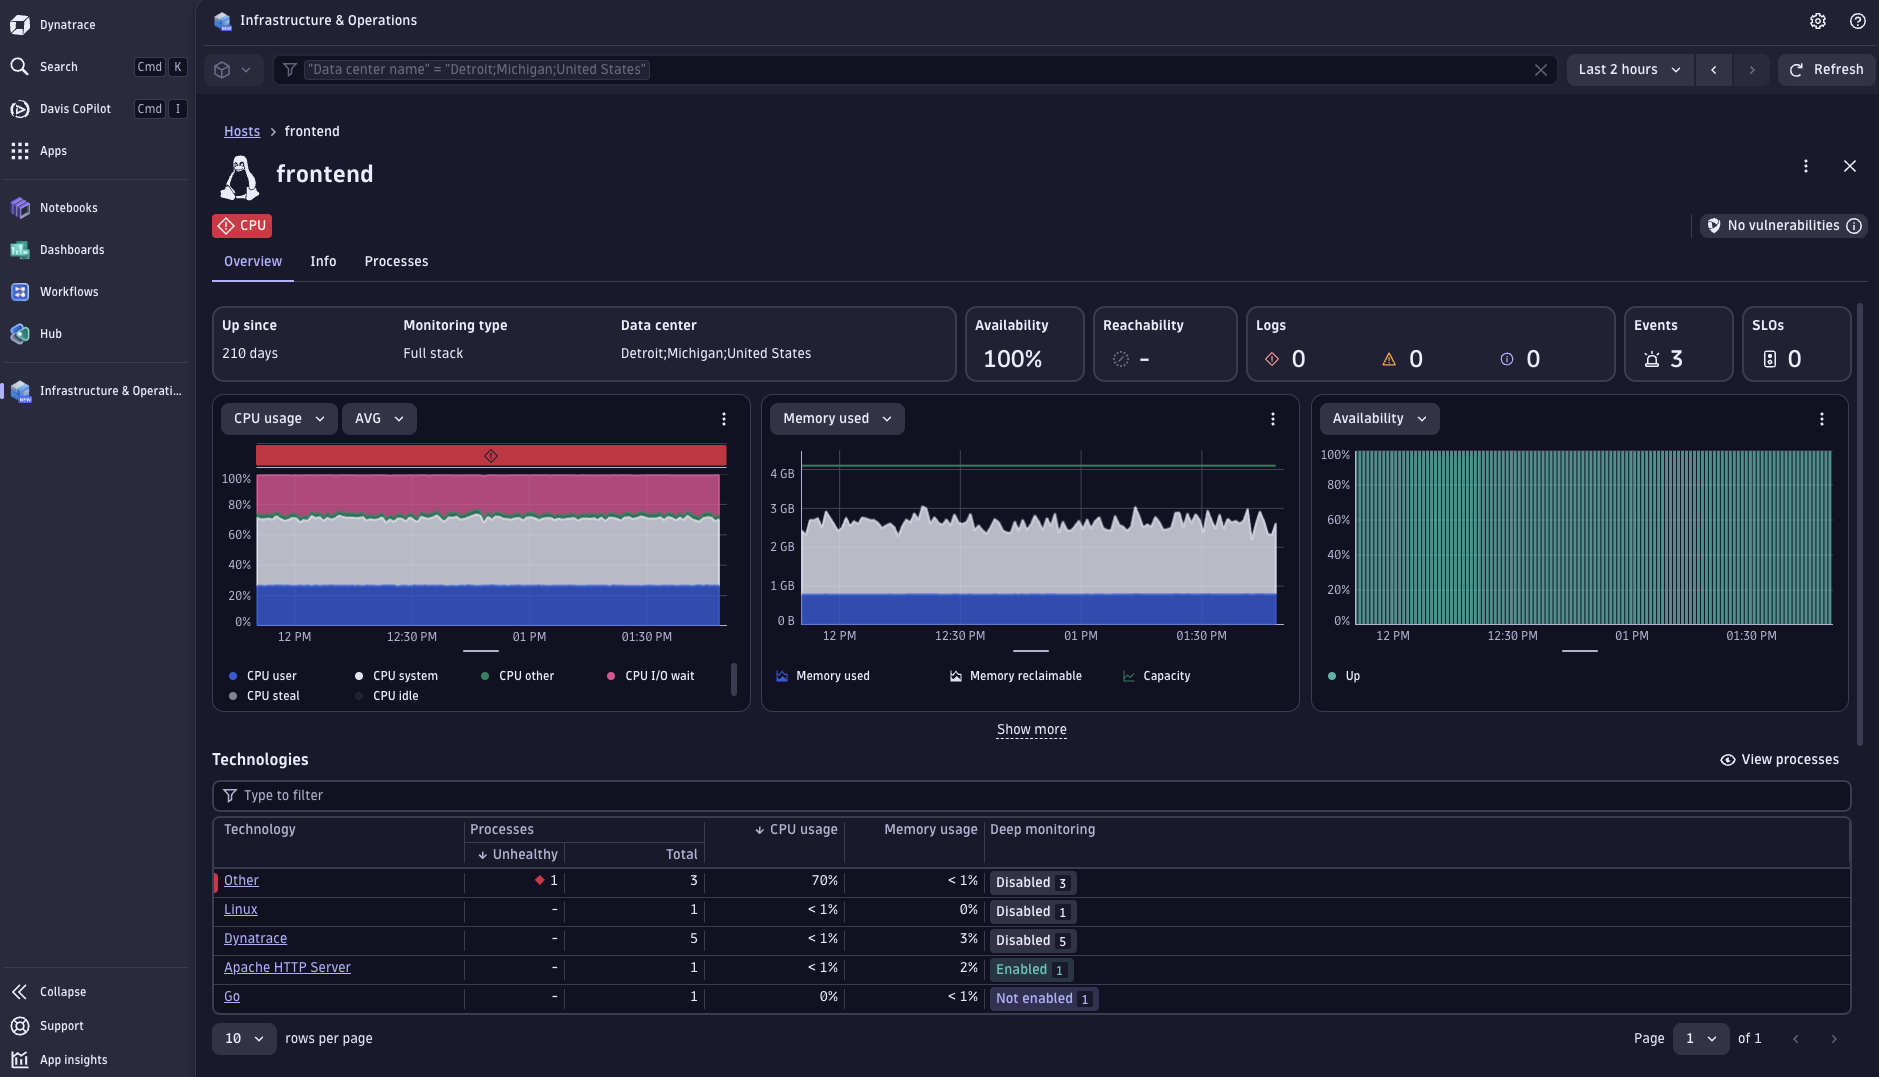
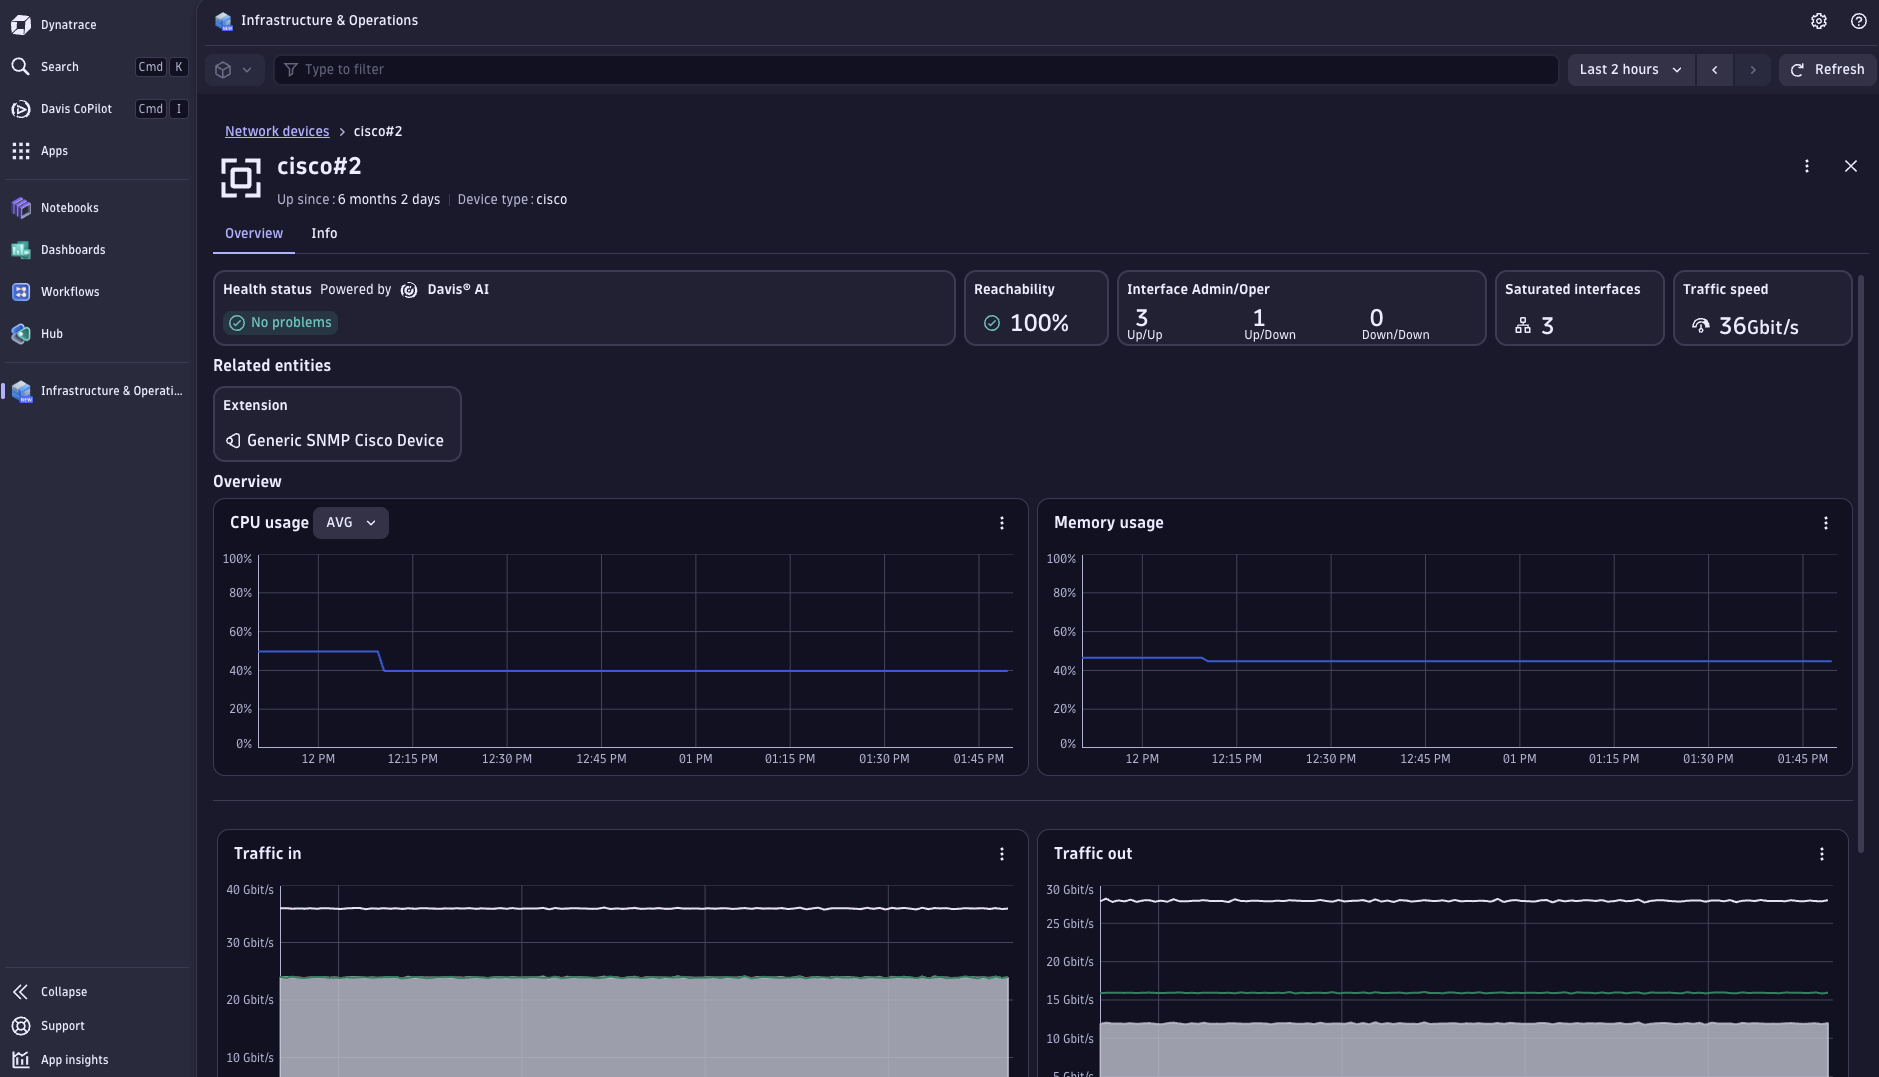
Analyze overview charts
You can define which metrics are displayed in the charts by selecting  in the upper left corner of each graph or chart.
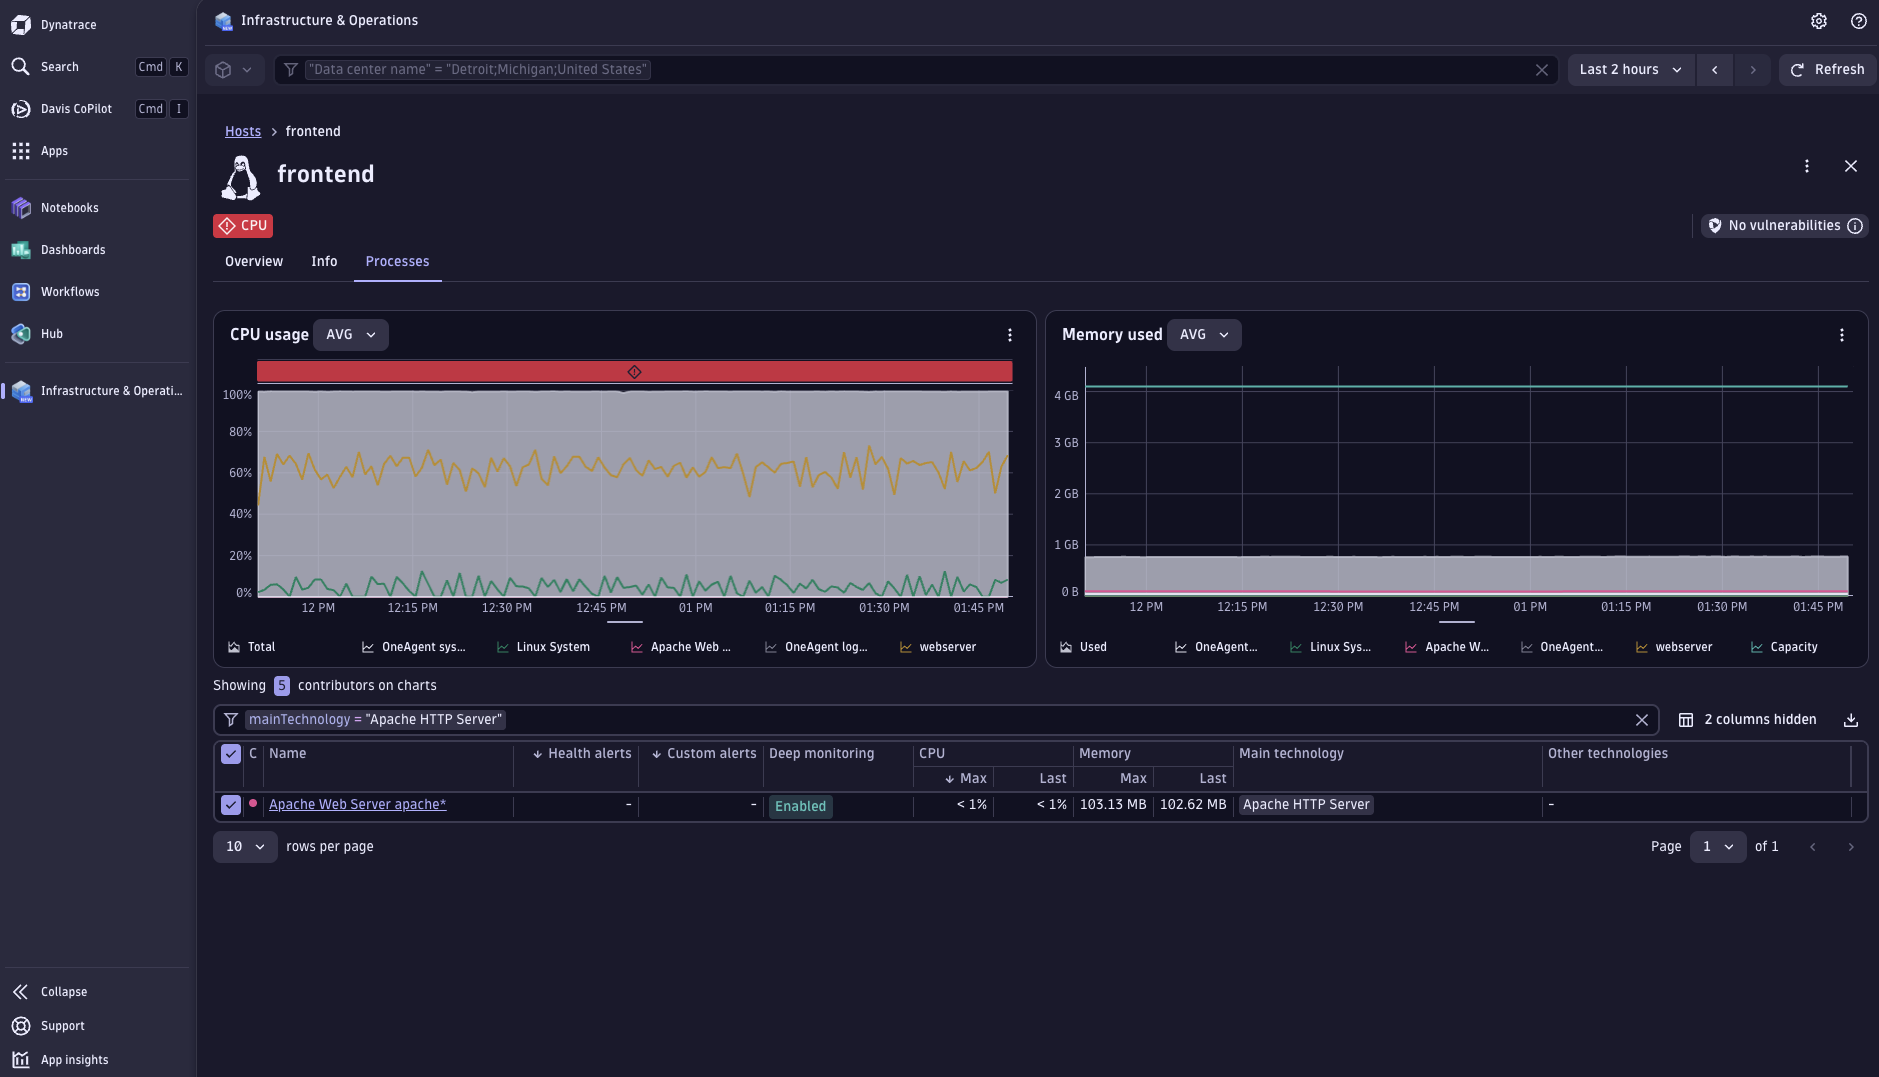
View host processes
The Processes tab in the host full-page view displays the CPU usage and Memory usage charts with a table showing 5 contributors.
To view processes on a host
-
Open the full-page view of a host.
-
Select the Processes tab.
The CPU usage and Memory usage charts display with a table showing 5 contributors. Change the contributors by selecting other metrics, such as health alerts, custom warnings, and CPU usage.
To view all processes across your environment, switch to the Processes inventory.
Note that processes can run directly on hosts or in containers running on hosts.
Display code-module metrics
You can inject code modules and display the injected data in the app. For more details, see Universal injection of code modules.
After selecting a process from the list, the data is presented in a dedicated tab.
Monitor incoming and outgoing connections
In the full-page view of a host, under Connections, you can see a quick overview of each type of connection, the total number of connected entities, and the number of problems. Expand the panel to see a list of connected entities and possible problems for each of them. You can also see which processes from the current host communicate with other processes or services that aren't part of the host.
The Connections table allows you to identify potential sources of problems that don't happen directly on the host. Select the connected entity marked with to navigate to its details page and investigate the issue.
The incoming and outgoing process connections in the table display processes with the most issues based on network and CPU usage.
Measure the reachability of a host or device
The Reachability column on the Hosts and Network devices pages shows how easily you can access a device or a host over the network from a remote location. For more details, see Synthetic Monitoring Classic.
The value presents the ratio of fully available Network Availability Monitors (NAM) (with 100% availability over the selected time period) to all configured monitors for the given host or network device.
To use this feature, you need to configure NAM for the desired device or host. For details, refer to Configure a NAM monitor in Classic.
View health alerts and warning signals
In Infrastructure & Operations, you can view health alerts and warning signals.
Health alerts and warning signals help you monitor your infrastructure by providing clear, actionable insights. These features reduce the noise from infrastructure issues and improve alerting capabilities, so you can focus on what matters most. This is achieved through better categorization of detected malfunctions.
- For critical events, a Health alert is raised, triggering a Dynatrace Problems investigation.
- For non-critical situations, a Warning signal informs you of a potential challenge.
For details, see Health alerts and warning signals.
To take advantage of this feature in Infrastructure & Operations, you need to enable it. Once enabled, certain alerts that were previously classified as critical will be reclassified as warnings, as they are not considered critical enough to require immediate attention.
To enable this option
- Go to
 Settings.
 - Select Analyze and alert > Alerts.
- Under Category update, select Ready-made alerts category update.
- Enable Updated classification for select ready-made alerts.
Once you enable the option, these alerts will be converted to warnings:
| Entity type | Event type1 | Description |
|---|---|---|
HOST | OSI_HIGH_CPU | CPU Usage |
HOST | OSI_NIC_DROPPED_PACKETS_HIGH | High rate of dropped packets |
HOST | RESOURCE_CONTENTION | Slow disk |
PROCESS | PROCESS_RESTART | Process restart |
Once converted into warnings, the events with the event.type listed here, will be marked as event.type = WARNING. Their former value is removed.
Explore alert templates
Infrastructure & Operations version 1.25+
Network device alerting in Infrastructure & Operations covers hardware condition, reachability, and operational conditions. In a well-engineered network with redundancy, most issues surface as warning signals rather than health alerts, helping you maintain redundancy before it affects service.
Use the Alert templates tab to deploy ready-made templates for network devices and hosts.
Templates are available in two variants:
- New: Create alerts from new Smartscape templates to make them visible in the Explorer Preview tab and track the health of your infrastructure with the latest features.
- Classic: Alerts appear only on the classic Explorer tab.
Permissions
To create alerts from templates, you need the following permissions:
settings:objects:readandsettings:objects:writeforbuiltin:anomaly.detection.alerts-category-updatesettings:objects:writewith environment scope forbuiltin:davis.anomaly-detectors
Create a new alert from a template
To create a new alert, select New alert for the chosen alert template and follow the steps to create a custom alert.
After you create the new alert, you can open it in  Anomaly Detection by selecting
  Open in Anomaly Detection. Or, select Continue to return to the list of alert templates.
To get an overview of all alerts, select Manage all alerts.
Network device alerts
The following network device ready-made alert events are available:
| Alert | Dimensions | Data | Details |
|---|---|---|---|
Interface saturation | Device, interface | Interface bytes in/out and interface speed | Maximum inbound or outbound utilization exceeds 0.95 for three of the five one-minute samples. |
Interface traffic low | Device, interface | Interface bytes in/out, admin status, operational status | For admin-up and oper-up interfaces, traffic drops to 10% or less of the recent baseline, with baseline at least 10,000 bps and drop at least 5,000 bps. |
Interface CRC high rate | Device, interface | Inbound CRC errors divided by inbound broadcast, unicast, and multicast packets | Ratio exceeds 1 * 10-6. |
Interface packet drop high rate | Device, interface | Inbound or outbound discards divided by the respective broadcast, unicast, and multicast packets | Ratio exceeds 0.01. |
Interface packet errors high rate | Device, interface | Inbound and outbound packet errors | Error rate exceeds 0 errors per second. |
Interface operationally going down | Device, interface | Interface status | Administratively up interface is operationally down. |
Interface flapping | Device, interface |
| Interface state-change signal is detected in 3 samples within a 15-minute sliding window. |
Network reachability degraded | Network device | Network Availability monitor availability | Reachability drops below 100% for monitors mapped to the network device by IPs. |
Host alerts
The following ready-made health alert is available for host reachability:
| Alert | Dimensions | Data | Details |
|---|---|---|---|
Network reachability degraded | Host, network interface | Network Availability monitor availability | Reachability drops below 100% for monitors mapped to a host interface by IPs. |
View data from imported technologies
Infrastructure & Operations detects installed extensions and displays them in the left navigation menu. Extensions are organized by category, making it easy to explore and analyze your technology stack.
To view installed technologies
- Go to Infrastructure & Operations
- Select an extension category from the navigation menu list to view the extension inventory table.
- Select an extension from the inventory table to view its details page.
For details on setting up extensions, see Extensions.
Minimum required versions of extensions
Ensure your system has these minimum versions of the installed extensions to avoid any issues with displaying the data in Infrastructure & Operations.
This list concerns extensions for supporting network devices and is not exhaustive. Each network device can have more extensions.
| Extension | Minimum version |
|---|---|
SNMP Autodiscovery | 2.2.8 |
Generic Cisco Device | 2.1.4 |
F5 BIG-IP | 2.10.0 |
Palo Alto firewalls | 2.7.0 |
Juniper Networks (SNMP) | 1.5.0 |
Generic network device | 2.0.0 |
Fortigate | 1.2.21 |
For details on how to make your custom extensions appear in Infrastructure & Operations, see our Network topology guide.
Concepts
Infrastructure & Operations has the following core components:
Hosts
Monitor infrastructure hosts across physical machines, VMs, and cloud instances to track health, performance, and resource utilization.
Containers
Monitor and troubleshoot containerized workloads across Kubernetes and standalone hosts.
Processes
Monitor processes running on hosts and containers with detailed insights into CPU and memory usage trends and key metrics.
Network devices
Monitor network devices and gain insights into networking components with Dynatrace Intelligence-powered analytics and flexible observability options.
Relation between hosts, containers, and processes
Hosts, containers, and processes are interconnected, and you can navigate between them to understand dependencies and troubleshoot issues.
Hosts
- The host full-page view includes Processes and Containers tabs showing related processes and containers. Select an entity to navigate to its details.
Containers
- Containers run on hosts. The container metadata displays the host name.
- The container full-page view includes an Overview tab with links to the host and container group. Selecting the host navigates to the host details. Selecting the container group filters the container list to show all containers in that group.
- The Processes tab shows related processes. Select a process to navigate to its details.
Processes
- Processes run directly on hosts or in containers. The process metadata displays the related host and container name (if applicable).
- The process side panel shows information about technologies, host, process group, container (if applicable), and deep monitoring details.
- The process full-page view includes an Overview tab with links to the host, process group, and container (if applicable). Selecting the host navigates to the host details. Selecting the process group filters the process list to show all processes in that group. Selecting the container navigates to the container details.
Use cases
- View and identify the status of hosts and network devices.
- Quickly identify the root cause of infrastructure problems
- Gain awareness of infrastructure performance and optimize it
- Quickly see host health and identify problematic hosts, network devices, technologies, processes, disks, containers, and networks
- See infrastructure host health metrics, logs, and events for all infrastructure entities
- See network devices health metrics, traps, and events.
- Assess the network reachability of hosts and network devices by integrating with synthetic Network Availability Monitors (NAM).
FAQ
What if I don't have Dynatrace Platform Subscription (DPS) or I'm not on the SaaS platform powered by Grail?
You won't be able to access the new Infrastructure Observability experience. You can continue to use the Dynatrace classic pages, for example, the Hosts Classic page (Latest Dynatrace) / Hosts page (Dynatrace Classic). The existing product remains supported, but switching to the new platform is recommended, as it gives you access to the latest features.
What if I do have DPS but lack the Infrastructure Observability Platform Monitoring capability?
If you already use DPS, contact your Dynatrace representative to add pricing for Application and Infrastructure Observability to your rate card. If you signed your DPS contract after February 2024, this capability is included on your rate card by default. For details, see Manage your costs.
Can I still use the Hosts Classic pages when using the Infrastructure Observability experience?
Yes, classic pages such as Hosts Classic and Technologies & Processes Classic (Latest Dynatrace) / Hosts and Technologies & Processes (Dynatrace Classic) can be used alongside the new experience, displaying data for your hosts, processes, and containers. However, in some Dynatrace environments, classic applications are no longer available.
Do I need to change anything to my OneAgent deployments to use the new Infrastructure Observability experience?
No. The new experience doesn't require changes to your OneAgent deployments. We recommend keeping OneAgent up to date. Note that OneAgent version 1.337+ is required to use Smartscape on Grail.
What permissions do I need to access the Infrastructure Observability experience?
You need a set of permissions to read and access relevant data from Grail to use Infrastructure & Operations. The new Explorer view requires additional permissions. For details, see Permissions.
To view Smartscape entity visualizations from extensions, the following permissions are required:
| Permission | Description |
|---|---|
| Read UA documents from Documents API |
| Resolve node type when not provided to the provider |
| Allow any storage bucket in conditions context |
| Read extension monitoring configurations for document conditions |
Why do I see two Explorer views in Infrastructure & Operations?
A new Explorer view based on the new Dynatrace storage layer, Smartscape on Grail, is now available. The Explorer Classic view is deprecated and shown for backward compatibility for environments that don't meet the OneAgent version 1.337+ requirement for Smartscape.
Why don't I see all data in the new Explorer view?
If you don't see all data in the new Explorer view, verify that you meet the prerequisites and have no issues with permissions or policy boundaries.
- OneAgent version 1.337+ is required.
- Required permissions are met, for example,
storage:smartscape:read. For details, see Permissions. - Extensions are upgraded to a version that supports Smartscape.
Where can I see data from extensions in the new Explorer view?
Data from extensions is shown in Infrastructure & Operations. If you see data in Explorer Classic but not in the new Explorer, the extension is outdated and must be updated. To support the new Grail storage, each extension was released with an updated major version.
Where are my monitoring states?
The new Smartscape process entity model doesn't support process monitoring states. Support for this data is not currently planned.
Where are my monitoring candidates?
Monitoring candidates concept is not supported. You can use  Discovery & Coverage to discover and manage your OneAgent deployments.
 Infrastructure & OperationsInfrastructure Observability