Release validation
- Latest Dynatrace
- Tutorial
- 6-min read
- Published Feb 01, 2024
Business-critical services require a thorough validation before deploying to production as potential faults have a negative impact on overall productivity.
The flexibility of various Dynatrace tools can help you to optimize your delivery process. The main building blocks are:
- Site Reliability Guardian—A Dynatrace app that automates release validation to check a newly deployed version's service availability, performance, capacity, and security objectives.
- Workflows—A Dynatrace app in which a series of actions are assembled to build processes in a graphical representation. Those workflows can automatically be triggered by events in Dynatrace, either on a schedule or manually.
Introduction
Manual release validation is a big effort that decreases your team's capacity, slows down your deployment cycles, and decreases your potential deployment frequency.
This means it can take weeks for a commit reach production and drives your teams away from opportunities to innovate quickly.
With AutomationEngine and business events on Grail, you can automate the validation of the release process, speed up your deployment and improve the quality at the same time. Since the build is automated and only runs when all checks are green, it automatically raises quality standards and helps you avoid fixing issues in the hardening stage.
Scenario
In the test pipeline, all security, end-to-end, and performance tests emit Business Events that capture the test results. DQL queries are executed during the promotion to validate whether all required tests have been successfully executed and performance as well as security objectives are met.
In addition, SLOs are used to ensure that the services are not degrading over time and still meet the targets set by the team.
The following steps use business events to implement the release validation use case. This approach is valid for now, but we plan a new event kind for events occurring during the software development lifecycle of a software component. This new event kind will replace business events in the future.
Steps
-
Set up your CI/CD tool
Your Continous Integration (CI) or Continuous Delivery (CD), for example, Jenkins, can send business events to Dynatrace. These events can then trigger Site Reliability Guardian validations in a workflow.
You can create a helper like in the example below for your pipeline to post business events to business events API.
Show me code
#!groovy/*** Sends biz_event to a given Dynatrace environment.* @param monitoringTenant url to monitoring environment* @param oauthClientId OAuth client id* @param oauthClientSecret OAuth client secret* @param payload biz_event payload* @return*/def call(def monitoringTenant,def oauthClientId,def oauthClientSecret,def payload) {// Get Access Token via OAuth - see https://developer.dynatrace.com/develop/access-platform-apis-from-outside/ for referencedef ssoResponse = sh(script: """set +xcurl --location --request POST 'https://sso.dynatrace.com/sso/oauth2/token' \\--header 'Content-Type: application/x-www-form-urlencoded' \\--data-urlencode 'grant_type=client_credentials' \\--data-urlencode 'client_id=${oauthClientId}' \\--data-urlencode 'client_secret=${oauthClientSecret}' \\--data-urlencode 'scope=storage:events:write'set -x""", returnStdout: true).trim()// Note: readJSON needs pipeline-utility-steps -> https://www.jenkins.io/doc/pipeline/steps/pipeline-utility-steps/#readjson-read-json-from-files-in-the-workspacedef ssoResponseJSON = readJSON(text: ssoResponse)if (ssoResponseJSON.errorCode) {error(message: "Authentication failed: ${ssoResponse}")}def accessToken = ssoResponseJSON.access_token// Ingest BizEventprintln("Sending BizEvent: ${payload}")sh(script: """set +xcurl --location --request POST '${monitoringTenant}/platform/classic/environment-api/v2/bizevents/ingest' \\--header 'Content-Type: application/json' \\--header 'Authorization: Bearer ${accessToken}' \\--data-raw '${payload}'set -x""")} -
Send a business event to Dynatrace
If you want to filter the Site Reliability Guardian validation events based on the source trigger, the created business events must contain context information from the software version you are validating. The context information can be carried by a version number, a build number, Git commit, or any parameter that lets you identify the software to validate.
To propagate the execution context, the event triggering a workflow execution must contain the
execution_contextfield, as in the example below.{"timeframe.to": "2023-03-08T06:29:08.809Z","timeframe.from": "2023-03-08T05:29:08.809Z","event.id": "d08a70d8-f6de-4d0d-bd34-5d416a20ba6a","timestamp": 1678256963078000000,"event.kind": "BIZ_EVENT","event.type": "guardian.validation.triggered","stage": "hardening","event.provider": "Jenkins","dt.system.bucket": "default_bizevents_short""execution_context": {"buildId": "4711","version": "0.1.0"}The execution context is propagated to the guardian validation business event. The
guardian.validation.started,guardian.validation.finished, andguardian.validation.objectiveevents contain the propagatedexecution_contextfield. -
Create a guardian
After you send the business event to Dynatrace, Grail will store all the related data and your guardian will be able to query the results, validate it against your objectives and save the result in Grail.
Here's an example of a guardian with a set of objectives.
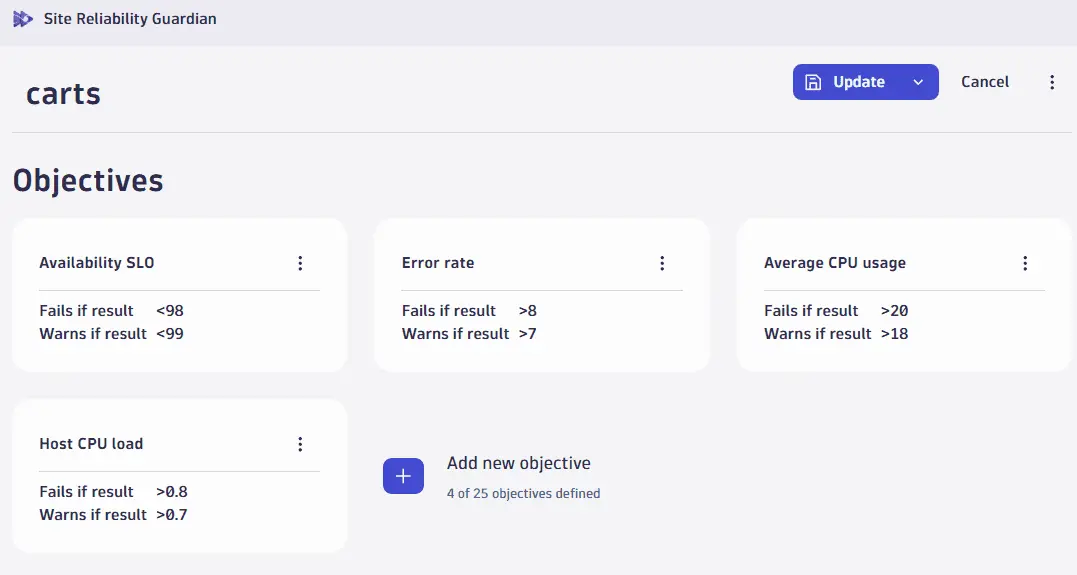
For more information, see Create a Site Reliability guardian.
-
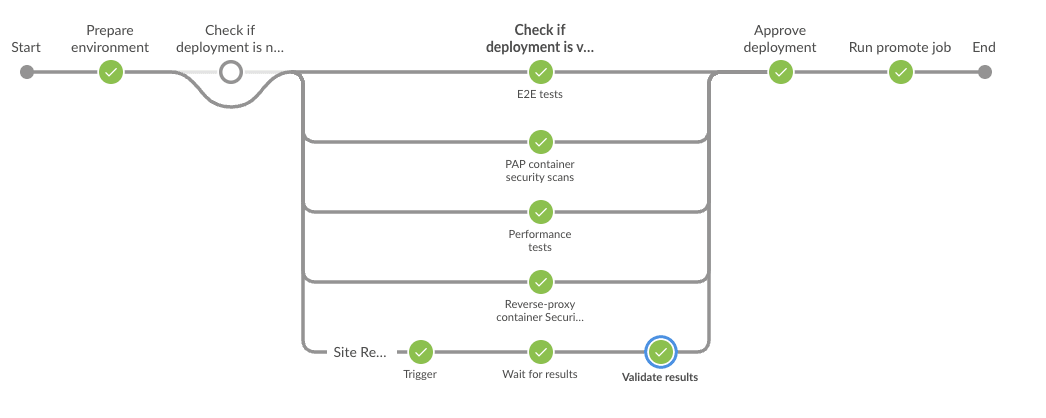
Create a workflow
Now that you have all the data in place, you can create a workflow that will validate your test results using the guardian workflow action.
-
The workflow is triggered on your pipeline, sending the business event. For that, you need to use the event trigger. For example, you can trigger the workflow with the following filter query
((event.type == "guardian.validation.triggered") and stage == "dev") -
Create the next workflow step using the guardian workflow action. The action should point to the guardian you created earlier. The action will execute the guardian and its results will be stored in Grail, which enables your pipeline to query the data and decide whether it should proceed to the next step.
Show me the template
metadata:version: "1"dependencies:apps:- id: dynatrace.site.reliability.guardianversion: ^1.8.1inputs:- type: connectionschema: app:dynatrace.site.reliability.guardian:guardianstargets:- tmy-object.objectIdworkflow:title: Pipeline validationtasks:trigger:name: validation-guardiandescription: Automation action to start a Site Reliability Guardian validationaction: dynatrace.site.reliability.guardian:validate-guardian-actioninput:objectId: ""executionId: "{{ execution().id }}"expressionTo: '{{ event()["timeframe.to"] }}'expressionFrom: '{{ event()["timeframe.from"] }}'timeframeSelector:to: nowfrom: now-2htimeframeInputType: expressionposition:x: 0y: 1predecessors: []description: ""trigger:eventTrigger:filterQuery: >((event.type == "guardian.validation.triggered") and stage == "dev")isActive: trueuniqueExpression: nulltriggerConfiguration:type: eventvalue:query: >((event.type == "guardian.validation.triggered") and stage == "dev")eventType: bizeventsschemaVersion: 3 -
-
Validate results
Your pipeline has now sent all the necessary data to Grail and triggered the workflow to execute your guardian. The guardian results are now ready to be fetched and validate whether your build is ready for promotion. You'll do it again by fetching the data from the guardian-created business events. For example:
query: fetch bizevents, from:now() - 5m, to:now()| filter event.type == "guardian.validation.finished"| filter event.provider == "dynatrace.site.reliability.guardian"| filter guardian.name == "validation-guardian"| filter matchesPhrase(execution_context, "1.286.0.0.20240129-160934")| sort timestamp desclimit 1 ,"timezone": "Europe/Warsaw", "enablePreview": true -
If your pipeline is successful, you can now trigger another workflow sending a notification to your team member, who can approve the promotion. To do that, you can use one of Workflows Connectors like Slack, Microsoft Teams, or Jira.
Here's an example of a successful Jenkins build performing the tests explained above.
 Site Reliability Guardian
 Workflows