Exception analysis
- Explanation
- 4-min read
The Exceptions overview view is a diagnostics feature that enables you to see which exceptions occurred in your environment during the selected timeframe and within the selected management zone.
To access the Exceptions overview analysis page
- Go to Multidimensional Analysis.
- Select the Exception analysis tile.

Configure view
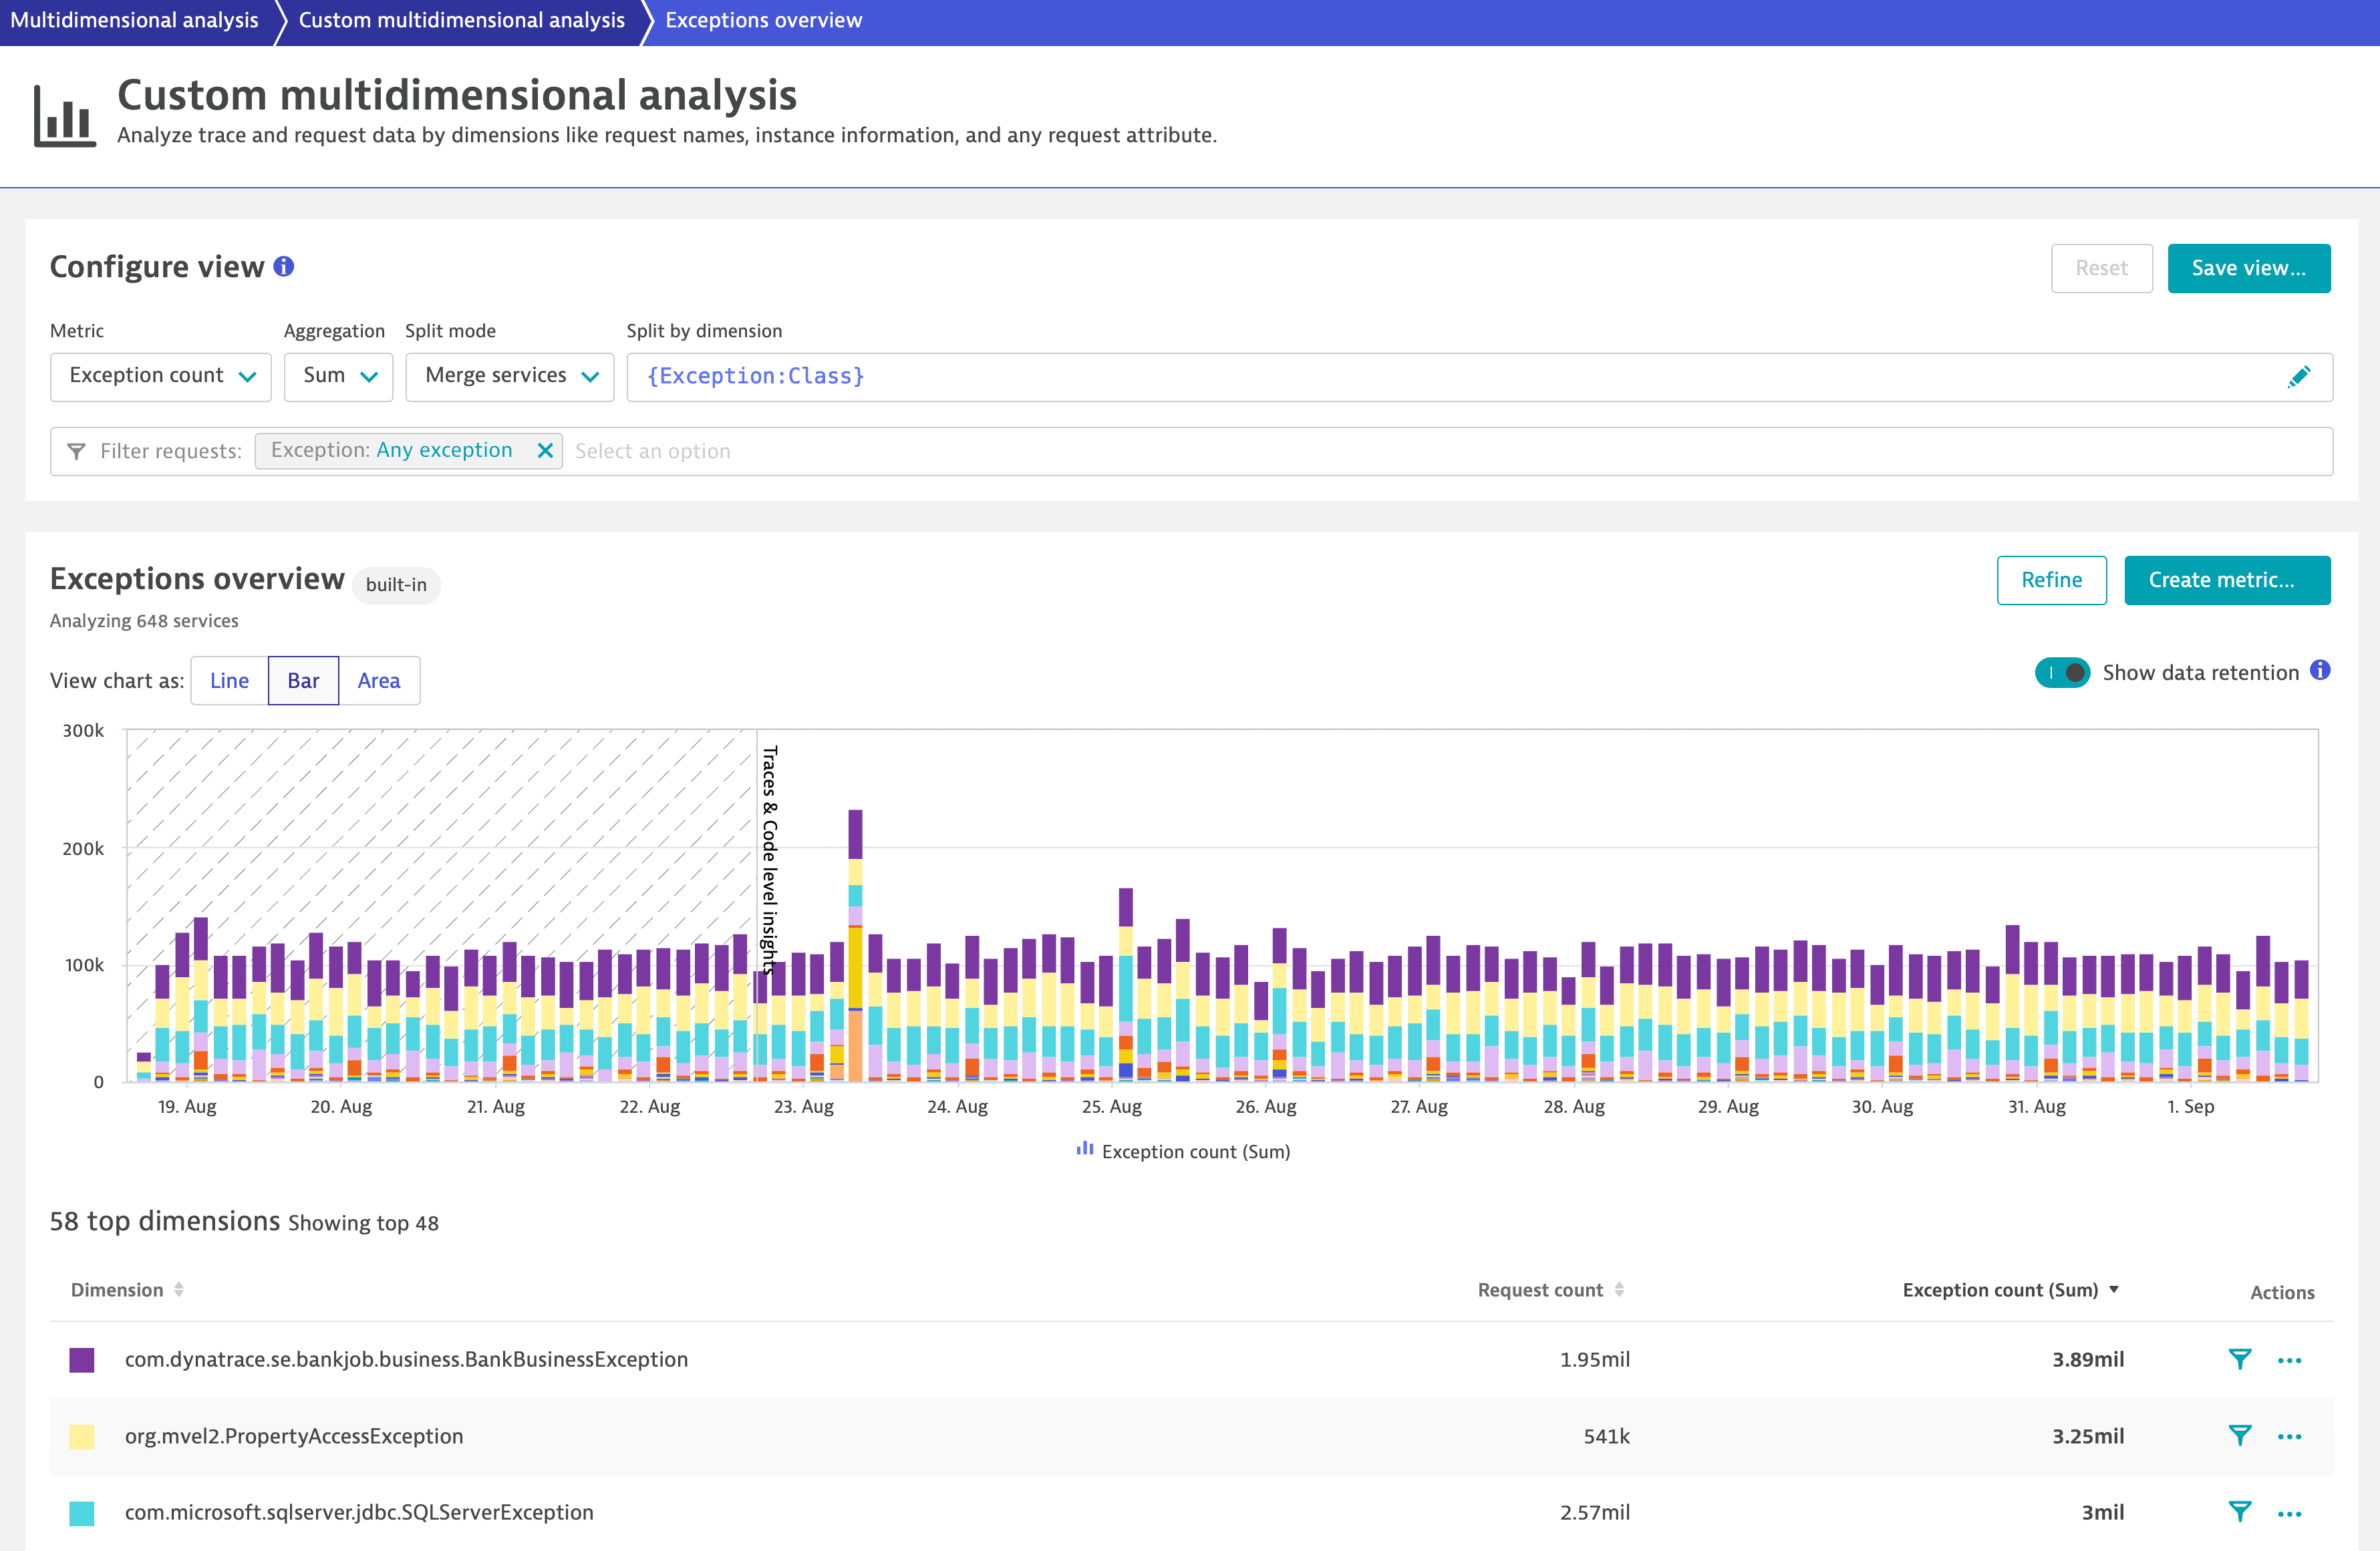
The Exceptions overview page lists all exceptions that occurred during the selected timeframe and within the selected management zone. In Configure view, you can set up multiple filtering capabilities. The view updates automatically as you change the parameters.
Parameter
Description
Metric
The metric to be analyzed. By default set to Exception count.
Aggregation
How the metric values are aggregated. Available aggregations depend on the selected metric.
Split mode
How dimensions specified in Split by dimension are treated.
- Split by services—each dimension is displayed separately for each service.
- Merge by services—same dimensions from different services are merged into one.
Split by dimension
A list of dimensions by which the requests are split. By default the exception class ({Exception:Class}) dimension is set.
You can specify several dimensions. Place your cursor in the input field to see the available options. The requests are split by dimension in the specified order.
Filter requests
Filter the requests to be included to the view. By default the following criterion is set:
- Exception:
Any exception
You can provide additional criteria. Place your cursor in the input field to see the available options.
Criteria of the same type are grouped by the OR logic. Criteria of different types are grouped by the AND logic.
Once the view is configured, you can save it for quick access in the future. Just select Save view and provide a name.
You can also save the configuration as a calculated service metric and use it as any other metric in Dynatrace (for example, for alerting).
You can export the table data in a comma-separated values (CSV) file.
-
In the lower-right corner of the page, select Show export menu
.

-
Select Export visible data or Export table data.
Option
Exported data
Fields
Number of entries
Export visible data
The currently displayed area of the table, taking into account applied filters
Only visible data
Up to 100 top dimensions
Export table data
All table data
All the available data related to top dimensions
Up to 100 top dimensions
View
-
The chart shows the top 15 dimensions (all other dimensions are aggregated into a single dimension) and the table beneath contains up to 85 more dimensions, bringing the total number of chartable dimensions to 100. The view instantly adapts to the changes you make in the Configure view pane.
In the Actions column of the table, you can select:
- Filter
to filter the view for the specified dimension.
- More (…) to access further analysis options from the Analyze menu.
- Filter
-
The chart uses trace and request data, which has different data retention periods. For timeframes containing data older than 10 days, you can turn on the Show data retention toggle to better understand which data is available for which period directly from the chart.
Exception details
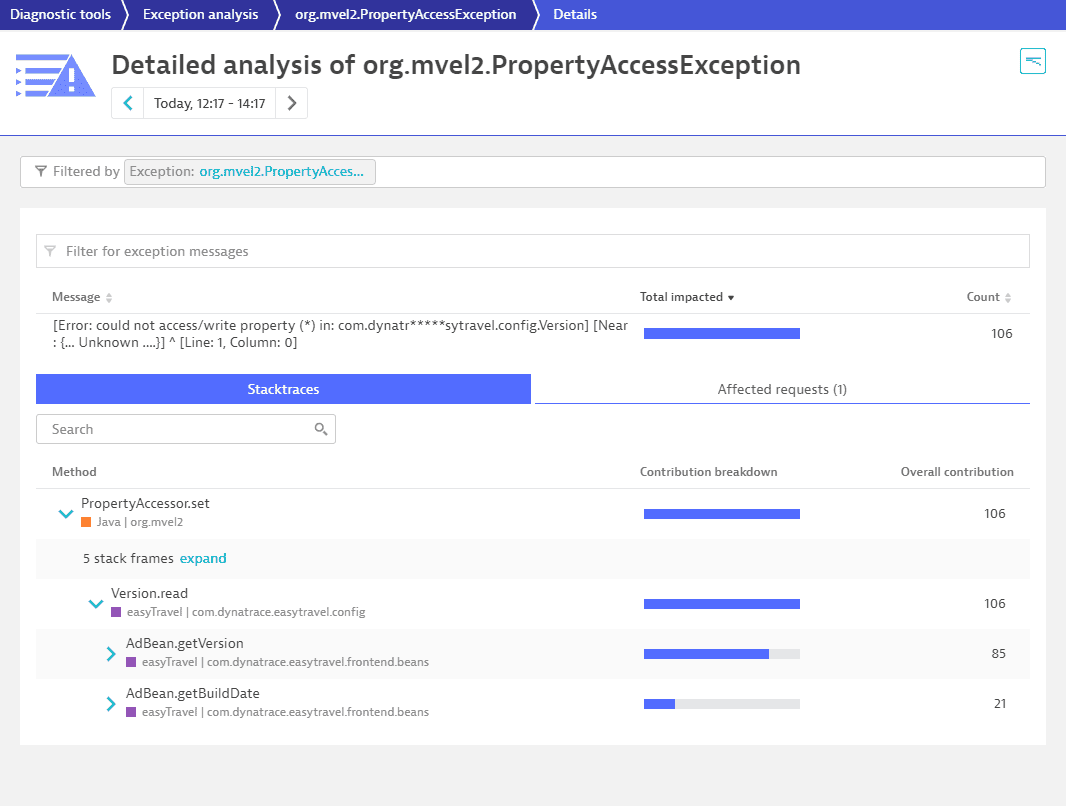
The Exception details page helps you to understand how the exception affects your digital environment. To access it, select Exception details from the actions menu of the exception you want to explore.

The page provides an overview of exception messages; a code-level stacktrace, where you can dig into your code up to the method that had thrown the exception; and requests that are affected by the exception. Select the exception message to filter the stacktrace and affected requests to the selected exception message.
You can further narrow down the scope of analysis by applying filters. Place your cursor in the Filtered by field to see the available options. The quick way to filter by a specific request is to open the Affected request tab and select the filter button of the required request.
Example use cases
Here you can find some use cases for the Exception analysis view.
Look for a specific exception
With Exception analysis view you can focus your analysis on a specific class of exception. Just find the exception you need in the table and select the filter button .
If you're interested in a rare exception that is unavailable in the table, you can still find it by the exception class.
You must provide the exact class of the exception, as the filter uses the EQUALS operator.
- Open the Exceptions overview analysis page and, if needed, set additional filters.
- In the Filter requests field, remove the Exception:
Any exceptioncriterion. - Add the Exception criterion type again and paste the exception class as a value.
The view displays data on the selected exception only.
Find affected services
You can view the exception data as an aggregated value across all services or separately for each service. With that option you can easily see which services are affected by a certain exception.
- Filter the view to the required exception as described above.
- From the Split mode list, select Split by services.
The view displays data on the selected exception only split by service. From here on you can dig deeper into Exception details or further analysis options on the service you're interested in.
Related topics
 Multidimensional Analysis