Manage third-party vulnerabilities
- Dynatrace Classic
- Explanation
This page refers to the classic  Third-Party Vulnerabilities app, which is deprecated. If you're currently using this app, we recommend transitioning to the corresponding
  Vulnerabilities in the latest Dynatrace experience, which offers enhanced functionality and ongoing support. For details, see Vulnerabilities upgrade guide.
A third-party vulnerability is a security problem detected in the third-party libraries loaded in your environment. After you enable and configure Dynatrace Runtime Vulnerability Analytics, Dynatrace starts monitoring your applications to detect vulnerabilities in third-party libraries.
Third-party vulnerabilities list
To see a list of all detected third-party vulnerabilities in your environment, go to Third-Party Vulnerabilities.
The following information is displayed.
General overview of the key features

The numeric values displayed are management-zone aware.
- The number of open vulnerabilities (and the muted ones). Select it to display the vulnerabilities filtered by
Status: Open. - The number of critical and high vulnerabilities. Select it to display the open vulnerabilities filtered by
Risk level: CriticalorRisk level: High. - The number of monitored technologies out of the total number of supported technologies. Select Monitored technologies to view and edit your settings.
- A visual representation of each technology.
Davis Security Advisor
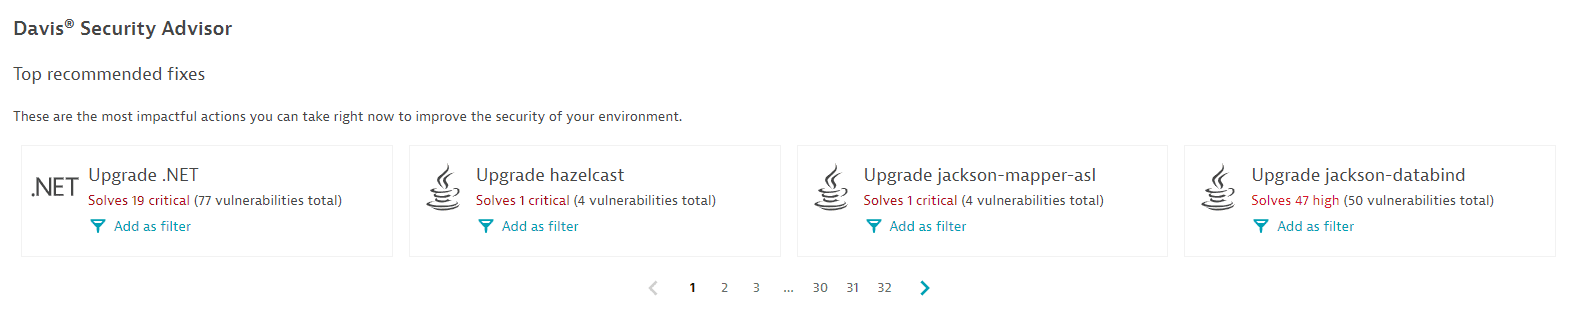
The Davis Security Advisor recommends the fixes that would most improve the overall security of your environment. For details, see Davis Security Advisor calculations.
Vulnerabilities detected
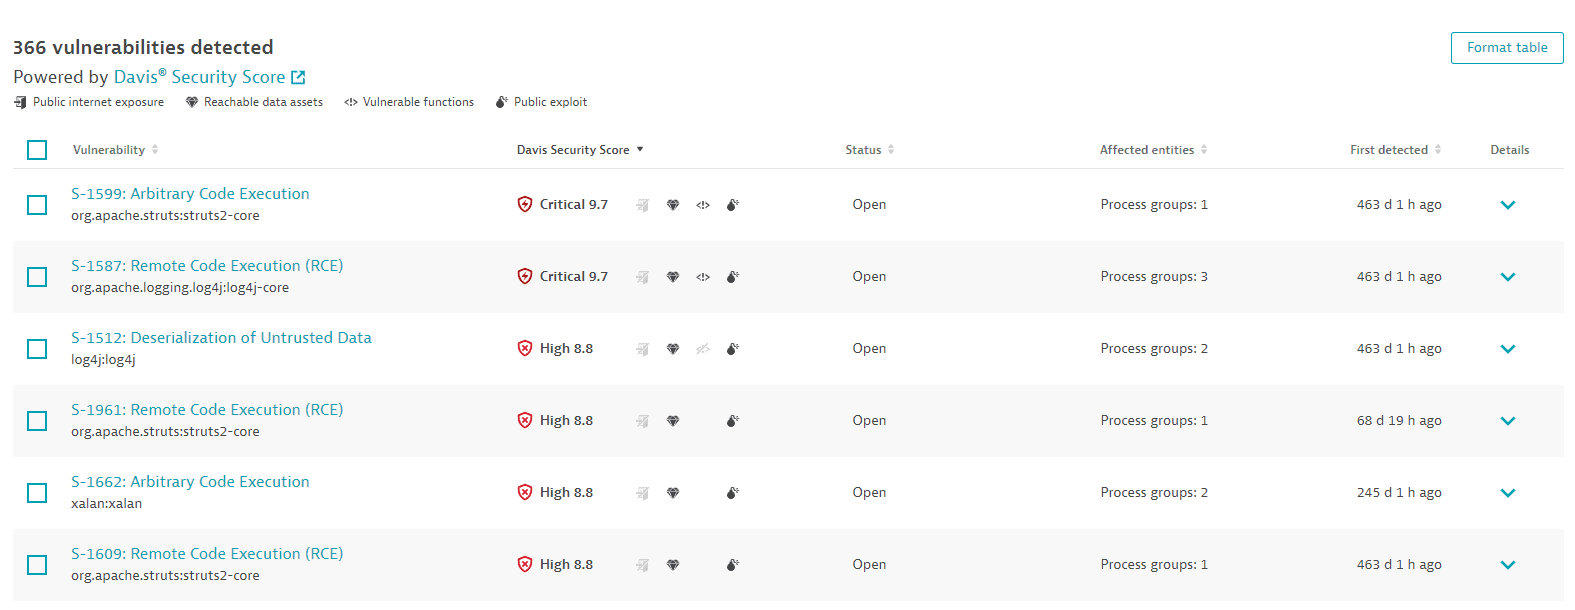
A list of all detected third-party vulnerabilities in your environment. For optimized performance, a maximum of 500 vulnerabilities are displayed at a time. You can narrow down the results by applying filters. To sort the list by any item, select the corresponding column heading. To add or remove column headings, select Format table.
Vulnerability
-
The vulnerability ID provided by Dynatrace (example:
S-3440) -
Depending on the vulnerability feed:
-
For Dynatrace Vulnerability feed, the high level name of the vulnerability (example:
Denial of Service (DoS) in XYZ) -
For NVD vulnerabilities, the CVE ID (example:
CVE-2020-2805), or the CWE name, if available (example:Deserialization of Untrusted Data)- One vulnerability in Dynatrace can have multiple CVEs (for example, if different vendors release their own CVEs).
- There can be different vulnerabilities for one component (library).
- One security problem can generate multiple Dynatrace vulnerabilities, one for each affected technology.
-
-
The vulnerable component (the software component (library) or runtime component (for example, a Kubernetes package) that has a vulnerable function causing a vulnerability):
- For vulnerabilities based on the Dynatrace Vulnerability feed, the package name (example:
org.apache.tomcat:tomcat-coyote) - For NVD-based vulnerabilities, the runtime technology (examples:
Java runtime,Node.js runtime)
- For vulnerabilities based on the Dynatrace Vulnerability feed, the package name (example:
To find out how Dynatrace evaluates components, see How vulnerabilities are evaluated: Third-party vulnerabilities.
Davis Security Score
-
The Davis Security Score risk level (
Critical,High,Medium,Low,None) of the vulnerability, based on the Common Vulnerability Scoring System (CVSS) score of the vulnerability and AI-enhanced to take public internet exposure and reachable data assets into consideration. If a vulnerability has been resolved, the symbol color is green. -
The overall risk assessment (the final score).
-
If there is any public internet exposure (the vulnerability affects at least one process that is exposed to the internet). To find out how Dynatrace determines public internet exposure, see FAQ: How is public internet exposure determined?. If the symbol is grayed out and crossed out, no public internet exposure was found. If the symbol isn't present, no data is available.
-
If there are any reachable data assets (the vulnerability affects a process that has database access, based on the Dynatrace entity model (Smartscape)). If the symbol is grayed out and crossed out, there are no reachable data assets within range. If the symbol isn't present, no data is available.
-
If there is any vulnerable function in use by a process, which allows the vulnerability to be exploited. If the symbol is grayed out and crossed out, there's no vulnerable function in use. If the symbol isn't present, no data is available.
-
If there is any public exploit (a known malicious code that exploits this vulnerability). If the symbol is grayed out and crossed out, there's no public exploit. If the symbol isn't present, no data is available.
CVSS score
The base CVSS score of the vulnerability. This column is hidden by default and can be enabled via Format table.
Status
-
Open: The vulnerability is active.
-
Resolved: The vulnerability has been closed automatically because the root cause (for example, loading a vulnerable library) is no longer present. For more information, see Vulnerability evaluation: Resolution.
-
Muted - Open: The vulnerability is active but has been silenced by request.
-
Muted - Resolved: The silenced active vulnerability has been closed automatically because the root cause (for example, loading a vulnerable library) is no longer present.
A muted vulnerability that has been closed automatically doesn't change its status to
Resolved, but toMuted - Resolved.
Affected entities
The entities (process groups, Kubernetes nodes) that are affected by the identified third-party vulnerability.
Technology
The technology of the process affected by the vulnerability.
To display this column, select Format table and add Technology to the list.
First detected
When Dynatrace first detected the third-party vulnerability.
Last update
Timestamp of the last status change of the third-party vulnerability. A status change can be when:
- The vulnerability is resolved or reopened
- The vulnerability is muted or unmuted
- The number of affected process groups has decreased or increased
- The risk assessment has changed
- The Davis Security Score has changed
- A new software component is detected
For details, see FAQ: What does "last update" refer to?.
To display this column, select Format table and add Last update to the list.
Details
Expand ![]() vulnerability rows for details, or to perform the following actions:
vulnerability rows for details, or to perform the following actions:
- Select Change status to mute, unmute, or mute again a vulnerability with a different reason or comment.
- Select View process group overview to navigate to the overview page of the process groups related to a vulnerability.
- Select View vulnerability details to navigate to the details page of a vulnerability.
Third-party vulnerability details
To see details about a third-party vulnerability, go to Third-Party Vulnerabilities and select a vulnerability.
The following information is displayed.
Vulnerability title
-
Software components use the Dynatrace Vulnerability feed. In this case, the vulnerability title displays the vulnerability name and ID, the
third-party vulnerabilityattribute, and when the vulnerability was first detected. -
Runtime components use the NVD feed. In this case, the vulnerability title displays one of the following.
- The CWE name and CVE ID, the
runtime vulnerabilityattribute, and when the vulnerability was first detected. - The CVE ID, the
runtime vulnerabilityattribute, and when the vulnerability was first detected.
Kubernetes runtime components are an exception—they use the Dynatrace Vulnerability feed. For details, see Third-party vulnerability feeds.
- The CWE name and CVE ID, the
Shortcut to main topics
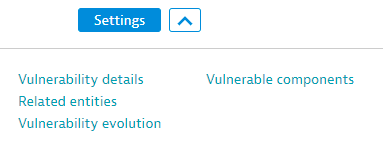
Expand the button next to Settings on the upper-left side of the vulnerability details page to select one of the topics below.
- Vulnerability details
- Related entities
- Vulnerability evolution
- Vulnerable components
Select Settings to navigate to Vulnerability Analytics: General settings. For details, see Get started with Vulnerability Analytics.
Infographic of the key features
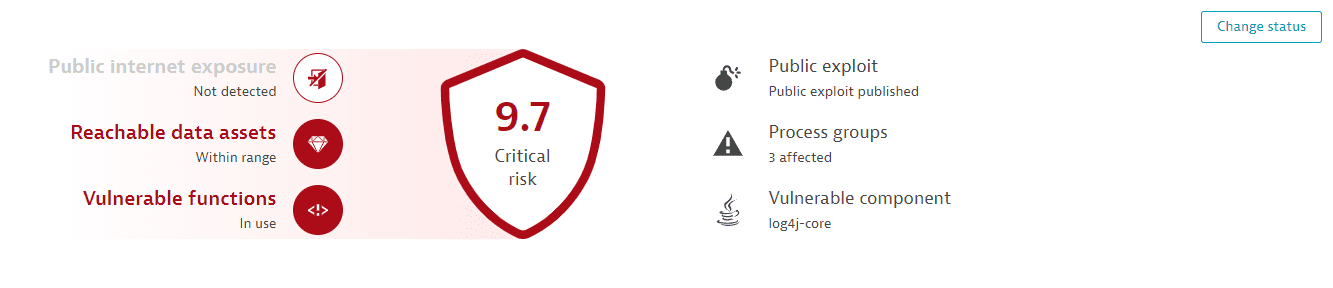
Select any of these features to jump to the corresponding section on the page.
-
Risk level: Davis Security Score risk level (
Critical,High,Medium,Low,None). -
Public internet exposure: If there's any public internet exposure. Possible states are:
- Public network: There is public internet exposure.
- Not detected: No public internet exposure was found.
- Not available: Data isn't available, because the related hosts are running in Infrastructure Monitoring mode. For details, see Monitoring modes.
-
Reachable data assets: If there are any reachable data assets affected. Possible states are:
- Within range: There are reachable data assets affected.
- None within range: There are no reachable data assets within range.
- Not available: Data isn't available, because the related hosts are running in Infrastructure Monitoring mode. For details, see Monitoring modes.
-
Vulnerable functions: If there are any vulnerable functions in use. Possible states are:
- In use: There are vulnerable functions in use.
- Not in use: No vulnerable functions in use were found.
- Not available: Data isn't available. For a list of potential reasons, see FAQ.
-
Exploit: If there's any malicious code that exploits the third-party vulnerability. Possible states are:
- Public exploit published: A publicly known exploit for this vulnerability is available.
- No public exploit published: No publicly known exploit for this vulnerability is available.
-
Process groups: How many process groups are affected
-
Vulnerable component: The name of the vulnerable component
If you want to change the status of a vulnerability, select Change status in the upper-right corner of the page.
Vulnerability details
- The name and description of the affected package (example:
com.fasterxml.jackson.core:jackson-databind), the associated technology (example:Java), and links to the Dynatrace/CVE/CWE/OWASP IDs for further information.
Fix recommendation
For vulnerabilities based on the Dynatrace Vulnerability feed, a fix recommendation is displayed. It consists of a library upgrade suggestion to solve the vulnerability.
Make sure to restart processes after upgrading a library.
Vulnerable functions
The exact classes (example: com.fasterxml.jackson.databind.jsontype.impl.SubTypeValidator) and functions (example: validateSubType) causing the vulnerability, and the affected process groups based on the function usage.
This section is not displayed
- If no vulnerable function information is provided by the Dynatrace security research team.
- For runtime vulnerabilities, which are based on the NVD feed.
Function usage shows whether the vulnerable function is being used by your application. Based on whether your application uses the vulnerable function, you can assess the impact on your environment. The usage of a vulnerable function is calculated on the process level and is aggregated to the process group level, which results in a count of affected process groups per function.
-
In use: A count of the related process groups that are affected by the vulnerability (use at least one vulnerable function). Select the number of affected process groups to navigate to remediation tracking.
-
Not in use: A count of related process groups that don't use any vulnerable function.
-
Not available: A count of related process groups for which the vulnerable function usage could not be determined. For a list of potential reasons, see FAQ.
The information is based on management zones, not on the timeframe.
How it works
-
If the Dynatrace security research team provides information about the vulnerable function, and OneAgent monitoring for Java vulnerable functions is enabled, OneAgent determines whether the vulnerable function is in use.
Example:
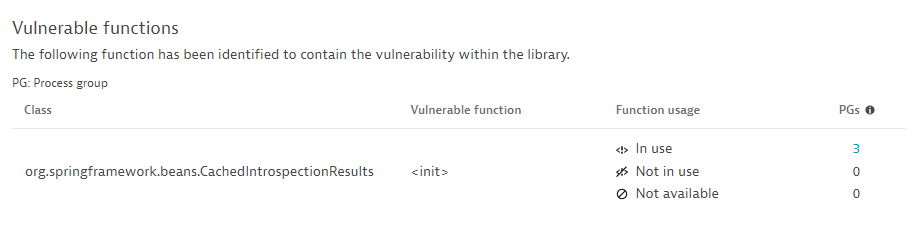 usage-oa-enabled
 -
If the Dynatrace security research team provides information about the vulnerable function, but the OneAgent feature is disabled, the number of vulnerable functions is displayed as Not available.
Example:
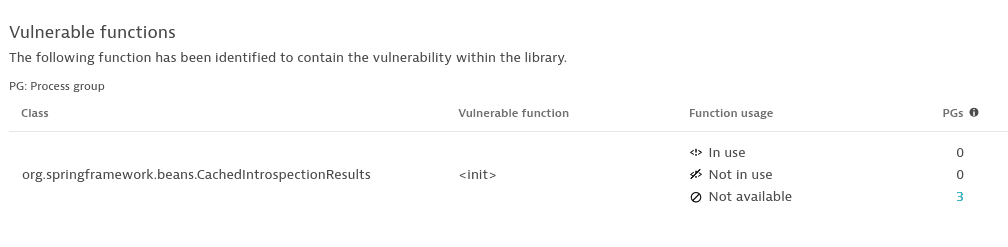 usage-oa-disabled
For instructions on how to enable OneAgent monitoring, see Enable OneAgent monitoring for Java vulnerable functions.
If information about vulnerable functions is outdated, you are prompted to restart processes so that OneAgent can pick up and use the new data. The following message is displayed: Restart required: Restart the process(es) for updated vulnerable function data.
Example:
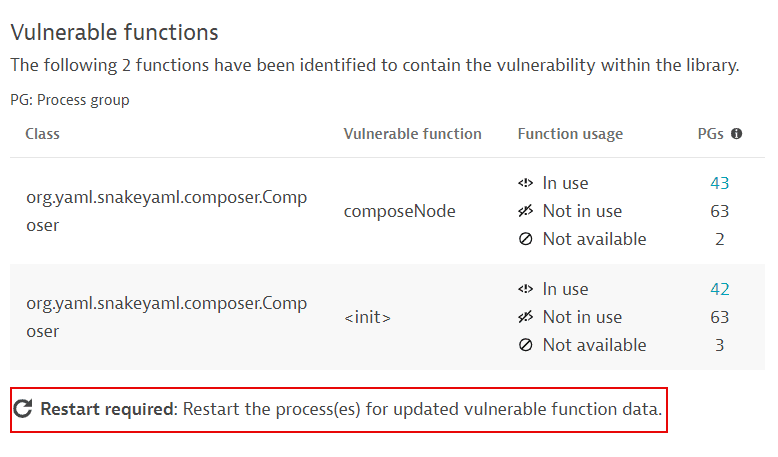
For more information, such as how determine which processes you need to restart, see FAQ: How can I know if information about vulnerable functions is outdated and what can I do about it?.
Davis Security Score
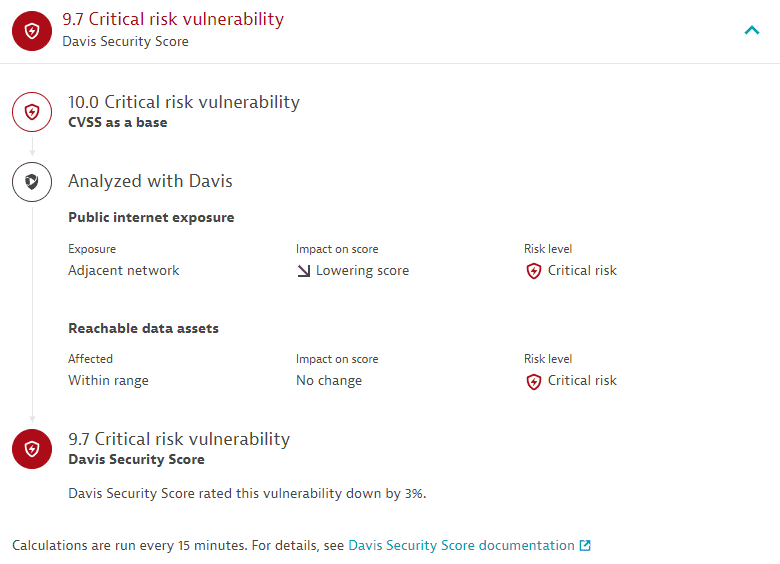
A detailed view of how the Davis Security Score for the opened vulnerability is calculated: starting from the CVSS from the Dynatrace Vulnerability feed, Davis checks whether there is public internet exposure or reachable data affected and, if so, to what extent. The score is then adjusted as applicable based on the Davis AI calculations.
Reachable data assets
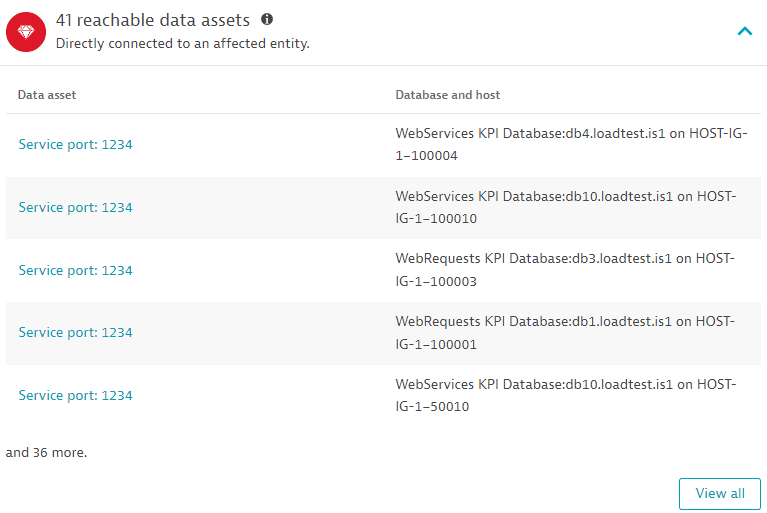
The last five database services accessed by affected processes containing the identified vulnerability, based on the last hour. Select View all to navigate to Databases. For information on how to monitor your database performance, see Database Services Classic.
Vulnerability evolution
Use case: Have a better understanding of the evolution of a vulnerability over time.
The Vulnerability evolution section displays the following information.
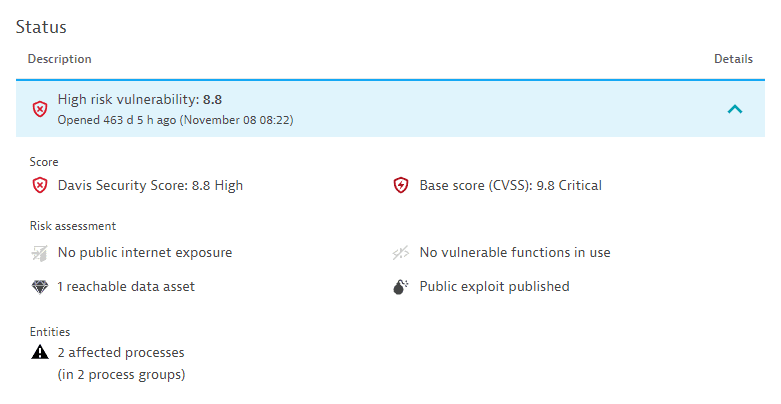
Status
The current status of the vulnerability.
-
For open vulnerabilities:
- The current risk level and score (for example,
Critical risk vulnerability: 10.0) and the time when the vulnerability was open (for example,Opened 121 d 22 h ago (December 12 14:38)). - The Davis Security Score compared to the base score (CVSS).
- The current risk assessment (for example,
Public internet exposure detected). - The number of affected processes (for example,
1 affected process (in 168 process groups)) or, in the case of Kubernetes vulnerabilities, of affected nodes (for example,1 affected node).
Example:
 Example status
 - The current risk level and score (for example,
-
For resolved vulnerabilities, the current status and the time when the vulnerability was resolved.
Example:
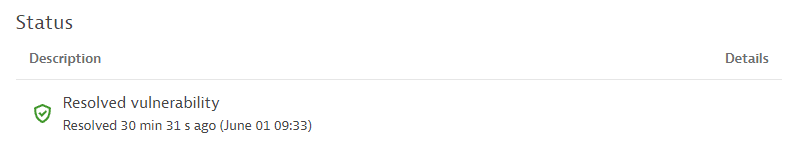 Vulnerability evolution - Status for resolved vunerabilities
Latest events
The last 10 vulnerability status changes over the last 365 days.
If there are no status change events for over 365 days, this section is empty.
Possible status change events:
-
A vulnerability is open, resolved or reopened. Displays the status change and the time when the change happened. For reopened vulnerabilities, select Details to see the risk assessment.
Example events:
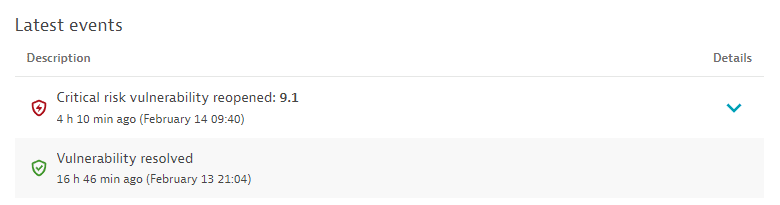 Event change: Vulnerability resolved and reopened
 -
A vulnerability is muted or unmuted. Displays the user who performed the change, the reason for the change, any comments, and the time when the change was performed.
Example event:
 Vulnerability status event change
 -
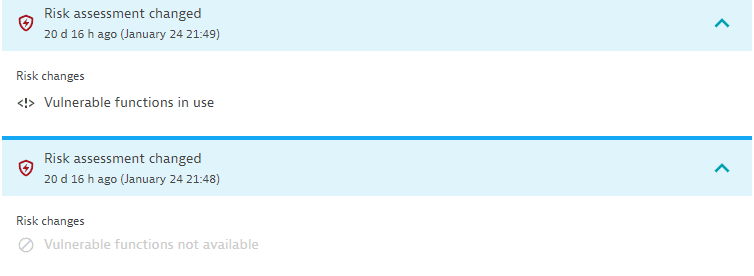
The vulnerability risk assessment has changed. Displays the time when the change happened. Select Details to see the risk change. You can find out, for example, when a vulnerability that used to be exposed to the public internet is no longer exposed.
Example event:
 Risk assessment change event
 -
The number of affected process groups or nodes, in the case of Kubernetes vulnerabilities, increased or decreased. Displays the number by which the affected process groups or nodes increased or decreased, the total number of affected process groups or nodes resulting from this change, and the time when this change happened. You can find out, for example, if you need to take action (if the number of affected entities is increasing) or if the vulnerability is being fixed (if the number of affected entities is decreasing).
Example events for Kubernetes vulnerabilities:
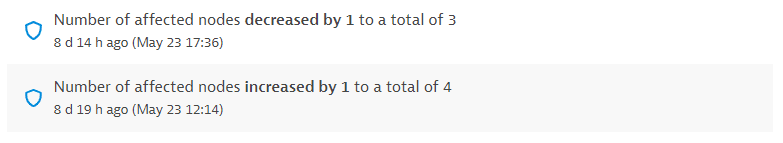 Event change in the number of nodes
Example events for non-Kubernetes vulnerabilities:
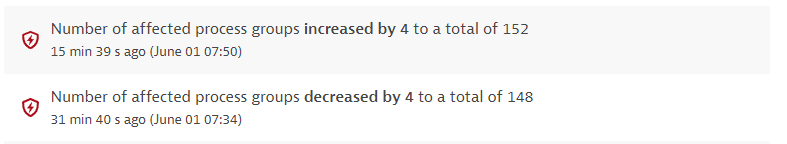 Event change in the number of process groups
 -
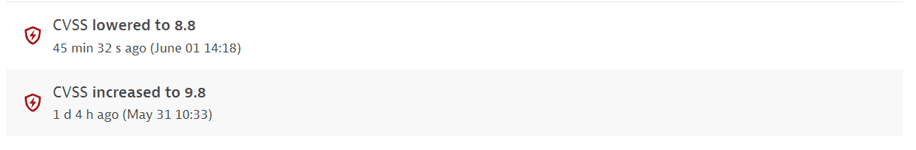
Davis Security Score increased or lowered. Displays the new value and the time when this change happened.
Example event:
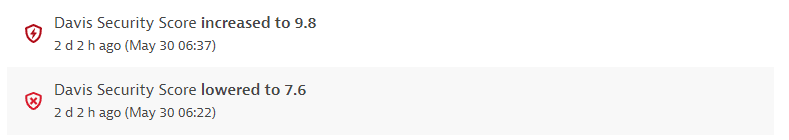 Davis Security Score event change
 -
CVSS increased or lowered. Displays the new value and the time when this change happened.
Example event:
 CVSS score change event
Related entities
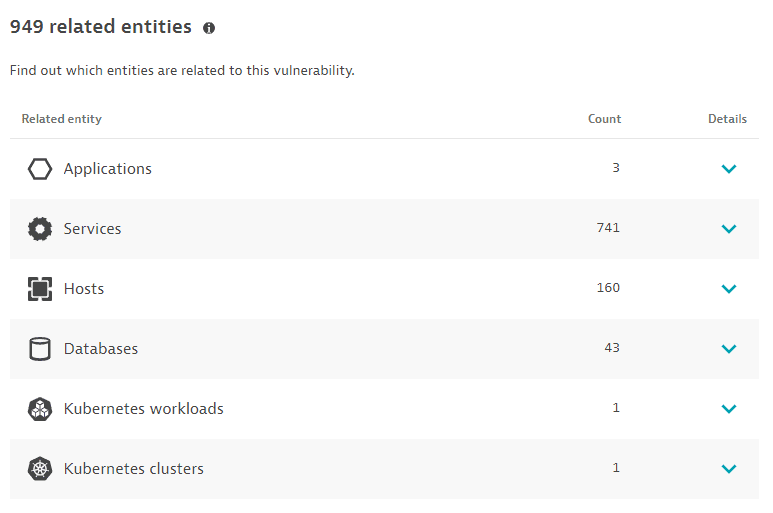
The number of entities (applications, services, hosts, databases, Kubernetes workloads, or Kubernetes clusters) that are somehow connected to the identified vulnerability, based on the last hour, with links to the details page of the related entities:
- Applications: Applications that call a vulnerable service, or applications that call a non-vulnerable service that calls a vulnerable service.
- Limitations: When determining related applications, the Dynatrace PurePath® distributed traces are not analyzed.
- Services: Services that directly run on a vulnerable process group instance.
- Hosts: Hosts on which the vulnerable process runs.
- Databases: Databases that run on the vulnerable process.
- Kubernetes workloads: In Kubernetes environments, the workloads to which the vulnerable process belongs.
- Kubernetes clusters: In Kubernetes environments, the clusters to which the vulnerable process belongs.
The Kubernetes workloads and Kubernetes clusters sections are displayed only if Kubernetes workloads or clusters are detected.
The related entities displayed may be impacted by
- Security-monitoring rules
- Management zones
- Timeframe
Vulnerable components
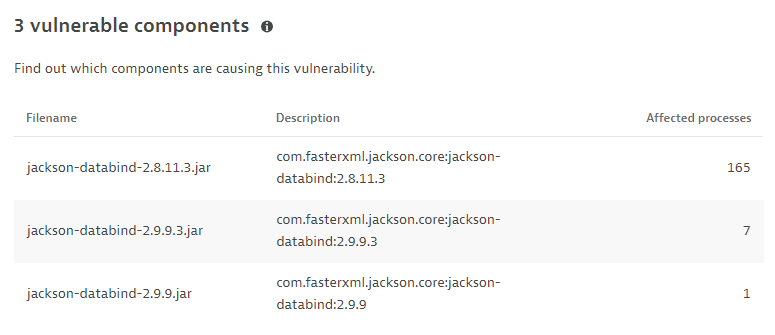
The name and description of the libraries containing the identified vulnerability, and the number of affected processes, based on the last hour.
Related container image
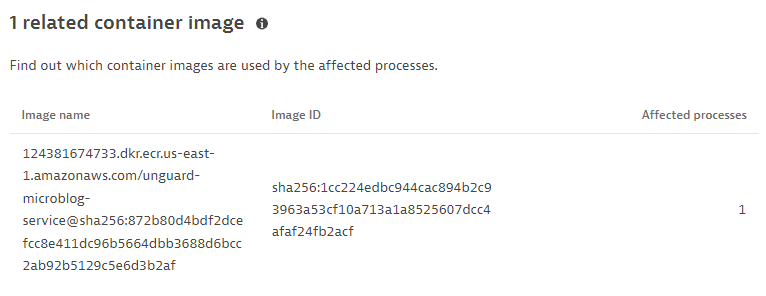
The top five related container images (image name and ID), based on the last hour, sorted by the number of affected processes.
This information is displayed only if containers are detected.
Process group overview
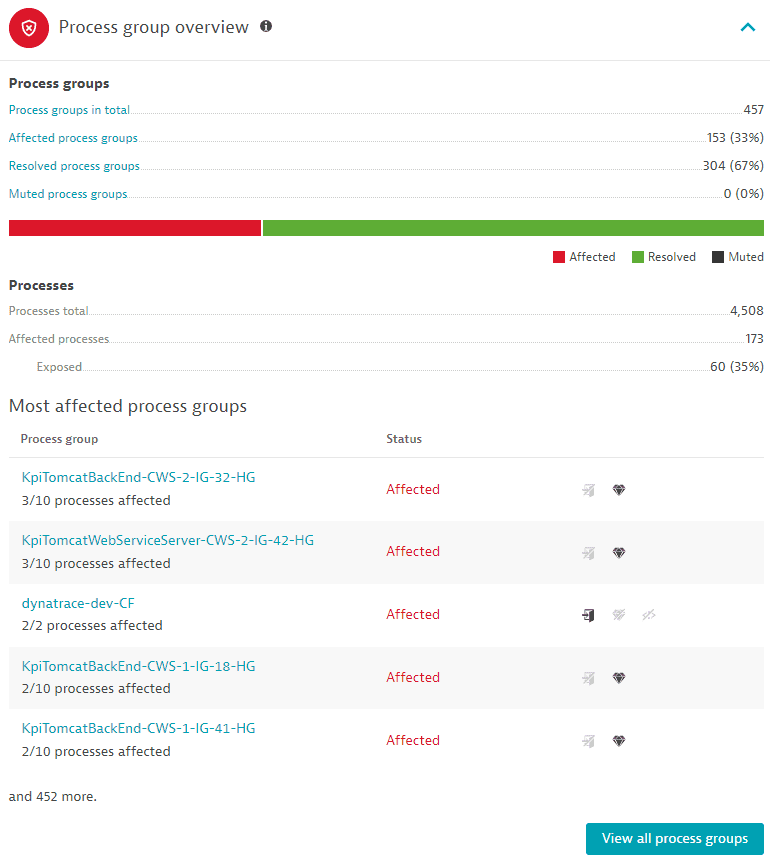
Displays the following information, based on the last hour:
Process groups
-
Process groups in total: The total number of process groups that are related (affected, resolved, and muted) to the identified vulnerability. It links to the overview page of the related process groups.
-
Affected process groups: The number of affected process groups and the percentage of affected process groups out of the total number of related process groups. It links to the overview page of related process groups filtered by
Status: Affected.- An affected process group is a process group that contains a vulnerable library or runtime.
- The number of affected process groups matches the total count only if all functions in all used software component versions are vulnerable.
Example
A software component
Ais vulnerable to a vulnerabilityXin versions1and2.The function
f1is only vulnerable in version1.There are two process groups:
- Process group
PG1uses the software componentA.1, which includes the vulnerable functionf1. - Process group
PG2uses the software componentA.2, which doesn't include any vulnerable function.
The Process groups overview section on the details page of a vulnerability will show the vulnerable function
f1with one process group (PG1)In useandNot in use.PG2is not considered because there is no vulnerable function in version2. -
Resolved process groups: The number of affected process groups that have been resolved and the percentage of resolved process groups out of the total number of related process groups. It links to the overview page of related process groups filtered by
Status: Resolved. -
Muted process groups: The number of affected process groups that have been muted and the percentage of muted process groups out of the total number of related process groups. It links to the overview page of related process groups filtered by
Status: Muted. -
A graph displaying the affected, resolved, and muted process groups, marked with different colors.
Processes
-
Processes total: The total number of processes (affected and unaffected) out of the process groups where at least one process is affected.
-
Affected processes: The number of affected processes.
An affected process is a process that contains a vulnerable library or runtime. It can be exposed to the public internet or not.
-
Exposed: The number of affected processes that are exposed to the public internet and the percentage of exposed processes out of the total number of affected processes.
Most affected process groups
Lists and links to the top five process groups, sorted by status (Affected, then Resolved, and then Muted) and amount of affected processes out of the total processes in the respective process group, and indicates if there is any public internet exposure, or if there are any reachable data assets. Select View all process groups to navigate to the overview page of the process groups related to a vulnerability.
FAQ
- Why is there no data available for vulnerable functions?
-
See below for potential reasons why, on the Third-party vulnerability details page, in the infographic of the key features and the Vulnerability details section, the Not available status is displayed for vulnerable functions.
-
Once you enable Third-party Vulnerability Analytics, it will take some time (one hour at the most) until data about vulnerable functions is displayed.
-
OneAgent monitoring for Java vulnerable functions is disabled. To enable it, see Enable OneAgent monitoring for Java vulnerable functions.
The OneAgent feature must be enabled for all processes affected by the vulnerability.
-
No vulnerable functions of the vulnerability are contained in the release version of the third-party libraries (software components) in use.
-
No vulnerable functions are provided by the Dynatrace security research team.
-
You need to restart the processes affected by the vulnerability for updated information. For details, see FAQ: How can I know if information about vulnerable functions is outdated and what can I do about it?.
-
-
Related topics
Third-Party VulnerabilitiesApplication Security