Logs and events viewer
- Latest Dynatrace
- Overview
- 9-min read
- Published Oct 17, 2022
The Logs and events viewer enables you to browse logs within a certain timeframe using detected aspects of the log content. You can use a filter, DQL query or Available attributes to narrow down your log view and focus on a specific aspect of the log content.
Access logs powered by Grail
To access Logs and events powered by Grail, go to Logs (previous Dynatrace) or  Logs & Events Classic.
Two query modes are available:
- Simple mode
- Advanced mode
While the Simple mode filters can be set on logs only, Advanced mode queries can refer to various types of data stored in Dynatrace, such as business events and records.
Simple mode
Simple mode allows you to filter your logs, create metrics and processing rules, format tables, and perform such actions as downloading tables in JSON and CSV.
The Format table, Create metrics, and Filter by functions are available in Simple mode only.
Attribute filters
You can set filters to narrow down the log events that are displayed in the results table. Select your filters either from the Filter by top-page panel or from the Available attributes side panel on the left side of your screen.
-
In the Filter by panel, the filter is in autocomplete mode, where you select a log data field to filter the results.
-
In the Available attributes panel, you can see three levels:
- General categories (
Main,Dynatrace,Cloud services), which are split into - Attributes (
loglevel,logsource), which in turn are divided into attribute values that are - Log data fields (
NONE,INFO,DEBUG).
After opening each category, you can also check the counts of records per attribute value (log data field).
You can combine attributes that belong to various categories, or attribute values within one attribute, in one query.
When using a search query in the simple mode:
- If the searched attribute names are the same, the OR operator is applied. The search results include items that match any of the specified attribute names. It provides a broader search, allowing for variations in attribute names.
- If the searched attribute names differ, the AND operator is applied. The search results include only items that simultaneously match all of the specified attribute names. It narrows down the search to items that match multiple criteria.
- General categories (
Example of a combination of attribute values in Simple mode
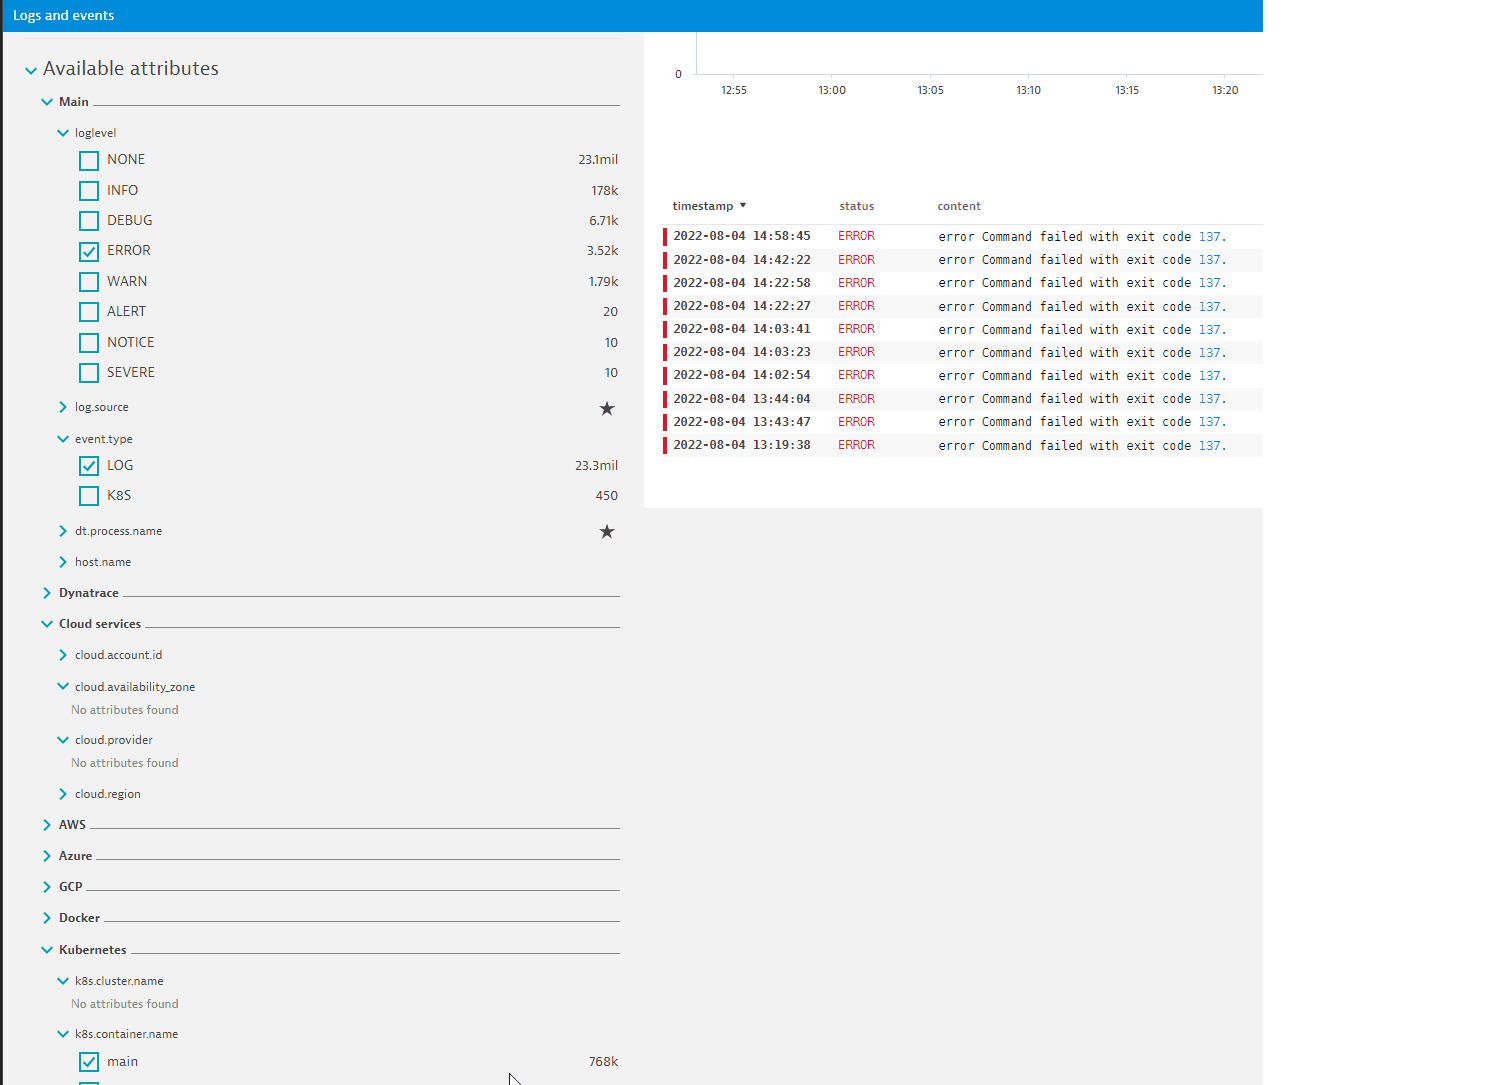
The example below illustrates a combination of two attribute values within one category, Main, with a single attribute value from the other category, Kubernetes. Results are presented in the table.

You can also build a list of your favorite attributes by selecting an asterisk on the right side of an attribute in the Available attributes panel. Selected attributes are pinned to your Favorites.
You can also define your custom log data attributes that suit your particular log data format. Similarly to the automatically detected log attributes, your custom log attributes are extracted from the log data during ingestion and become available within Dynatrace.
Results table
The results table under the chart displays the log events that match the provided filters within the selected timeframe.
- Each row in the table represents a log record and can be expanded for detailed log data.
- When you scroll down, rows are automatically added and displayed.
- By default, ingested log records are sorted by timestamp and then by the order that is maintained in the log source, where a log source is a remote process writing to a REST API endpoint or a remote process on which logs are detected.
By default, Log powered by Grail display a maximum of 1,000 log events. If you don't see expected results, run a more exact query or narrow down the timeframe.
-
Create processing rule
To create a processing rule, see Log processing rules -
Create metrics
To create metrics, see Log metrics -
Format table
It displays Dynatrace-generated and reserved log attributes that you can add to the results table for visibility and use as dimensions when creating a log metric. For example, you can use thedt.entity.process_groupattribute to display the process group instance for which the log event occurred.Select or clear checkboxes to display or hide the corresponding columns in the table. Only non-empty fields are displayed.
-
Actions
Select Download table (JSON) or Download table (CSV), depending on the format you need.Table vs exportWhile your search query may return more than 1,000 log records, the result table will display only the first 1,000 log records. As a result, the exported table data will contain only the 1,000 log records visible in the table. The exported log records will include only the data displayed in the table column (they can be added/removed from the Format table menu).
Advanced mode
Advanced mode allows you to filter your logs using Dynatrace Query Language (DQL), create metrics, and perform such actions as downloading tables in JSON and CSV.
DQL query
Dynatrace Query Language (DQL) is a tool to retrieve, explore, and analyze data, data patterns, and trends; identify anomalies and deviations; and provide statistical modeling and mining, based on data stored in the Dynatrace Grail. As opposed to other languages, such as SQL, DQL does not require an up-front description of the input data. Depending on the conditions set, after each operation, DQL returns either a table containing data that can be further processed or an integer.
To learn more about DQL, see Dynatrace Query Language.
You can turn Advanced query on and off to switch between Simple mode and Advanced mode.
-
When you switch, the Filter by function is replaced by a DQL field. Dynatrace will transform the auto-complete filters to a query, and vice versa, provided that the query in Advanced mode can be transformed.
-
Filters requested in the DQL query in Advanced mode are added to auto-complete filters in Simple mode when you select Run query. However, some complex queries with logical operators cannot be converted to auto-complete filters, in which case switching to auto-complete mode becomes unavailable.
-
You can stop the running query by selecting the Stop query button. It is the same button as the Run query button, as it changes the label when you select it. The Cancel query button stops all ongoing requests for logs and aggregations.
While entering your DQL queries, you get syntax suggestions and syntax validation.
Syntax suggestions provide you with options for:
- DQL data source (simple identifiers) from which to fetch data, such as
logs,bizevents - DQL commands, such as
filter,parse,summarize - DQL functions, such as
isNULL,contains - DQL operators, such as
>,<,,
Example of syntax suggestions received when building your query
Suppose you need to write a query that groups your logs by severity and host, and counts logs per host. These are the suggestions you receive along the way:
-
After selecting
fetch logs, you need to find records for existing (non-null) hosts where loglevel is defined (notNONE) TheisNotNullfunction on the autosuggest list:
The
filterOutcommand on the autosuggest list:
-
You arrive at the below query:
fetch logs| filter isNotNull(`dt.entity.host`)| filterOut loglevel == "NONE" -
Now you need to count the logs by loglevel and host. This is where you can get a suggestion for
summarizeandcountfunctions and parameter keys associated with these functions (in this case, thebyparameter):
-
You arrive at your final query:
fetch logs| filter isNotNull(`dt.entity.host`)| filterOut loglevel == "NONE"| summarize count = count(), by: {dt.entity.host, loglevel}
Syntax validation informs you about:
- Errors in your query
- Missing data items in your query
Example of syntax validations received when building your query
-
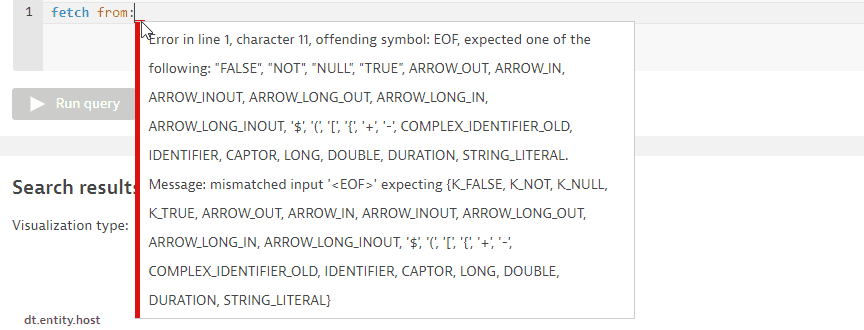
If your syntax is incorrect, you see an error message upon navigating to the red line:

-
If your query is missing a parameter, you are notified about it:

-
Your query is valid when the Run query button turns green.
Unfiltered log dataIn Advanced mode, you can run an empty query to return unfiltered log data.
Search results
The search results panel shows the log events that match the provided query and offers four options to display results:
-
Table
Available when the query result is tabular data. Each row in the table represents a log record and can be expanded for detailed log data.
- If you scroll down, rows are automatically added and displayed.
- Ingested log records are sorted by timestamp and then by the order that is maintained in the log source, where a log source is a remote process writing to a REST API endpoint or a remote process on which logs are detected.
- By default, the logs powered by Grail display a maximum of 1,000 log events. If you don't see expected results, run a more exact query or narrow down the timeframe.
To export table data
- Select Actions.
- Select Download table (JSON) or Download table (CSV), depending on the format you need. While your search query may return more than 1,000 log records, the result table will display only the first 1,000 log records. The exported log records will include only the data displayed in the table column (requested in your DQL query).
-
Single value
Available when the query result is a single value, such as
count -
Bar
Available on the condition that the query contains two mandatory components: a function (for example
summarize count()) and a parameter.You can display results from a query that groups your logs by severity in a table and a bar:
fetch logs| filter isNotNull(dt.entity.host)| filterOut loglevel == "NONE"| summarize count = count(), by: {loglevel}| sort count descThe result of the above query example is displayed as a table:
loglevel
count
INFO
5372
ERROR
4013
WARN
1764
DEBUG
32
SEVERE
14
The result of the above query example displayed as a bar:

-
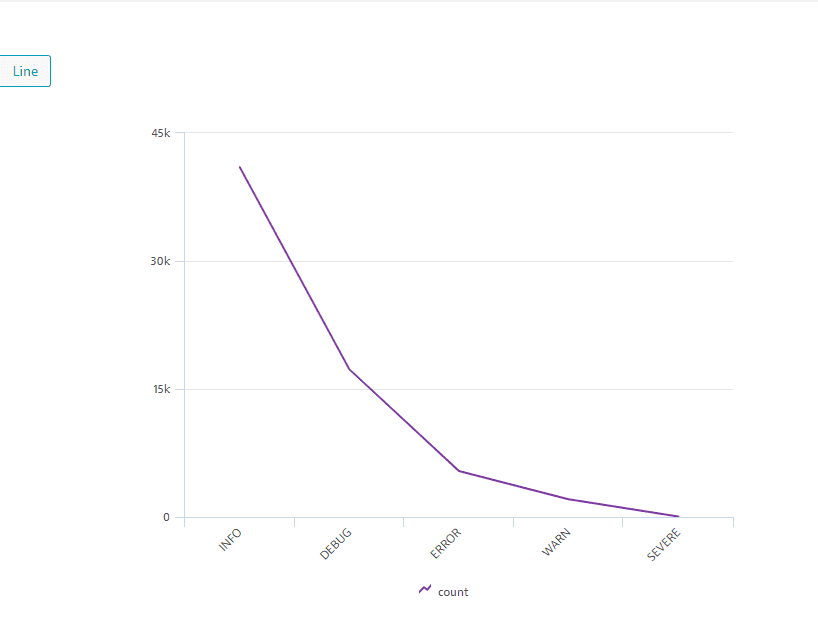
Line
The result of the above query example can be displayed as a line chart:
