Install the z/OS Java module
- Latest Dynatrace
- 15-min read
With the z/OS Java module, you can get observability for your Java applications including IBM MQ and database calls.
| Observability for | Including |
|---|---|
WebSphere Application Server WebSphere Liberty |
|
z/OS Connect |
|
CICS/IMS transactions | Transactions initiated using
|
Database calls | Database calls with their SQL statements from Java applications to Db2 via JDBC |
Trace your Java applications end-to-end with Dynatrace and quickly detect any anomalies
Analyze the performance of your transactions end-to-end using the service flow.
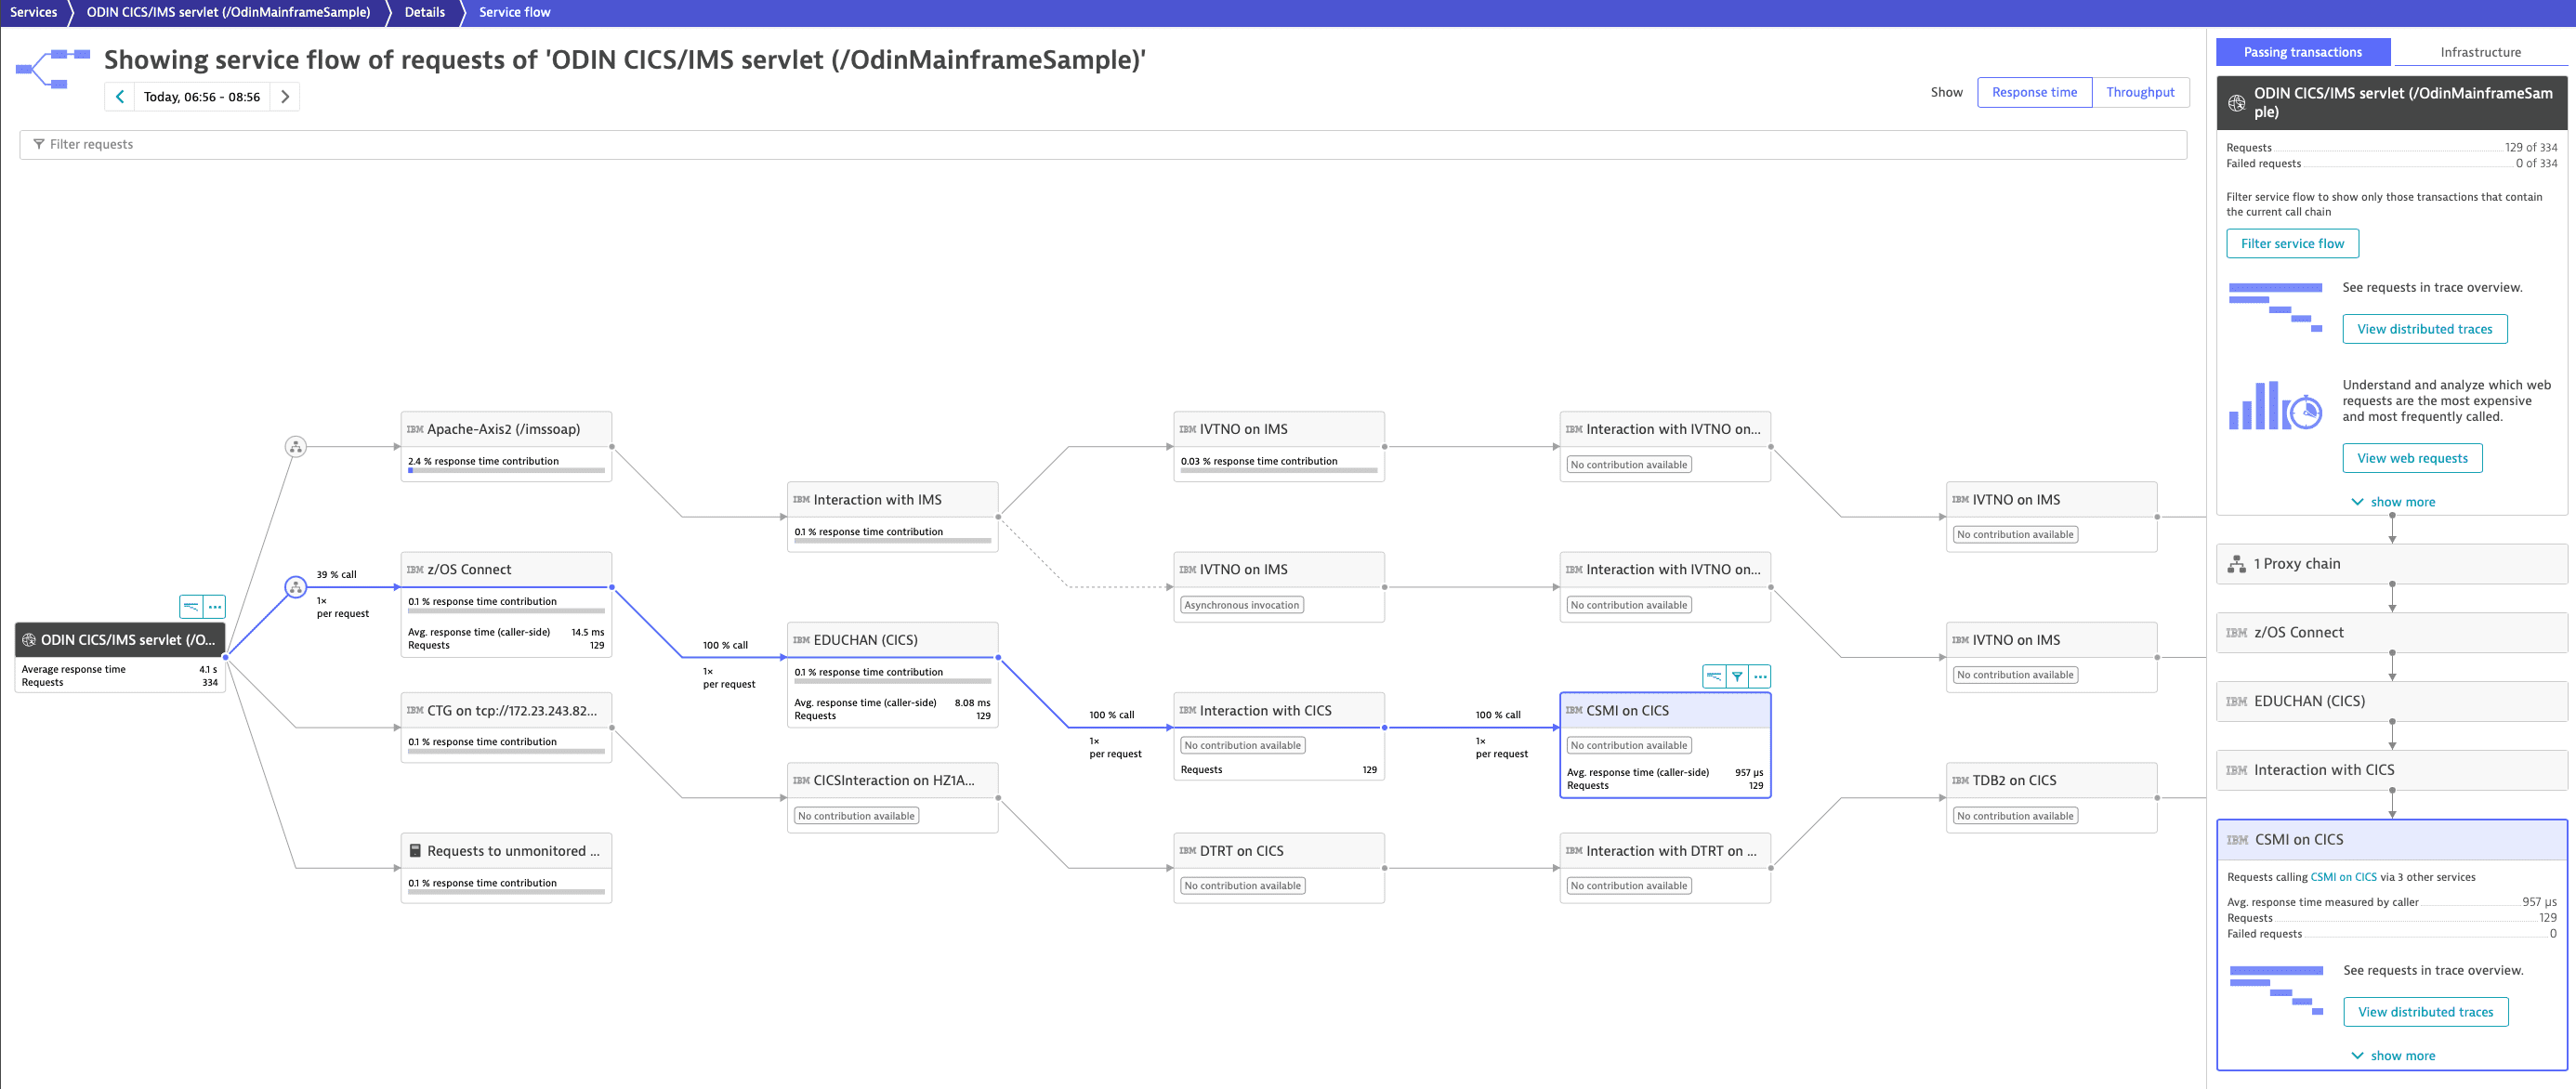
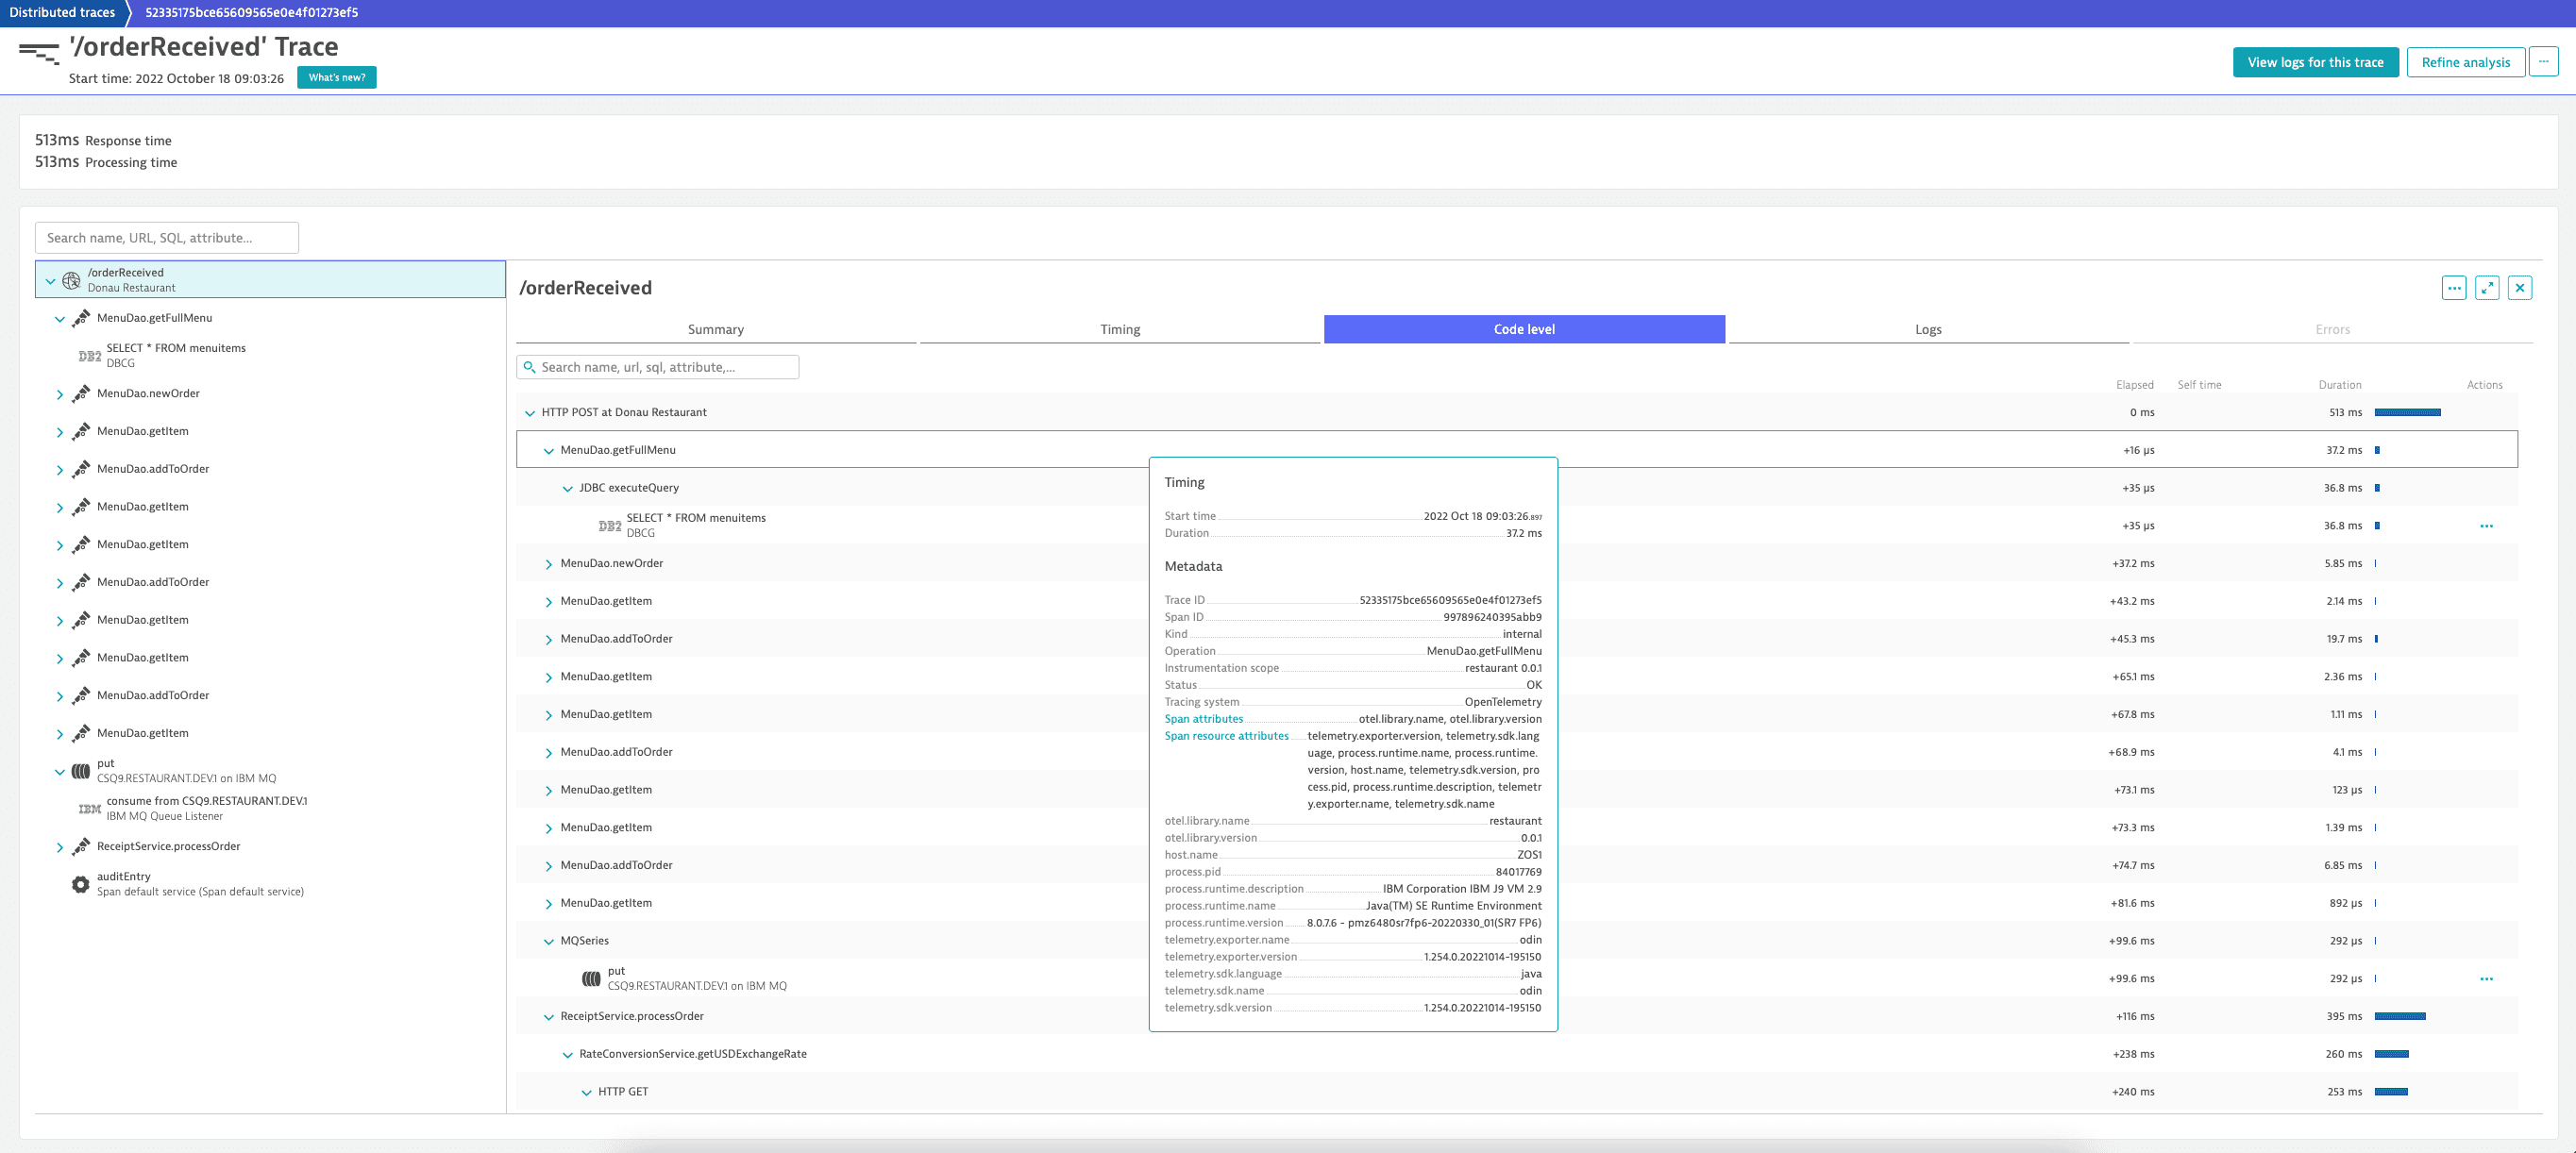
Use the PurePath distributed traces to drill down to the code level and to optimize your programs.
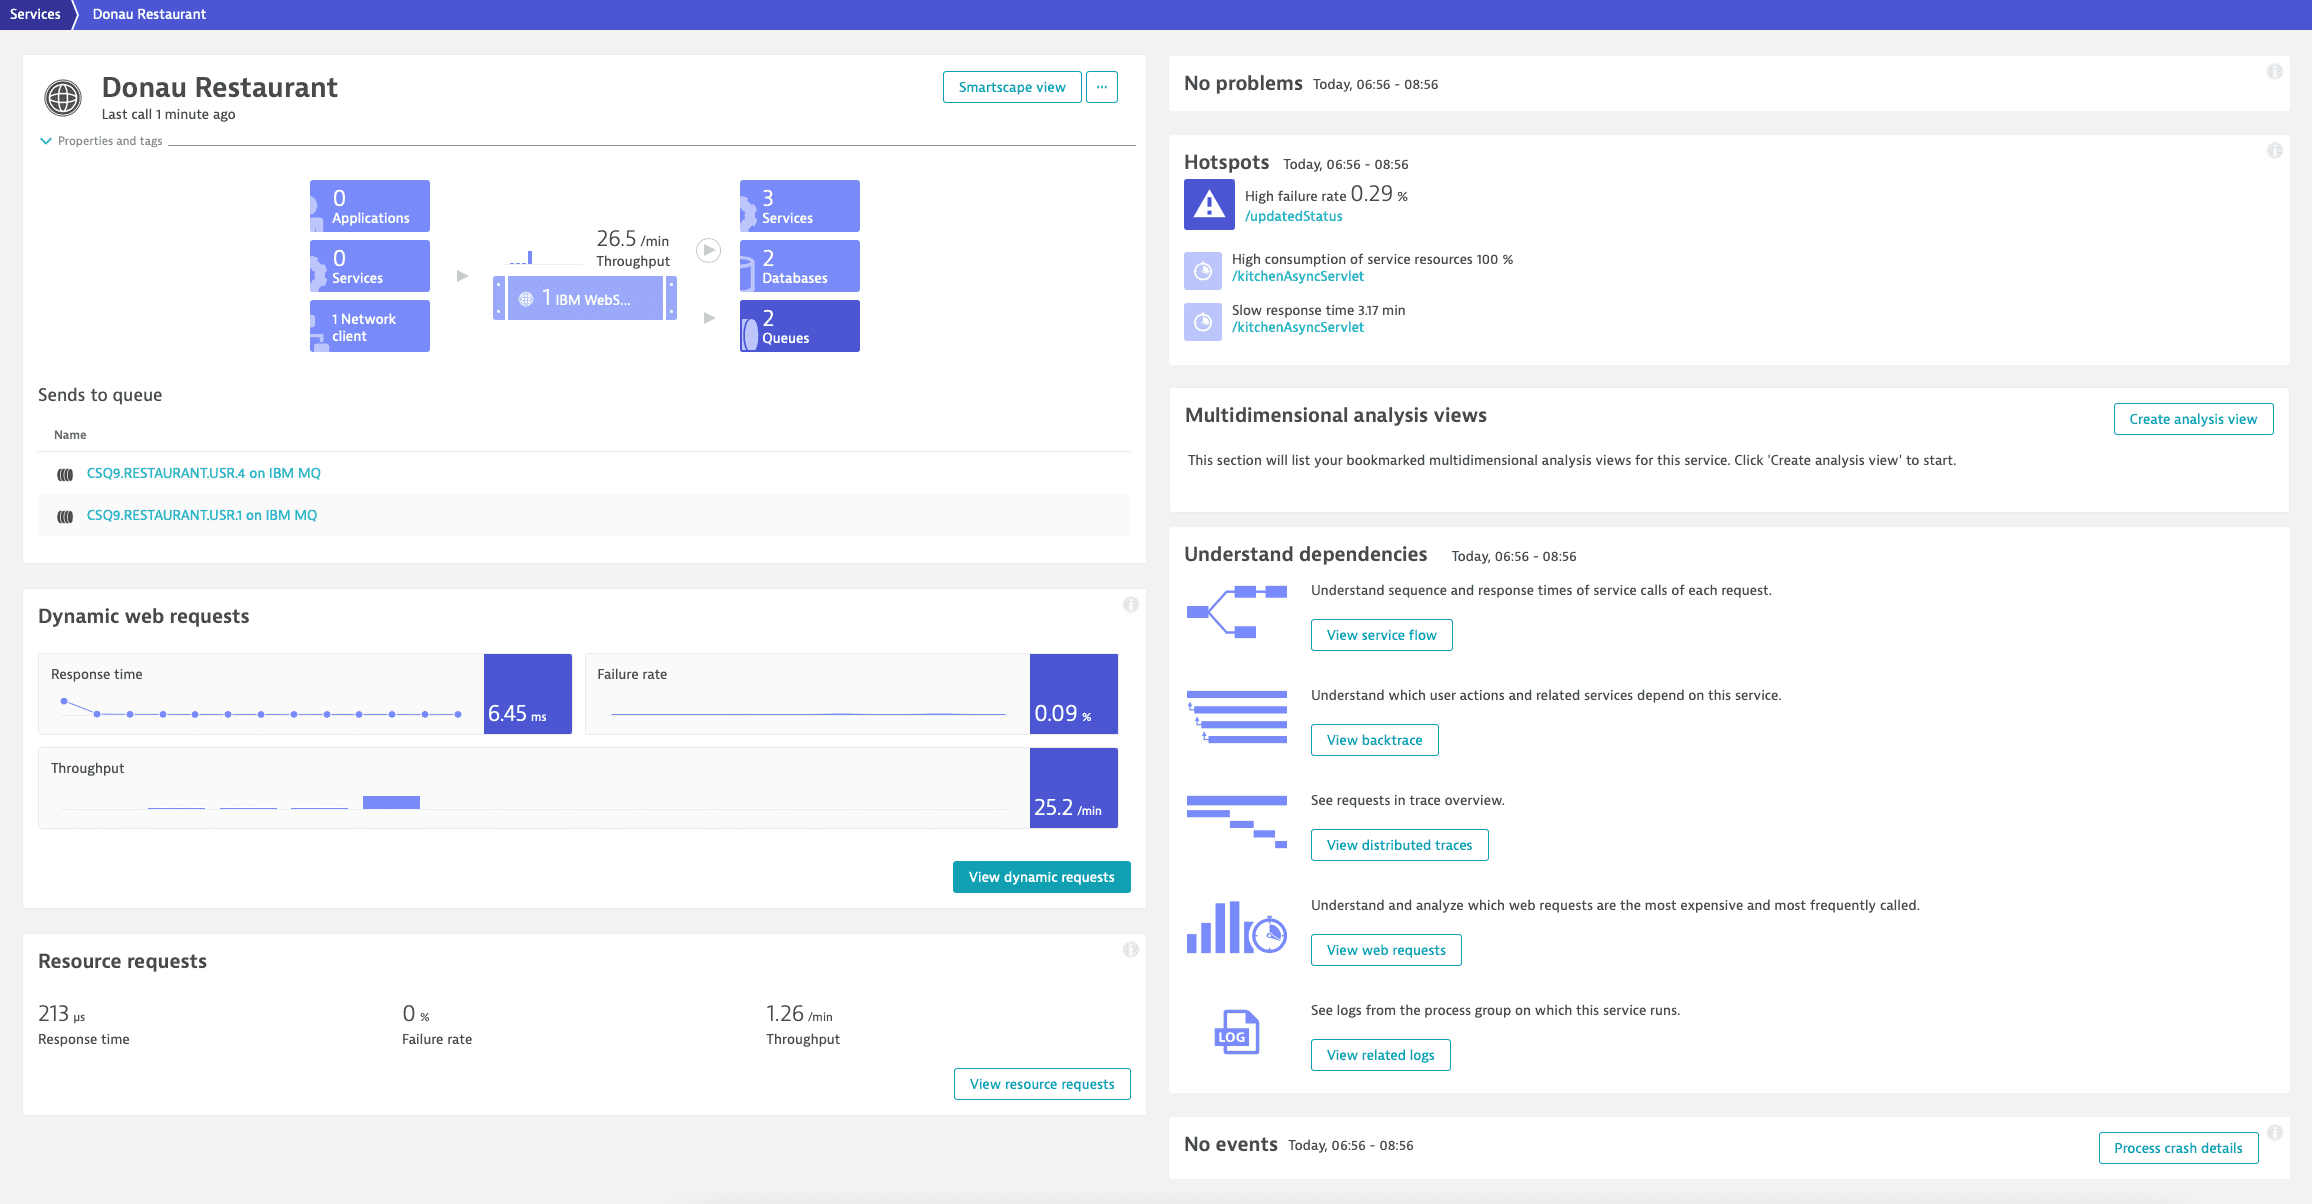
Quickly detect anomalies with the Service response time hotspots.
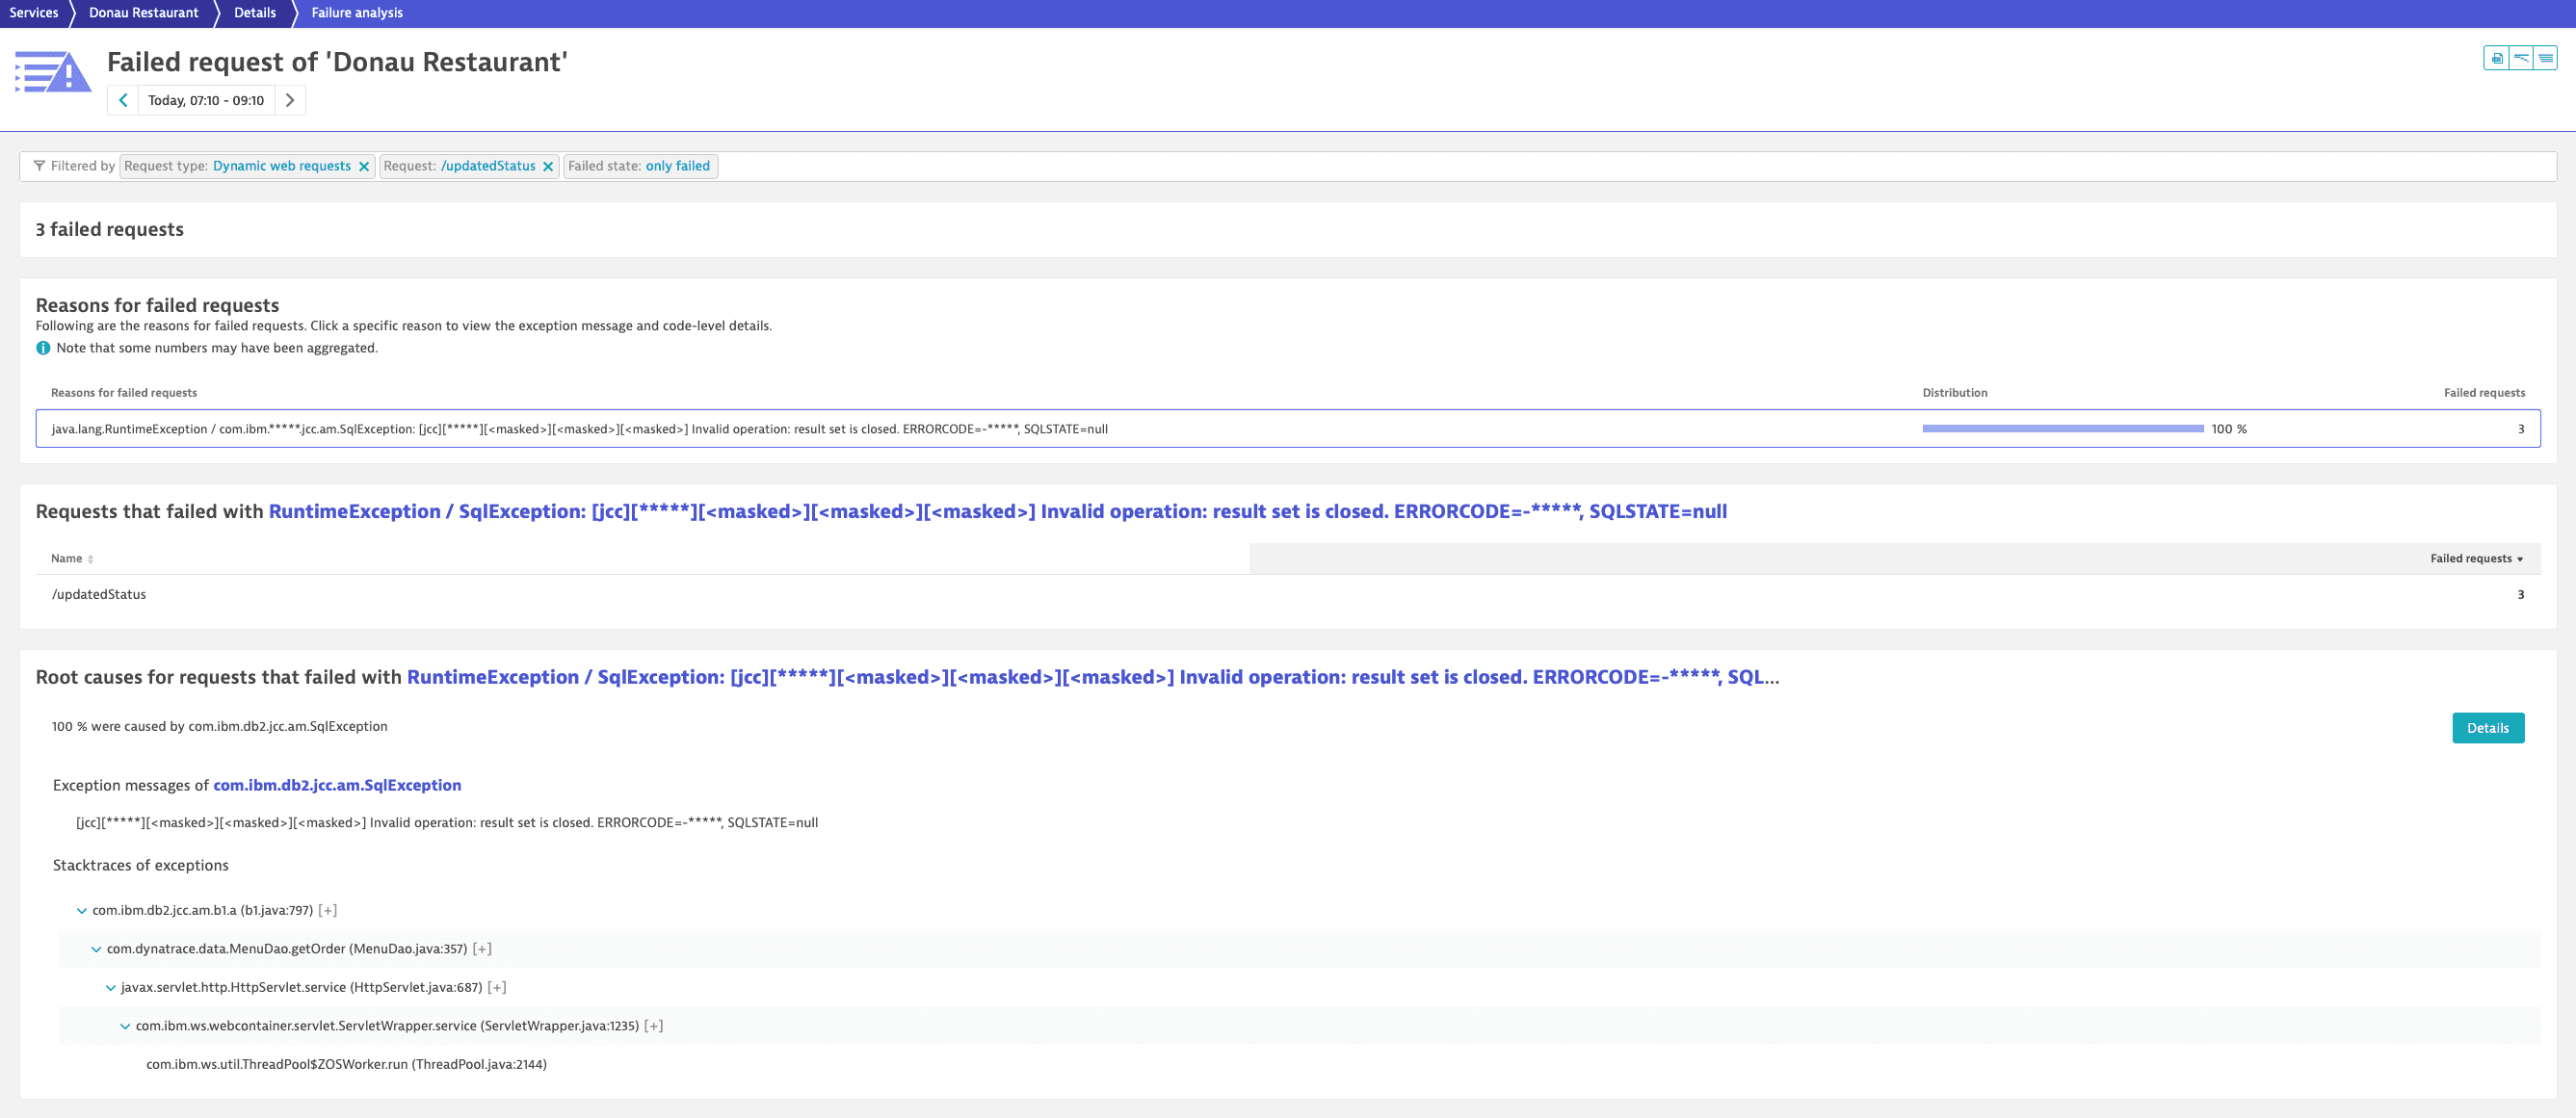
Analyze failures and exceptions with detailed stack traces.
Understand the health and performance of your JVM with the applications deployed on it
Gain insights into your JVM with the Dynatrace managed memory metrics:
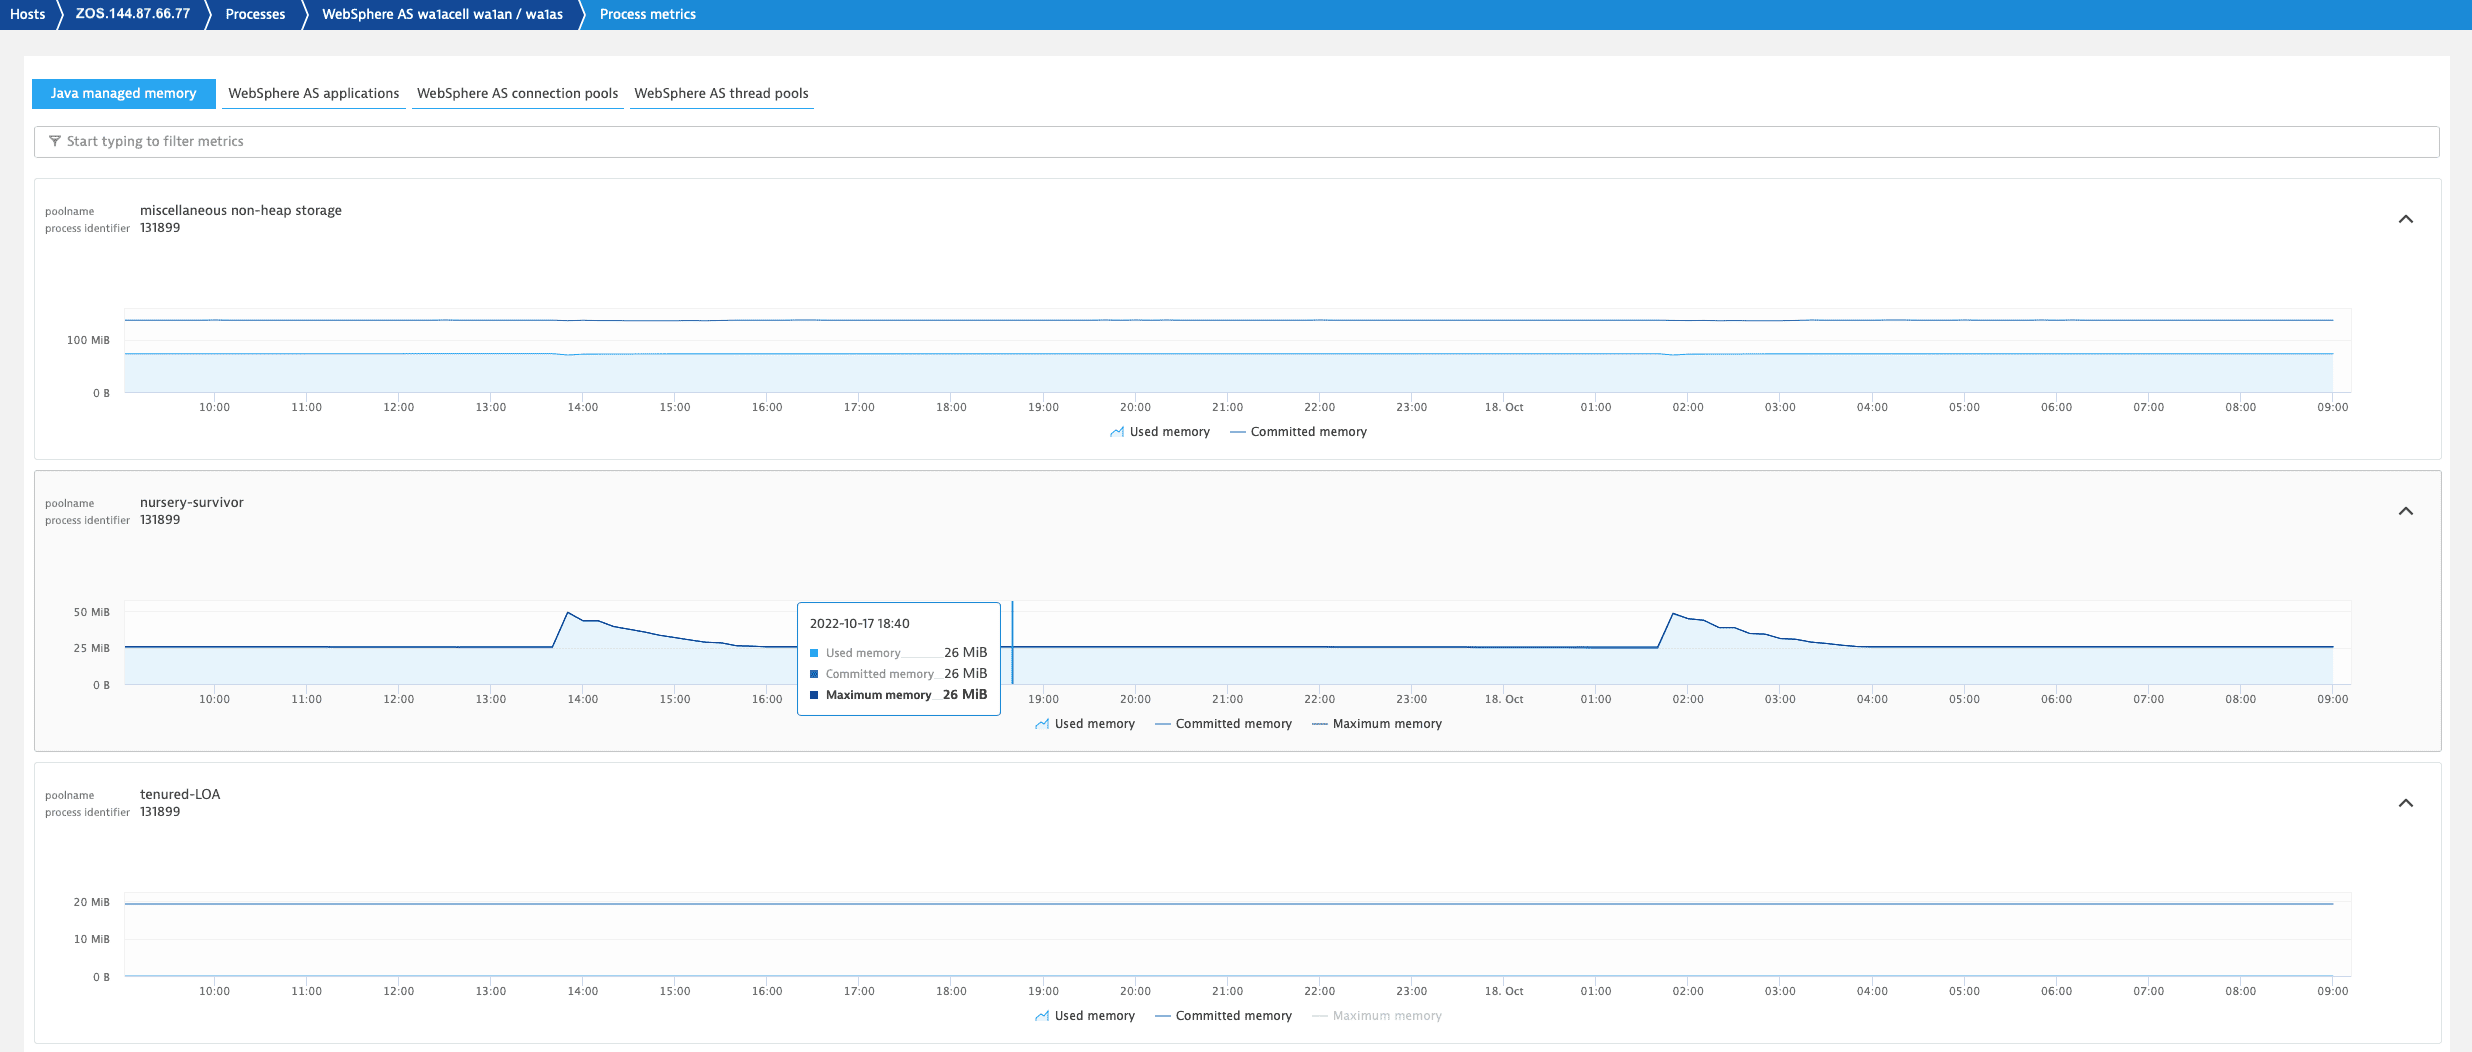
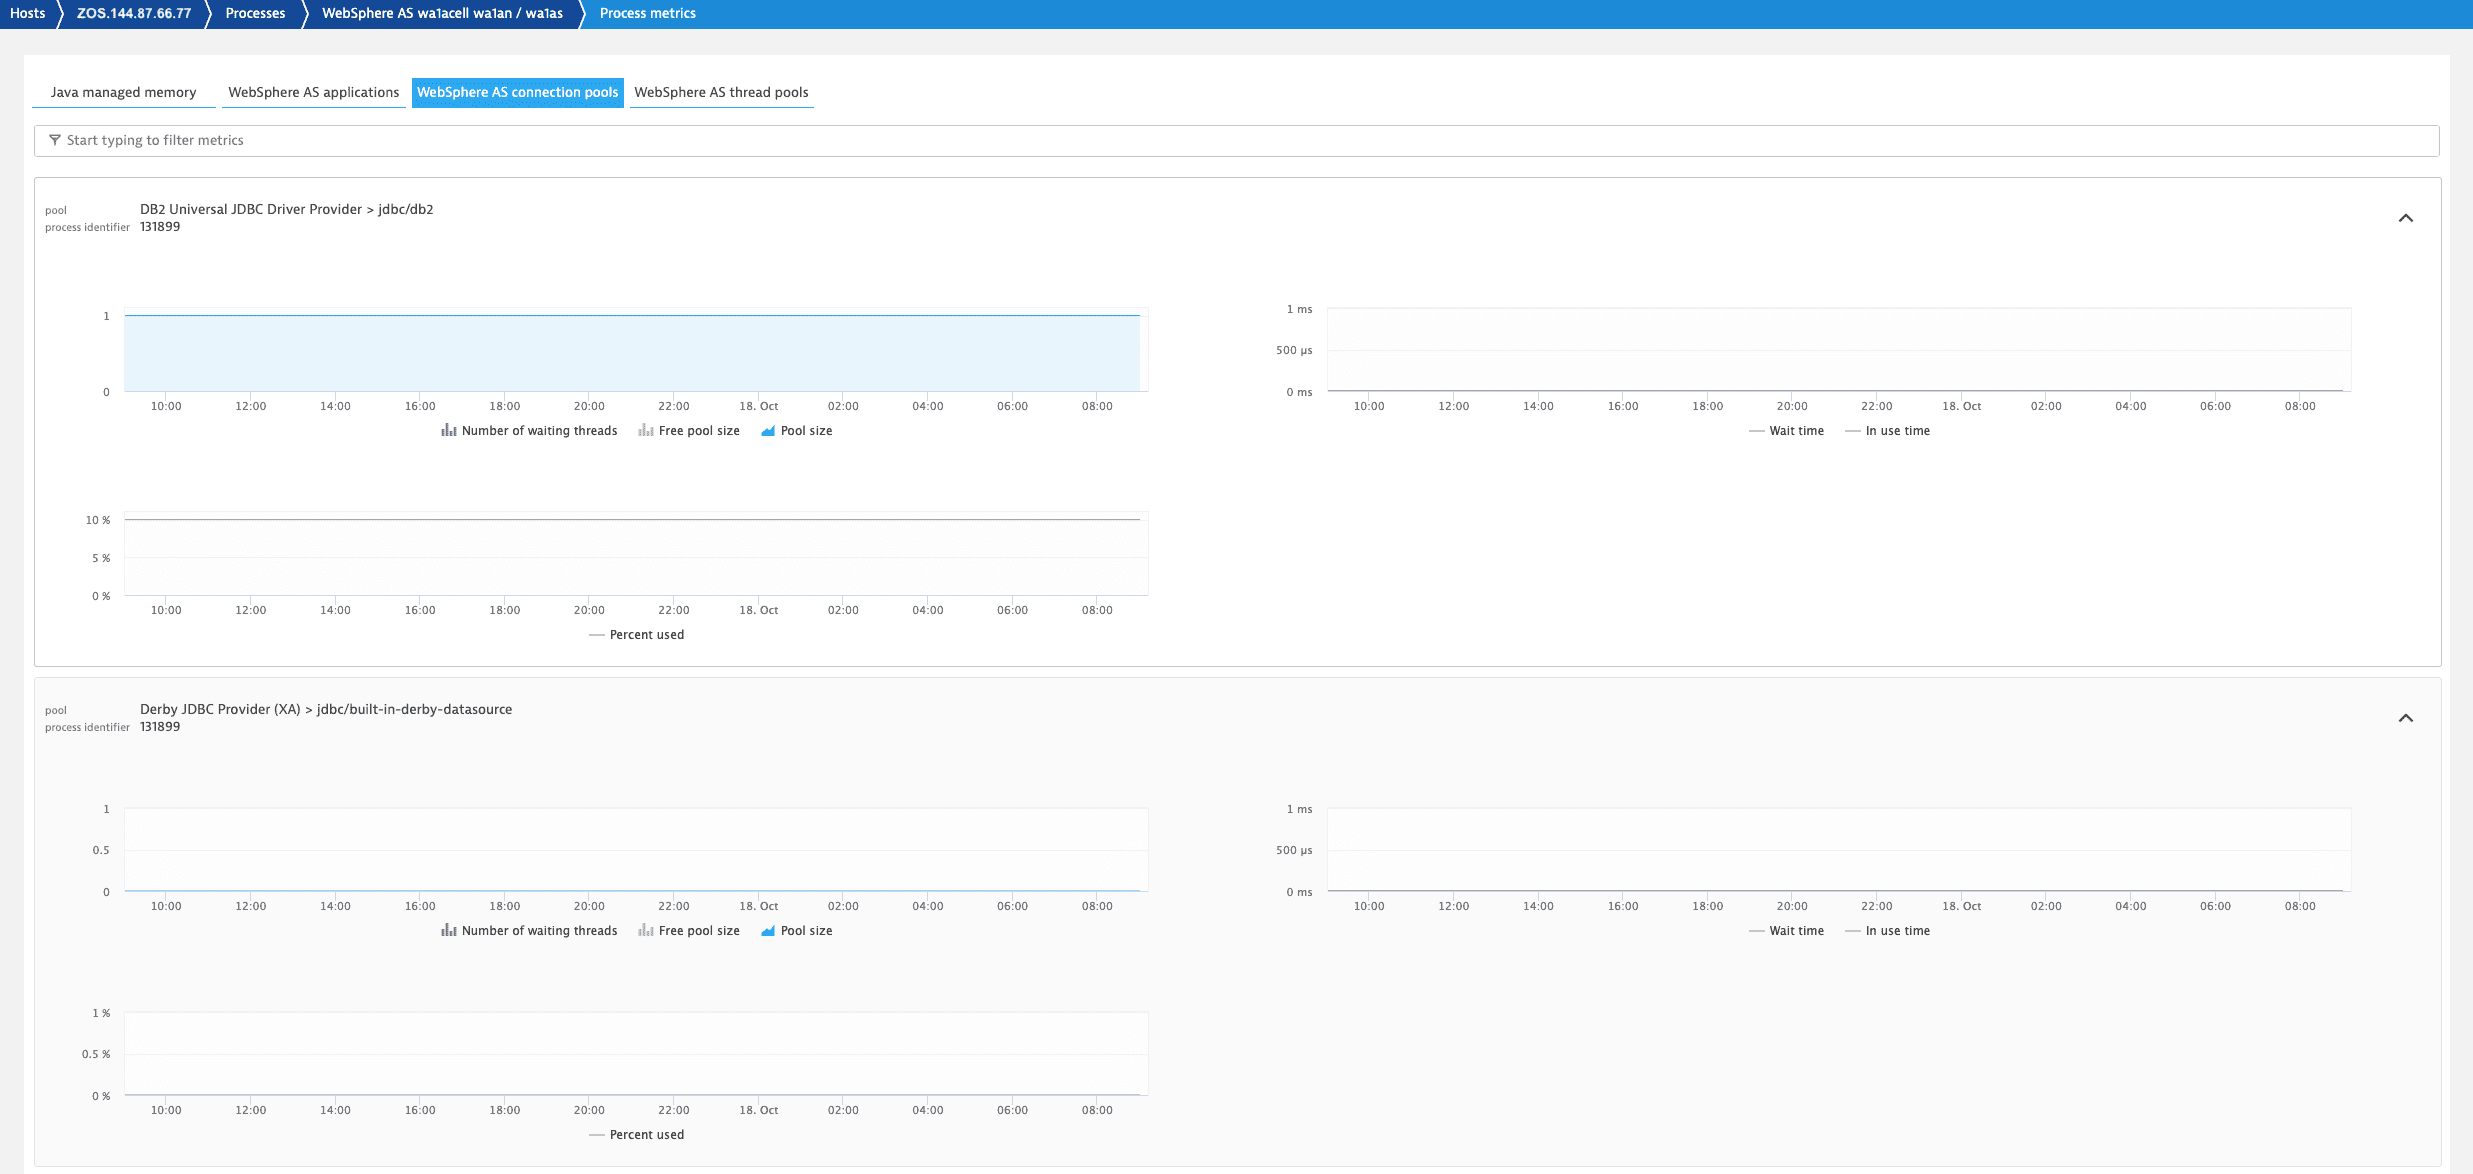
Understand the health and performance of your application servers with technology-specific metrics:
What JMX and PMI metrics does Dynatrace provide out of the box?
JVM specific metrics:
| Metric group | Metric | Source |
|---|---|---|
JVM memory | Garbage collection total activation count | JMX |
JVM memory | Garbage collection total collection time | JMX |
JVM memory pool | Garbage collection count | JMX |
JVM memory pool | Garbage collection time | JMX |
JVM memory pool | Heap memory pool maximum bytes | JMX |
JVM memory pool | Heap memory pool committed bytes | JMX |
JVM memory pool | Heap memory pool used bytes | JMX |
JVM memory runtime | Runtime maximum memory | JMX |
JVM memory runtime | Runtime total memory | JMX |
JVM memory runtime | Runtime free memory | JMX |
JVM threads | Thread count | JMX |
JVM classes | Total number of loaded classes | JMX |
JVM classes | Number of loaded classes | JMX |
JVM classes | Number of unloaded classes | JMX |
WebSphere Liberty and z/OS Connect specific metrics:
| Metric group | Metric | Metric description | Source |
|---|---|---|---|
JDBC connection pool | In use connections | The number of connections in use. This number might include multiple connections that are shared from a single managed connection. | JMX |
JDBC connection pool | Free connections | The number of managed connections in the free pool. | JMX |
JDBC connection pool | Managed connections | The total number of managed connections in the free, shared, and unshared pools. | JMX |
JDBC connection pool | In use time | The average time in milliseconds that a connection is in use. | JMX |
JDBC connection pool | Wait time | The average waiting time in milliseconds until a connection is granted if a connection is not currently available. | JMX |
Thread pool | Pool size | The average number of threads in pool. | JMX |
Thread pool | Active threads | The number of active threads that are serving requests. | JMX |
Servlet | Request count | The total number of requests that a servlet processed. | JMX |
Websphere Application Server specific metrics:
| Metric group | Metric | Metric description | Source |
|---|---|---|---|
JDBC connection pool | Pool size | The size of the connection pool. | PMI |
JDBC connection pool | Free pool size | The number of managed connections that are in the free pool. | PMI |
JDBC connection pool | Concurrent waiters | The number of threads that are currently waiting for a connection. | PMI |
JDBC connection pool | Average wait time | The average waiting time in milliseconds until a connection is granted if a connection is not currently available. | PMI |
JDBC connection pool | Average use time | The average time in milliseconds that a connection is in use. | PMI |
JDBC connection pool | Percent used | The percent of the pool that is in use. | PMI |
Thread pool | Pool size | The average number of threads in pool. | PMI |
Thread pool | Active threads | The number of concurrently active threads. | PMI |
Servlet | Live sessions | The number of local sessions that are currently cached in memory from the time at which this metric is enabled. | PMI |
Servlet | Total requests | The total number of requests that a servlet processed. | PMI |
Can I monitor custom JMX metrics with the z/OS Java module?
Yes, you can use the z/OS Java module to monitor custom JMX metrics. For more information, see Monitor JMX metrics on z/OS.
Prerequisite
Activate the OneAgent feature Forward Tag 4 trace context extension.
Download
-
Download z/OS product datasets and extract the JAR file (
dynatrace-oneagent-zos-java.jar). -
Transfer the JAR file to your z/OS Unix System Services (USS) environment in binary mode.
-
Create a new file with the name
dtconfig.jsonin the z/OS USS folder where the module is located.A minimal
dtconfig.jsonfile contains your Dynatrace environment ID (Tenant), cluster ID (ClusterID), and the zDC subsystem name (ZdcName). For example:{"Tenant": "myTenant","ClusterID": myCluster,"ZdcName": "DEFAULT"}Replace
myTenantandmyCluster>with your Dynatrace environment values. To find these values, in Dynatrace Hub, select OneAgent > Download OneAgent or Set up (latest Dynatrace) > z/OS.If the zDC name is defined as
DEFAULT, the module will connect to the default zDC subsystem ID. To use a different zDC, replaceDEFAULTwith an alternative subsystem ID.You can find the zDC subsystem name in the SYSIN parameters of your JCL SYSIN member
ZDCSYSIN. The default zDC subsystem name isMEPC.//SYSIN DD DISP=SHR,DSN=<hlq>.SZDTSAMP(ZDCSYSIN)SUBSYSTEM_ID(MEPC)DEFAULT(YES)If
DEFAULTis set toYESin the SYSIN parameters, you can also useDEFAULTin thedtconfig.jsonfile.
- EBCDIC 1047, UTF-8, and ASCII encodings are supported for the
dtconfig.jsonfile. - The module automatically reads
dtconfig.jsonwhen it's placed in the same folder asdynatrace-oneagent-zos-java.jar. - If you put
dtconfig.jsonin a different folder, you need to specify the path to it via the environment variableDT_CONFIG_FILE. The path must include the filename. You can use an absolute path or a path relative to the working folder of the process.
Installation
Updating a previously installed version of Dynatrace
If you have Dynatrace installed and are upgrading to a new release, you can jump to Update.
Application server
You need to add the z/OS Java module to the JVM arguments of each application server that you want to monitor.
-
Open the WebSphere Application Server Admin Console and navigate to Application servers.
-
Select
<YOUR_SERVER>> Process definition > Servant, and choose Java Virtual Machine. -
Copy the JVM argument from your Dynatrace environment and paste it into the Generic JVM arguments:
-javaagent:/PATH_TO/dynatrace-oneagent-zos-java.jarReplace
PATH_TOwith the path to your JAR file. -
Save the changes and restart your WebSphere Application Server.
- It's only necessary to add the module to the Servant processes.
- We recommend adding the module as the first JVM argument.
- The module must not be appended at the end of the command line.
Middleware
You need to add the z/OS Java module to each product that you want to monitor.
-
Add the module to the
JVM_OPTIONS STDENVvariable:JVM_OPTIONS=-javaagent:/PATH_TO/dynatrace-oneagent-zos-java.jarReplace
PATH_TOwith the path to your JAR file. -
Optional Add the
monitor-1.0feature to yourfeatureManagerin theserver.xmlfile to collect additional metrics like connection pools or thread pools:<server><featureManager><feature>monitor-1.0</feature></featureManager></server> -
Save the changes and restart your z/OS Connect Enterprise Edition.
-
For the CICS service provider, activate the OneAgent feature z/OS CICS z/OS Connect.
-
For the IMS service provider:
- Add the IMS module to IMS Connect as described in Install the IMS module.
- Activate the OneAgent feature z/OS IMS z/OS Connect.
-
For the MQ service provider, no additional configuration is needed.
Logging
By default, logging is disabled for the z/OS Java module. To enable logging, add one of the following options to the JVM argument:
| Option | Default value | Description |
|---|---|---|
log-stdout |
| If |
log-stderr |
| If |
log-file |
| If |
If needed, you can log to multiple locations. For example:
-javaagent:/PATH_TO/dynatrace-oneagent-zos-java.jar=log-stdout=true,log-file=true
If needed, you can customize the file logging with the following options:
| Option | Default value | Description |
|---|---|---|
log-file-dir |
| By default, write log files to the z/OS Java module folder. It's also possible to write the log files to an absolute path (schema: |
By changing the default folder, ensure that the application server has appropriate write permissions for the folder in which the module should write the log files.
OneAgent diagnostics
Dynatrace recommends to write the logs to the shared log folder of the zDC so that they are included into the OneAgent diagnostics workflow. For example, if the dtzagent binary is located at /u/dt/agent/lib64/dtzagent in the z/OS USS environment, the log folder is /u/dt/log. Typically, a shared zDC log folder already exists and contains some zDC logs.
To enable file logging to an absolute path such as the shared zDC log folder /u/dt/log, specify the JVM argument as follows:
-javaagent:/PATH_TO/dynatrace-oneagent-zos-java.jar=log-file=true,log-file-dir=/u/dt/log
If your zDC is installed in a different location, you must adopt the absolute path of the shared zDC log folder.
Update
To update your z/OS Java module to a newer version
- Download z/OS product datasets and transfer the JAR file (
dynatrace-oneagent-zos-java.jar) to your z/OS USS environment in binary mode. - Locate your existing dtconfig.json in the z/OS USS folder where the old version of the module is located and copy it to the z/OS USS folder you used in step(1).
- Stop your monitored application server or middleware.
- Replace your current JAR file with the new JAR file.
- Start your application server or middleware.
FAQ
How can I enable program control for the z/OS Java module?
If, after starting the application server in z/OS, you may see Not Marked Program Controlled messages or errors with the return code 139:
BPXP015I HFS PROGRAM /tmp/libdynatrace-oneagent-odin-java5848811742465559217.soIS NOT MARKED PROGRAM CONTROLLED.
You need to enable program control for the z/OS Java module. To do so
-
Expand
dynatrace-oneagent-zos-java.jarthat you downloaded into a program controlled folder. -
Mark the appropriate
.sofile (31 or 64 bit) in thelib/zos-s390/directory as program-controlled.- Switch to the path that contains the
.sofiles. - Issue the following command using the 31- or 64-bit file:
extattr +p libdynatrace-oneagent-odin-java_64.so
- Switch to the path that contains the
-
Add
zos-native-library-overrideto your JVM argument.-javaagent:/PATH_TO/dynatrace-oneagent-zos-java.jar=zos-native-library-override=<PATH_TO_SO>/libdynatrace-oneagent-odin-java_64.soWhere:
<PATH_TO>is the path to your JAR file.<PATH_TO_SO>is the absolute path to the.sofile that you want to control.
-
Restart your application server.
Can I disable sensors of the z/OS Java module?
By default, all sensors of the z/OS Java module are enabled. In case of problems, you can disable specific sensors by setting their value to false in the dtconfig.json file.
{"Sensors": {"Enable": {"CTG": {"Server": "false","Client": "false"},"HttpClient": {"Apache": "false"},"JDBC": "false","JMS": "false","IbmMQ": "false","Servlet": "false","ZosConnect": "false"}}}