Monitor JMX metrics on z/OS
- Latest Dynatrace
- 5-min read
- Published Sep 06, 2022
JMX (Java Management Extensions) is handy for monitoring applications built using Java. With the OneAgent z/OS Java code module, you can monitor any metric in your JVM that is exposed via an MBean.
- Every monitored custom JMX metric consumes Davis data units. The concept of Included metrics per host unit isn't applicable for monitored LPARs on z/OS. To learn more about Davis data units, see DDUs for metrics.
- PMI (Performance Monitoring Infrastructure) for the IBM WebSphere Application Server is currently not supported.
Definition
The customJmxMetrics attribute defines a list of metrics to be monitored. To get started, add the customJmxMetrics attribute to your dtconfig.json file as shown in the following example.
Typically, you've created the dtconfig.json file during the z/OS Java code module installation and have set the attributes Tenant, ClusterID, and zdcName to your environment.
{"Tenant": "myTenant","ClusterID": myCluster,"ZdcName": "DEFAULT","customJmxMetrics": [{"name": "java.lang.CurrentThreadCount","source":{"domain": "java.lang","keyProperties": {"type": "Threading",},"attribute": "ThreadCount"}}]}
Metrics
Each metric has the following mandatory attributes:
| Field | Type | Description |
|---|---|---|
name | String | Sets the name of the metric in Dynatrace. It must start with a letter. Only alphanumeric characters or . are allowed. |
source | Object | Specifies how the metric is collected. For details, see the Source section below. |
Source
The source specifies how a metric is collected using JMX. Each source has the following mandatory attributes:
| Field | Type | Description |
|---|---|---|
domain | String | Domain name of the MBean. It can contain wildcards (*). |
keyProperties | Key, Value pairs | Key properties of the MBean. Values can contain wildcards (*). |
attribute | String | Name of the attribute that contains the metric value. |
Optional source attributes are:
| Field | Type | Description |
|---|---|---|
attributePath | String | See [CompositeData] below.(#compositedata) |
allowAdditionalKeys | Boolean | If true, additional key properties other than those specified in keyProperties are allowed but ignored. If false, the keyProperties need to match exactly; additional keys in the name will lead to a mismatch. |
calculateDelta | bool | If true, calculate the change in values of the given attribute. Value = attribute(t) - attribute(t-1). This is useful for monotonically increasing values. |
calculateRate | bool | If true, calculate the rate of changes per second. This is used in combination with calculateDelta to convert an absolute attribute (for example, Request Count) to a rate (for example, Requests per Second). Value = attribute / query interval. |
aggregation | String | Aggregates multiple values if more than one MBean matches the domain and key property filter. Default aggregation is SUM. Available aggregations are: SUM, AVG, MIN, MAX. For example, you can use this attribute to aggregate all MemoryPools and calculate their SUM or MAX value. |
splittings | List | Set splittings. |
AttributePath (CompositeData)
To extract values of individual keys returned as CompositeData type by an attribute, you need to use the attributePath mechanism and point to the key you're interested in.
For example, HeapMemoryUsage is a CompositeData type that returns the following list of value-key pairs:
{committed: integer,init: integer,max: integer,used: integer}
If you want to extract the value of used from the HeapMemoryUsage attribute, point the attributePath to the used key.
{"customJmxMetrics": [{"name": "java.lang.HeapMemoryUsage","source":{"domain": "java.lang","keyProperties": {"type": "Memory"},"attribute": "HeapMemoryUsage","attributePath": "get(\"used\")"}}]}
Splittings
Splittings can be used to define additional dimensions for a metric.
"splittings": [{"name": "dimension","keyProperty": "name"}]
Each splitting has the following mandatory attributes:
| Field | Type | Description |
|---|---|---|
name | String | Sets the name for this dimension. |
keyProperty | String | Defines which key property of the ObjectName of an MBean is used for splitting. See the keyProperties attribute of the source. |
The following example shows how to define a metric providing multiple dimensions within a single metric definition:
{"customJmxMetrics": [{"name": "java.lang.MemoryPoolUsage","source":{"domain": "java.lang","keyProperties": {"type": "MemoryPool","name": "*"},"attribute": "Usage","attributePath": "get(\"used\")","splittings": [{"name": "memory_type","keyProperty": "name"}]}}]}
Based on this metric definition, the following MBeans:
java.lang:type=MemoryPool,name=G1 Eden Spacejava.lang:type=MemoryPool,name=G1 Survivor Space
will result in a single metric in Dynatrace with two dimensions:
java.lang.MemoryPoolUsagewith the dimensionmemory_type=G1 Eden Spacejava.lang.MemoryPoolUsagewith the dimensionmemory_type=G1 Survivor Space
Monitoring
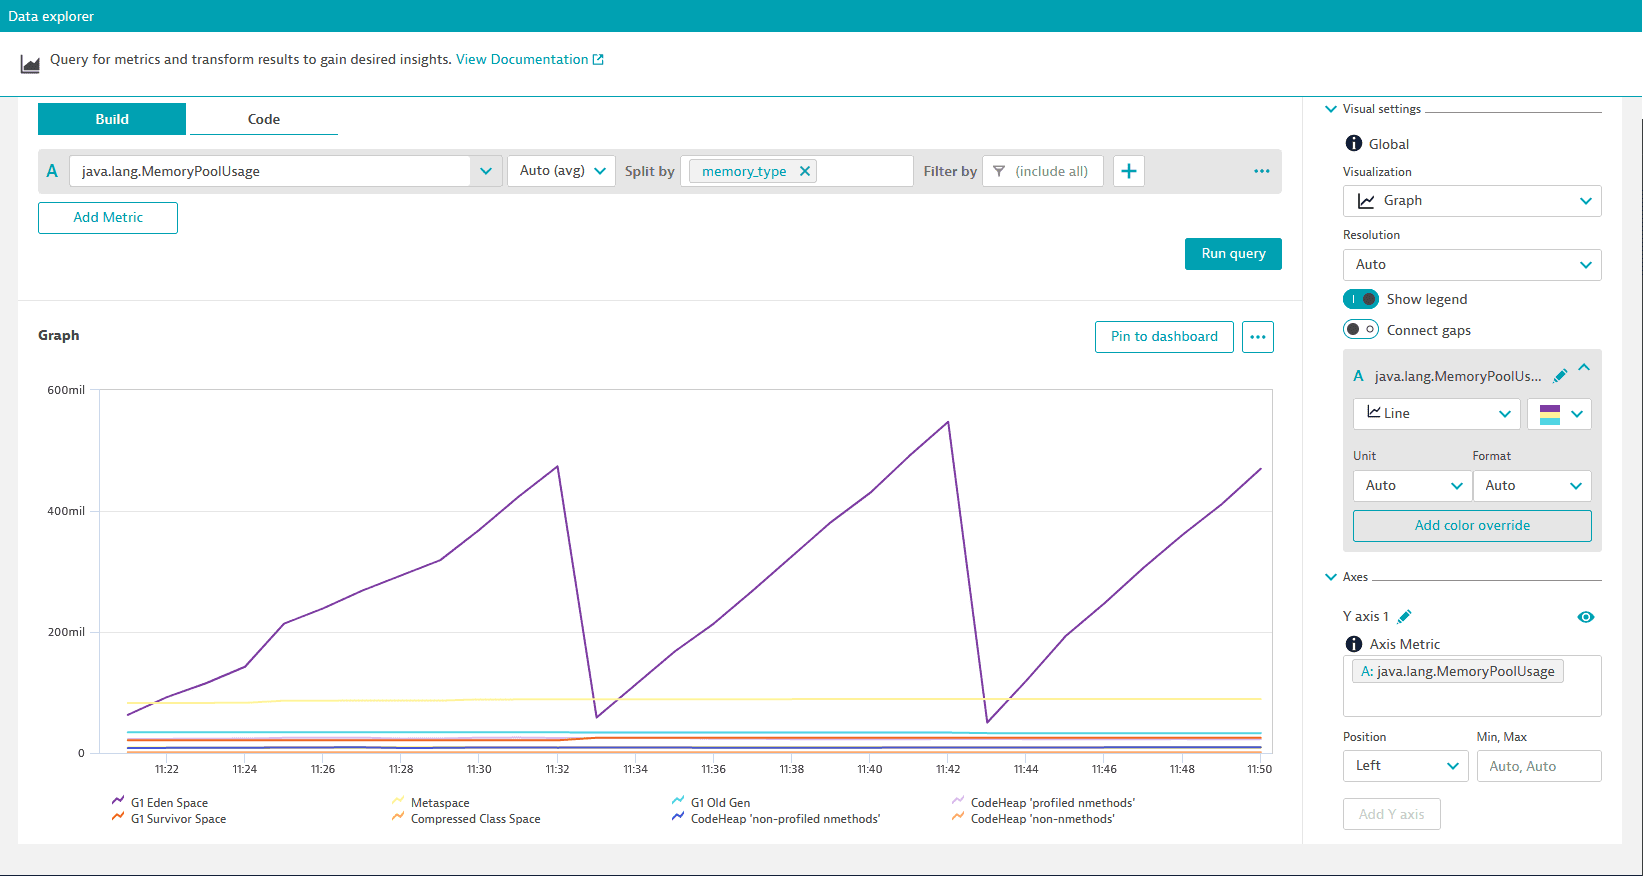
Go to Data Explorer to analyze and chart your custom JMX metrics. If needed, you can pin your charts to a dashboard. In the following example, you can see the java.lang.MemoryPoolUsage metric split by the dimension memory_type:
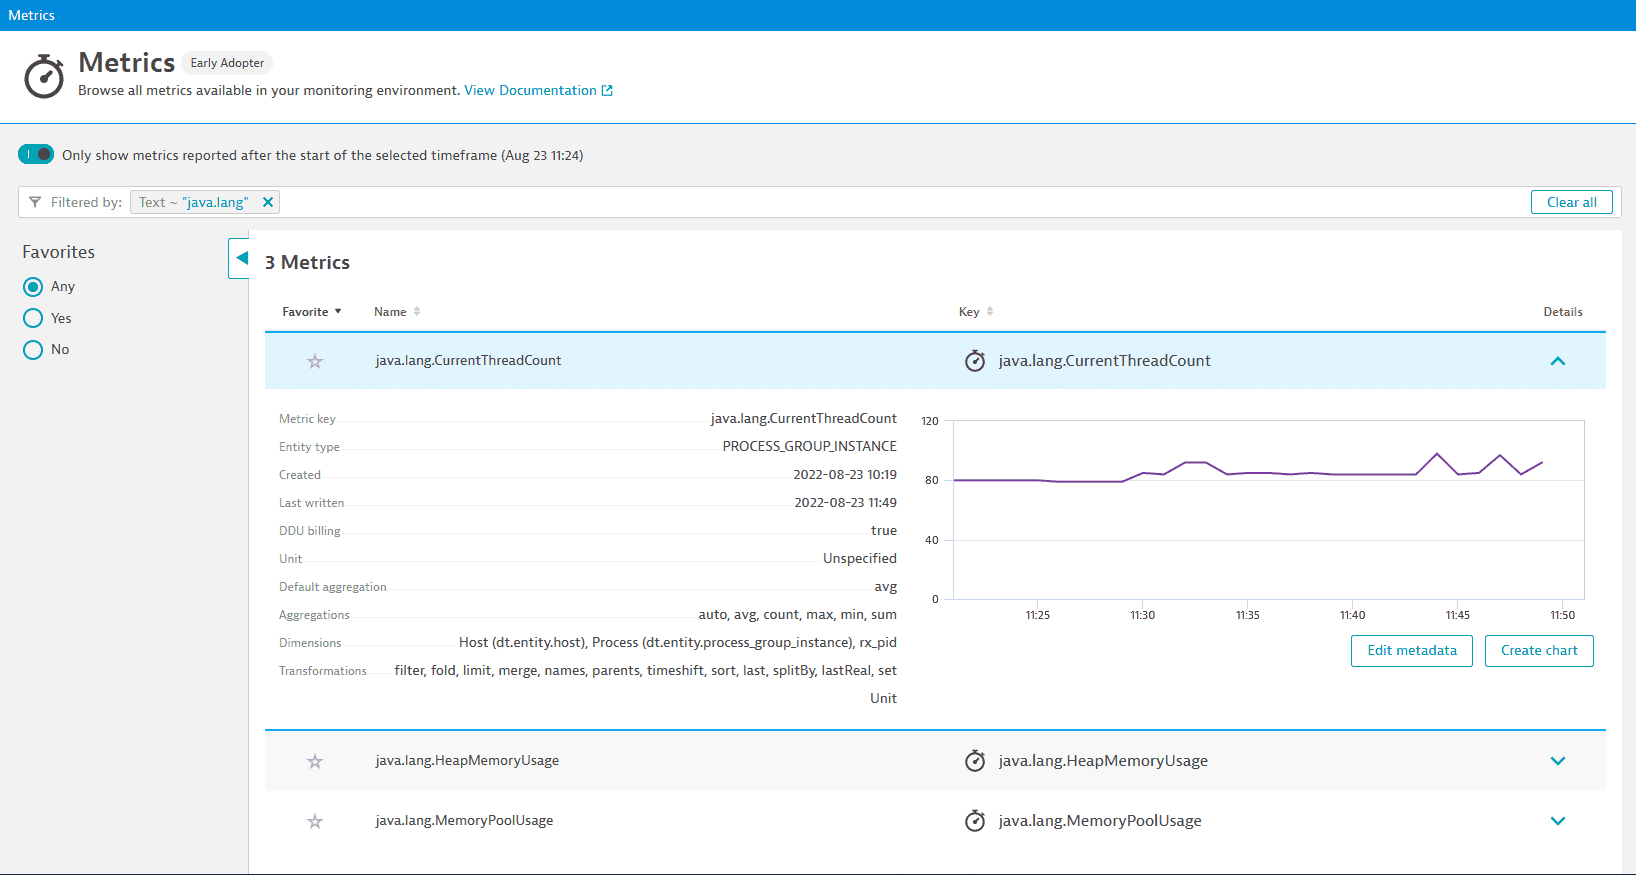
To get a list of metrics available in your monitoring environment, Go to Metrics to open the Metrics browser. In the following example, you can see the three metrics that we have created above: