Extract metrics from spans and distributed traces
- Latest Dynatrace
- Tutorial
- 5-min read
- Published Dec 23, 2025
This tutorial shows you how to extract metrics directly from your spans and distributed traces, via OpenPipeline, which provides flexible processing, enrichment, and routing at scale. New metrics can be calculated and derived based on any data available within the captured distributed trace, and the metrics can also be split by multiple dimensions, for example, a Kubernetes workload or a request attribute.
Who this is for
This article is intended for app users building long-term dashboard-ready metrics from traces.
What you will learn
How to set up OpenPipeline to extract a metric from a captured span via five examples you can adapt to your own services.
Before you begin
Prior knowledge
Prerequisites
- Dynatrace SaaS environment powered by Grail and AppEngine.
- Dynatrace Platform Subscription (DPS) with Traces powered by Grail (DPS) capabilities.
- OpenPipeline permissions:
settings:objects:readandsettings:objects:write. To learn how to set up the permissions, see Permissions in Grail. - Distributed Tracing permissions
Examples
Requests to a workload split by Kubernetes pod
This example shows the new, recommended way to get service instance-level insights, a concept that is going away. Extract metrics from spans and split by real deployment dimensions like Kubernetes workload, pod, host, and more.
For common splits such as namespace, cluster or cloud region, use the out-of-the-box primary Grail fields already available in service metrics; you don't need a new metric.
1. Find the condition for the relevant spans in Notebooks
-
Go to
 Notebooks and open an existing or new notebook.
 -
Select > DQL.
-
Use a DQL query to prototype your filters, fields, and groupings before you configure OpenPipeline. For example, to explore the spans that represent requests to the workload, you can use the following query:
fetch spans| filter k8s.workload.name == "my-otel-demo-frontend" and span.kind == "server" and isNotNull(endpoint.name)| fields k8s.pod.name, dt.entity.service, endpoint.name, duration| limit 200
span.kind == "server"only keeps inbound service-handled requests and excludes client or internal spans.isNotNull(endpoint.name)ensures the span represents a request to an endpoint that Dynatrace considers in its endpoint detection rules, and that it isn't a muted request, for example.
2. Create a pipeline for metric extraction
-
Go to
 Settings > Process and contextualize > OpenPipeline > Spans > Pipelines.
 -
Select an existing pipeline or create a new one. To create a new pipeline, select Pipeline and enter a name—for example,
TeamA Span metrics from Services. -
To configure metric extraction, go to Metric extraction > Processor > Sampling aware counter metric and define the processor by entering:
-
A descriptive name—for example,
Requests to my-otel-demo-frontend split by Kubernetes pod -
The matching condition:
k8s.workload.name == "my-otel-demo-frontend" -
The new metric key—for example,
span.my-otel-demo-frontend.requests_by_pod.count -
The metric dimensions:
-
Select Pre-defined and choose
k8s.pod.nameandk8s.pod.uidfrom the pre-defined dimensions. These dimensions identify the pods where the workload is running. Other dimensions have also been pre-selected, such asdt.entity.service. -
Select Save.
-
-
You successfully created a new pipeline to extract a metric containing information about how many requests there were for the my-otel-demo-frontend workload and, because the metric has the pod as a dimension, you'll be able to split the requests by pod. The new pipeline is visible in the pipelines list.
3. Route spans to the pipeline
Create a dynamic route that funnels the spans you're interested in into the team's pipeline.
- One span will be routed to exactly one dynamic route. Spans can't be routed to multiple dynamic routes, so keep matching conditions precise and mutually exclusive.
- Dynamic routes are evaluated from top to bottom; as soon as a matching condition evaluates to "true", the span is routed through that dynamic route.
-
Go to
Settings > Process and contextualize > OpenPipeline > Spans > Dynamic routing. -
To create a new route, select Dynamic route and specify:
-
A descriptive name—for example,
Spans for TeamA Cluster1 Namespace2 -
The matching condition:
k8s.cluster.name == "Cluster1" and k8s.namespace.name == "Namespace2"
-
-
Select Add.
You successfully created a new route. All spans of Kubernetes "Cluster1" and "Namespace2" are routed to the pipeline where a metric is extracted. The new route is visible in the routes list.
4. Query the metric
- Go to Notebooks and open an existing or new notebook.
- Select > Metrics > Select a metric.
- Enter and select the new metric key (
span.my-otel-demo-frontend.requests_by_pod.count). - Select Run.
You've successfully extracted a metric to track requests to the my-otel-demo-frontend workload.
- You can use a Kubernetes pod dimension to split this metric.
- Spans are routed to the new pipeline; when the span belongs to the
my-otel-demo-frontendworkload (matching condition of the processor), the new pipeline extracts a metric containing the pod where the workload is running, in addition to other details. - You can query the metric in
 Dashboards or Notebooks, or see it in
  Services or
 ") Kubernetes.
Kubernetes.
Number of books successfully sold per service
In this example, we describe the creation of the pipeline and the metric-extraction processor. For detailed steps, follow the approach of the workload split by Kubernetes pod example, but adapt the filter queries and routing.
The number of books sold is captured as a request attribute, for example, request_attribute.book_orders_count. Request attributes are exposed under request_attribute.__attribute_name__.
-
Go to
Settings > Process and contextualize > OpenPipeline > Spans > Pipelines. -
Select an existing pipeline or create a new one. To create a new pipeline, select Pipeline and enter a name—for example,
TeamA Span metrics from Services. -
To configure metric extraction, go to Metric extraction > Processor > Sampling aware counter metric and define the processor by entering:
-
A descriptive name—for example,
Number of books successfully sold per service -
The matching condition:
endpoint.name == "POST /book/{id}/checkout" and isNotNull(request_attribute.book_orders_count) and request.is_failed != true -
For the measurement type, select Custom, as we're not measuring durations.
-
The field name from which to extract the value (
request_attribute.book_orders_count). -
The sampling options enabled (leave as is), so that the metric extraction is sampling aware.
-
The new metric key—for example,
span.books.sold.count. -
The metric dimensions. You can use the pre-selected dimensions, as
dt.entity.serviceis selected by default.
-
-
Select Save.
You successfully created a new processor to extract a metric containing information about the number of books successfully sold, and, because the metric has the dt.entity.service service as a dimension, you'll be able to split the metric per service.
Top database calls per service and query group
In this example, we describe the creation of the pipeline and the metric-extraction processor. For detailed steps, follow the approach of the workload split by Kubernetes pod example, but adapt the filter queries and routing.
For this example metric, we want to know the top database operations or commands executed across our services. For example, the MongoDB command name, SQL keyword, Redis command name, together with the name of the target database (db.namespace).
We're not creating a metric for the actual db.query.text being executed (for example, SELECT * FROM user_table), as that would result in a metric with a very high cardinality.
To see a list of the actual queries being executed by your services, use the database query performance analysis in the Services app.
1. Add a new query group attribute to database spans
We'll add a new attribute to our database spans that contains the query group we're interested in having in our metric: db.operation.name + db.namespace. We can then use the newly created attribute in our metric extraction step.
-
Go to
Settings > Process and contextualize > OpenPipeline > Spans > Pipelines. -
Select an existing pipeline or create a new one. To create a new pipeline, select Pipeline and enter a name—for example,
TeamA Span metrics from Services. -
To add the new attribute to incoming database spans, go to Processing > + Processor > DQL and define the processor by entering:
-
A descriptive name—for example,
Construct low cardinality db.query.group -
The matching condition:
isNotNull(db.operation.name) and isNotNull(db.namespace) -
The DQL processor definition:
fieldsAdd db.query.group = concat(db.operation.name, " ", db.namespace)
-
You added a new db.query.group attribute to the database spans that you can now use to create your metric.
Before
{"db.namespace": "books","db.operation.name": "SELECT","db.query.text": "select b1_0.id,b1_0.author,b1_0.title from books b1_0 where b1_0.title=?"}
After
{"db.query.group": "SELECT books","db.namespace": "books","db.operation.name": "SELECT","db.query.text": "select b1_0.id,b1_0.author,b1_0.title from books b1_0 where b1_0.title=?"}
2. Use the new attribute in the metric extraction
-
Go to Metric extraction > Processor > Sampling aware counter metric and define the processor by entering:
-
A descriptive name—for example,
Database calls per service and query group -
The matching condition:
isNotNull(db.query.group) -
The field name from which to extract the value (
request_attribute.book_orders_count). -
The sampling options enabled (leave as is), so that the metric extraction is sampling aware.
-
The new metric key—for example,
span.service.db_calls_by_group.count. -
The metric dimensions. Select Custom and choose
db.query.groupas the Field name on record. For the service dimension,dt.entity.serviceis selected by default.
-
-
Select Save.
You successfully created a new processor to extract a metric containing information about the database calls per service and query group.
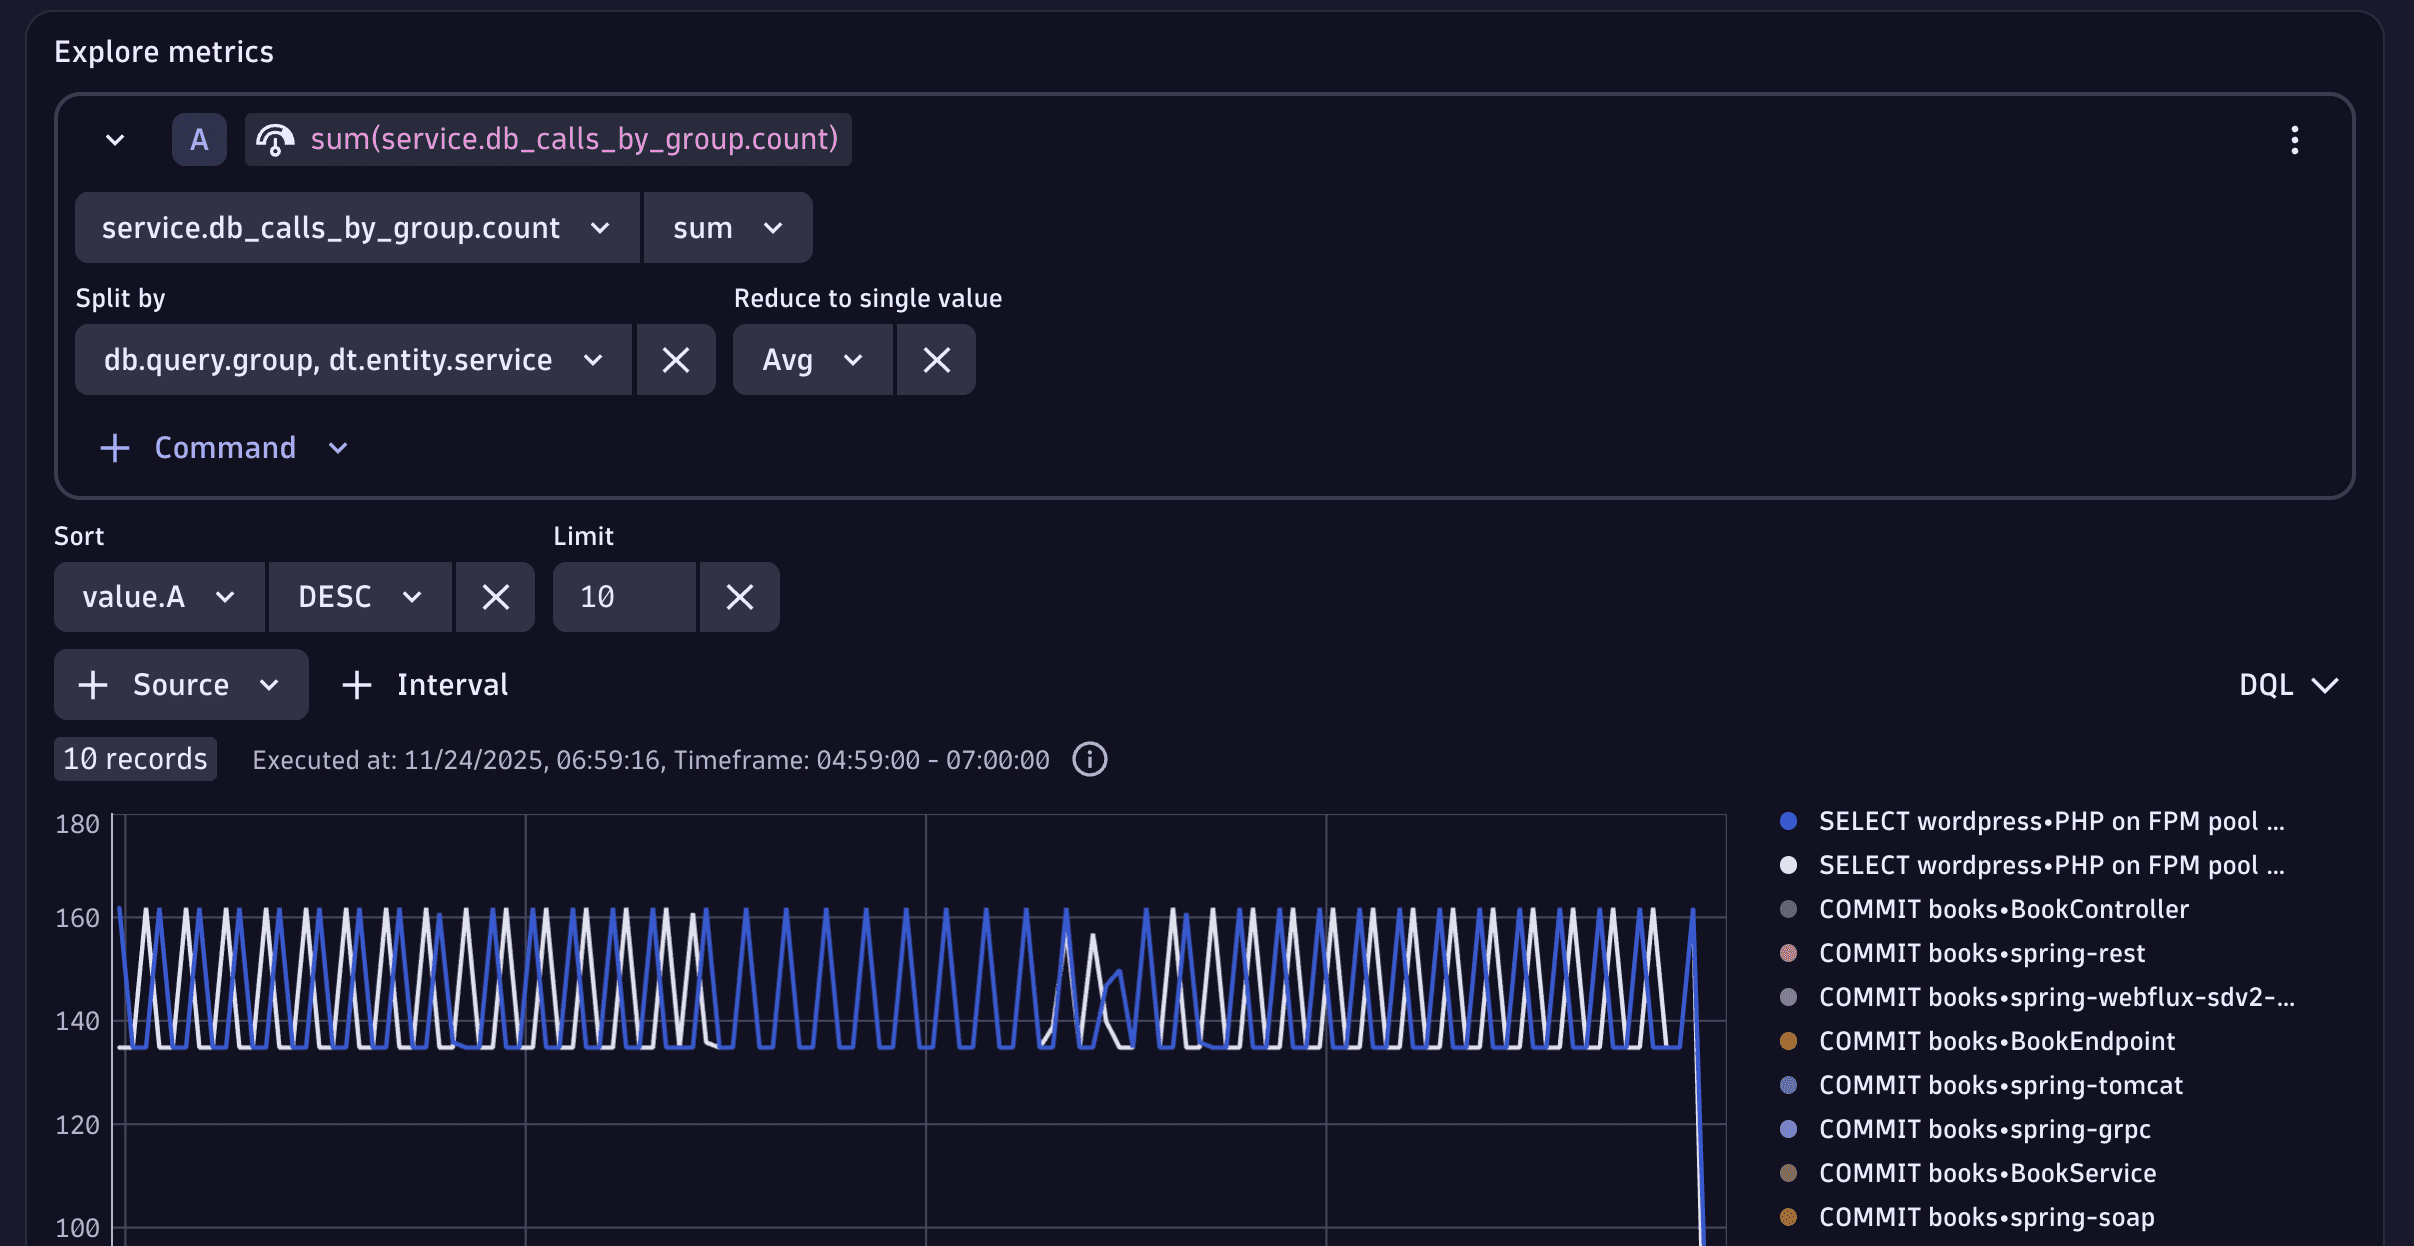
3. Query the top 10 values
In Notebooks or Dashboards, use Explore interface for Metrics to plot the span.service.db_calls_by_group.count:
- Split by
db.query.groupanddt.entity.service - Sort by the
value.Ametric in aDESCorder - Use Limit
10to display the top 10 results
CPU time per service endpoint
In this example, we describe the creation of the pipeline and the metric-extraction processor. For detailed steps, follow the approach of the workload split by Kubernetes pod example, but adapt the filter queries and routing.
-
Go to
Settings > Process and contextualize > OpenPipeline > Spans > Pipelines. -
Select an existing pipeline or create a new one. To create a new pipeline, select Pipeline and enter a name—for example,
TeamA Span metrics from Services. -
To configure a value metric extraction, Metric extraction > Processor > Sampling aware value metric and define the processor by entering:
-
A descriptive name—for example,
CPU time per service endpoint -
The matching condition:
request.is_root_span == trueThis condition ensures that we’ll be capturing the first span of a request within a service. That is, the span where endpoint detection rules are evaluated.
-
For the measurement type, select Custom, as we're not measuring durations.
-
The field name from which to extract the value (
span.timing.cpu). This attribute tracks the overall CPU time spent executing the span, including the CPU times of child spans that are running on the same thread on the same call stack. -
The sampling options enabled (leave as is), so that the metric extraction is sampling aware.
-
The new metric key—for example,
span.request.cpu_time. -
The metric dimensions:
-
Select Pre-defined and choose
endpoint.namefrom the pre-defined dimensions. Other dimensions also get pre-selected, such asdt.entity.service. -
Select Save.
-
-
You successfully created a new processor to extract a metric containing information about the CPU time consumed per endpoint. The CPU-time field is measured in nanoseconds.
Response time for outbound calls to paypal.com per service, as measured by the caller
Histogram metric extraction support is coming soon.
Later in 2026, Dynatrace will provide out-of-the-box metrics for third-party calls, as part of the modernization of Monitor third-party services.
In this example, we describe the creation of the pipeline and the metric-extraction processor. For detailed steps, follow the approach of the workload split by Kubernetes pod example, but adapt the filter queries and routing.
-
Go to
Settings > Process and contextualize > OpenPipeline > Spans > Pipelines. -
Select an existing pipeline or create a new one. To create a new pipeline, select Pipeline and enter a name—for example,
TeamA Span metrics from Services. -
To configure a histogram metric extraction, go to Metric extraction > Processor > Sampling aware histogram metric and define the processor by entering:
-
A descriptive name—for example,
Response time for outbound calls to paypal.com per service, as measured by the caller. -
The matching condition:
span.kind == "client" and matchesValue(server.address, "*.paypal.com") -
Measurement set to Duration.
-
The new metric key—for example,
span.outbound_paypal_requests.response_time. -
The metric dimensions—you can use the pre-selected dimensions, as
dt.entity.serviceis selected by default.
-
-
Select Save.
You successfully created a new processor to extract a metric containing the response time for outbound calls to paypal.com, as measured by the caller. Also, because the metric has the calling service (dt.entity.service) as a dimension, you'll be able to split the metric per service.
 OpenPipeline