Application Security FAQ
- Troubleshooting
See below for answers to some of the most frequently asked questions about Dynatrace Application Security, grouped by topics.
For troubleshooting articles related to Application Security, visit Dynatrace Community.
Detection and monitoring
How can I detect security risks in my applications?
With Dynatrace Application Security, you can not only identify and monitor vulnerabilities in applications (third-party libraries, application runtimes, custom code) in your production and pre-production environments, but also detect and block attacks on your applications automatically and in real time.
To get started
- Activate and enable Application Security.
- Select any of the options below:
- To detect and monitor third-party vulnerabilities, enable third-party vulnerability detection, then go to Third-Party Vulnerabilities.
- To detect and monitor code-level vulnerabilities, enable code-level vulnerability detection, then go to Code-Level Vulnerabilities.
- For a unified view of third-party and code-level vulnerabilities and information about host coverage, enable Runtime Vulnerability Analytics, then go to Security Overview.
- To detect and monitor attacks on vulnerabilities, enable Runtime Application Protection, then go to Attacks.
What's the difference between the classic monitoring rules and the new monitoring rules?
The new monitoring rules let you include or exclude processes, Kubernetes nodes, and hosts based on resource attributes and Kubernetes labels. This approach is more flexible and precise, works well in dynamic and cloud‑native environments, and supports previews so you can verify which entities match before enabling the rules. These rules are recommended and are the default for newer environments.
The classic monitoring rules rely on process group tags, host tags, and management zones. They offer less granularity, depend on correct tagging, and don't provide the same level of preview or control. Classic rules still work but are scheduled for deprecation and can't be used at the same time as the new rules.
How do RVA and RAP work?
- To learn about the Runtime Vulnerability Analytics (RVA) mechanism, see How RVA works.
- To learn more about the Runtime Application Protection (RAP) mechanism, see How RAP works.
What's the impact of enabling Application Security?
What should I consider before enabling Application Security? Can it impact anything?
When you enable Application Security (Runtime Vulnerability Analytics or Runtime Application Protection), keep the following in mind:
- Consumption:
Runtime Vulnerability Analytics and Runtime Application Protection consume GiB-hours if you're using the Dynatrace Platform Subscription (DPS) licensing model, or Application Security units (ASUs) if you're using the Dynatrace classic licensing. - Network bandwidth usage:
- Code‑level vulnerability detection and attack detection: Expect a slight increase in network usage, depending on the number of monitored applications. In most cases, this overhead is negligible.
- Third‑party vulnerability detection: No additional process overhead is introduced.
How can I disable security monitoring?
-
To disable Runtime Vulnerability Analytics
- Go to Settings > Application Security > Vulnerability Analytics > General settings.
- Under Third-party Vulnerability Analytics, turn off Enable Third-party Vulnerability Analytics.
- Under Code-level Vulnerability Analytics, turn off Enable Code-level Vulnerability Analytics.
-
To disable Runtime Application Protection
- Go to Settings > Application Security > Application Protection > General settings.
- Turn off Enable Runtime Application Protection.
Can I manually start a security scan?
Does Application Security perform a scheduled job? What's the scheduled time interval? Can I manually start a security scan after deploying our changes in the environment?
There are no scheduled scans. Once you enable any Dynatrace Application Security functionality, your environment is automatically monitored for the selected functionality continuously and in real time.
Restrict permissions
How can I give someone view-only access to vulnerabilities?
To restrict specific users to view-only access, so they can view but not manage vulnerabilities, see Customize access.
Resolution
Does Dynatrace remediate vulnerabilities?
Will Dynatrace fix vulnerabilities or do I need to take any action to fix them?
Dynatrace does not remediate vulnerabilities. It identifies and monitors vulnerabilities in applications in your production and pre-production environments, and it helps you determine the root cause by providing rich context and information that helps you take the appropriate actions. For more information about capabilities, see Runtime Vulnerability Analytics: Capabilities.
Once the root cause is gone, the vulnerability is automatically resolved. For more information about vulnerability resolution, see:
How do I fix detected vulnerabilities?
The rich and precise context and details provided on the vulnerabilities pages help you identify and understand vulnerabilities, prioritize them by risk, and automatically monitor and alert on newly discovered vulnerabilities. Based on this information, you can determine what actions are needed to fix the vulnerabilities.
For example, for third-party vulnerabilities, you can
- Use the recommended fixes from Davis Security Advisor to upgrade to a non-vulnerable version of the vulnerable component
- Set up tracking links for affected entities and follow up with their remediation progress
When is a vulnerability marked as resolved?
I removed the vulnerable component, but the vulnerability still shows as open. When does it get resolved?
A vulnerability is marked as Resolved under the following conditions:
-
No process group or Kubernetes node has reported any vulnerable components for more than two hours.
-
The root cause of the vulnerability is no longer present; for example, the vulnerable component has been removed or the affected process has been terminated.
This condition applies regardless of how much time has passed since the last report.
Why is my vulnerability still open if there's no affected process group anymore?
A vulnerability is still reported if it's still present in other management zones. To see the affected process groups, select All in the management zone filter.
Can a vulnerability be resolved while there are still affected entities?
No. A vulnerability is resolved if there are no longer any affected entities.
Why are some vulnerabilities resolved without any mitigation?
After enabling Runtime Vulnerability Analytics, 19 critical vulnerabilities were found. Now they are down to three without any mitigation from our side. Why are some vulnerabilities resolved without any mitigation?
A vulnerability is resolved automatically if the root cause is no longer present. To learn more, see
Why do some vulnerabilities keep being resolved and reopened?
A vulnerability keeps being resolved and reopened when a process using the vulnerable library isn't running all the time:
-
When the process is terminated, the vulnerability is resolved.
-
When the process is restarted, the vulnerability is reopened.
For details about the reasons why vulnerabilities are resolved and reopened, see Resolution.
To determine which processes are affected, access the remediation tracking for processes.
Why do resolved vulnerabilities show up in every management zone?
Management zone information is not directly attached to a vulnerability. It derives from the vulnerable entities that are affected by the respective vulnerability: a process in a management zone that uses a vulnerable library causes a third-party vulnerability in the respective management zone.
A vulnerability is resolved if there are no vulnerable entities anymore. In the vulnerability list, all resolved vulnerabilities displayed are not filterable by management zone anymore, as that information is not attached to them.
Why am I getting zero resolved process groups for resolved vulnerabilities in my management zone?
For resolved vulnerabilities, I would like to examine resolved process groups to understand which entities were previously affected, but there are zero resolved process groups in my management zone. Why?
On the Vulnerabilities pages, in the Process group overview section, if there are zero resolved process groups displayed for a resolved vulnerability in your management zone, it means that none of the entities that were previously affected and resolved are in that management zone. To find the respective entities, switch the management zone filter to All.
Restart required
Is restart required after enabling or disabling an Application Security feature or functionality?
See below the restart requirements by functionality.
-
Third-party vulnerabilities: An application process restart is required in the following case:
- In Discovery mode, after you enable code-module injection
-
Code-level vulnerabilities: An application process restart is required in the following cases:
- After each step in Enable code-level vulnerability detection:
- Enable Code-level Vulnerability Analytics
- Configure the global code-level vulnerability detection control per technology
- Enable OneAgent monitoring
- After you enable a monitoring rule
- After each step in Enable code-level vulnerability detection:
-
Attacks: An application process restart is required in the following cases:
- After each step in Get started with Runtime Application Protection:
- Enable Runtime Application Protection
- Define the global attack control per technology
- Enable OneAgent monitoring
- After you enable a monitoring rule
- After each step in Get started with Runtime Application Protection:
Why is there a "Restart required" notification on some Application Security pages?
OneAgent version 1.279+
See How can I know if information about vulnerable functions is outdated and what can I do about it?.
Notifications and reporting
How can I get notifications for vulnerabilities?
You can set up notifications through your preferred channels.
-
For example, you can trigger alerts
- When a vulnerability is reopened (Vulnerability (re)opened)
- When a new process group in a management zone becomes affected by a vulnerability (New Management zone affected)
How can I get notifications for attacks?
You can set up notifications through your preferred channels.
How can I create reports and share them with others?
-
With the Dynatrace API, you can chart Application Security metrics and pin them to your dashboard. For example, you can retrieve all security problems detected in your applications or the vulnerable functions of a security problem.
-
With Data Explorer, you can share your metric results and export them to a CSV file.
How can I stop receiving notifications for an irrelevant vulnerability or entity?
If you think a vulnerability or an entity isn't relevant or is a false positive, you can:
- Mute (silence) the vulnerability. For details, see Change the third-party vulnerability status and Change the code-level vulnerability status
- Mute (silence) the entity. For details, see Change vulnerability status of process groups and Change vulnerability status of nodes.
Why do we keep receiving notifications for the same vulnerability?
We have configured security notifications through email, but every day we receive notifications for the same vulnerability ID, with the same process group, entity name, and entity link. We have other vulnerabilities detected, but no extra notifications are sent. Why do we keep receiving notifications for the same vulnerability?
A process that does not run all the time might be using a vulnerable library. For details, see Why do some vulnerabilities keep being resolved and reopened?. To stop receiving notifications for this vulnerability, you can:
- Exclude the respective process from Application Security monitoring by setting up a third-party monitoring rule/code-level monitoring rule.
- Mute the third-party vulnerability/mute the code-level vulnerability.
How can I fetch fix recommendation information for vulnerabilities?
To retrieve remediation guidance for a specific vulnerability, call the Dynatrace API endpoint for an individual vulnerability. Provide the vulnerability ID and request the recommendationDescription property in response.
For details, see Vulnerabilities API - GET vulnerability details.
Coverage
How can I see which hosts are covered by Application Security?
Go to Security Overview. In the Host coverage section, select Monitored hosts to go to the Hosts page filtered by monitored hosts. For details, see Application Security overview: Host coverage.
Why do I see a vulnerability on one host but not on another?
Vulnerability detection depends on the data Dynatrace receives from each host. If a host is missing required instrumentation or configuration, Dynatrace may not be able to detect or confirm a vulnerability on that host. Common causes include missing OneAgent injection, auto‑injection disabled, outdated OneAgent versions, or unsupported runtimes.
Limit monitoring
How can I exclude specific entities from being monitored by Runtime Vulnerability Analytics?
You can:
Your custom rules override the global third-party vulnerability detection control setting. Any entity that doesn't match one of your rules will follow the global third‑party vulnerability detection setting.
Where can I find examples of monitoring rule configurations?
If you need guidance for setting up monitoring rules in common scenarios such as monitoring only specific hosts, processes, Kubernetes namespaces, Kubernetes nodes, or excluding certain processes, you can refer to Use cases for new monitoring rules. It provides practical examples that show how to configure rules for a variety of environments and requirements.
How can I limit Runtime Vulnerability Analytics monitoring to a specific management zone?
Create a monitoring rule that says Do not monitor if the management zone does not equal <your-management-zone>. After you add, edit, or remove a rule, allow up to 15 minutes for your changes to take effect.
How can I enable Runtime Vulnerability Analytics only for specific hosts or Kubernetes namespaces?
To enable Runtime Vulnerability Analytics only for selected parts of your environment, create monitoring rules that apply to the specific hosts or Kubernetes namespaces you want to monitor.
You can follow these example use cases:
These examples show how to disable global monitoring and then create resource‑attribute monitoring rules that selectively enable monitoring for the entities you choose.
Change status
If a vulnerability is muted, are the affected entities muted as well?
No. The MUTE state does not automatically transfer to its affected entities; there is no interdependence between the two when assessing this state.
Status updates
What does "last update" on vulnerabilities list pages refer to?
On the third-party and code-level vulnerabilities list pages, does "Last update" refer to the last time when Dynatrace provided an update? How can I request an update for a vulnerability which was last updated two days ago?
Last update refers to the last time when a vulnerability had a status change. It does not refer to the last time when Dynatrace provided an update. For details, see FAQ: Can I manually start a security scan?.
What are status changes
A status change can be when:
- The vulnerability is resolved or reopened
- The vulnerability is muted or unmuted
- The number of affected process groups has decreased or increased
- The risk assessment has changed
- The Davis Security Score has changed
- A new software component is detected
In the example below, it's been eight hours and six minutes since the risk assessment changed.
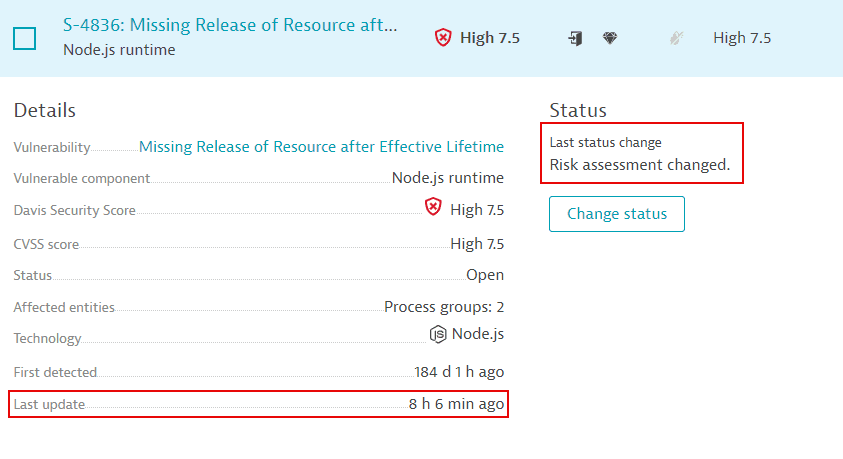
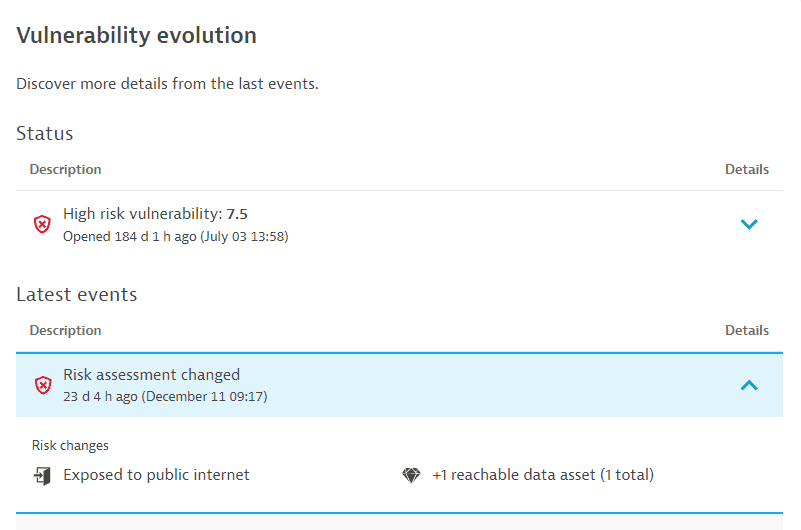
You can find details about the status change on the vulnerability details page, under Vulnerability evolution > Latest events.
Different values
Why are there different values on the vulnerabilities page versus Data Explorer?
In Third-Party Vulnerabilities, on the Third-party vulnerabilities list page, when I filter for resolved vulnerabilities over the last seven days, I get 3 vulnerabilities. When I use the metric query (builtin:security.securityProblem.resolved.new.global) in Data Explorer, I get 25. Why are there different values on the vulnerabilities page versus Data Explorer?
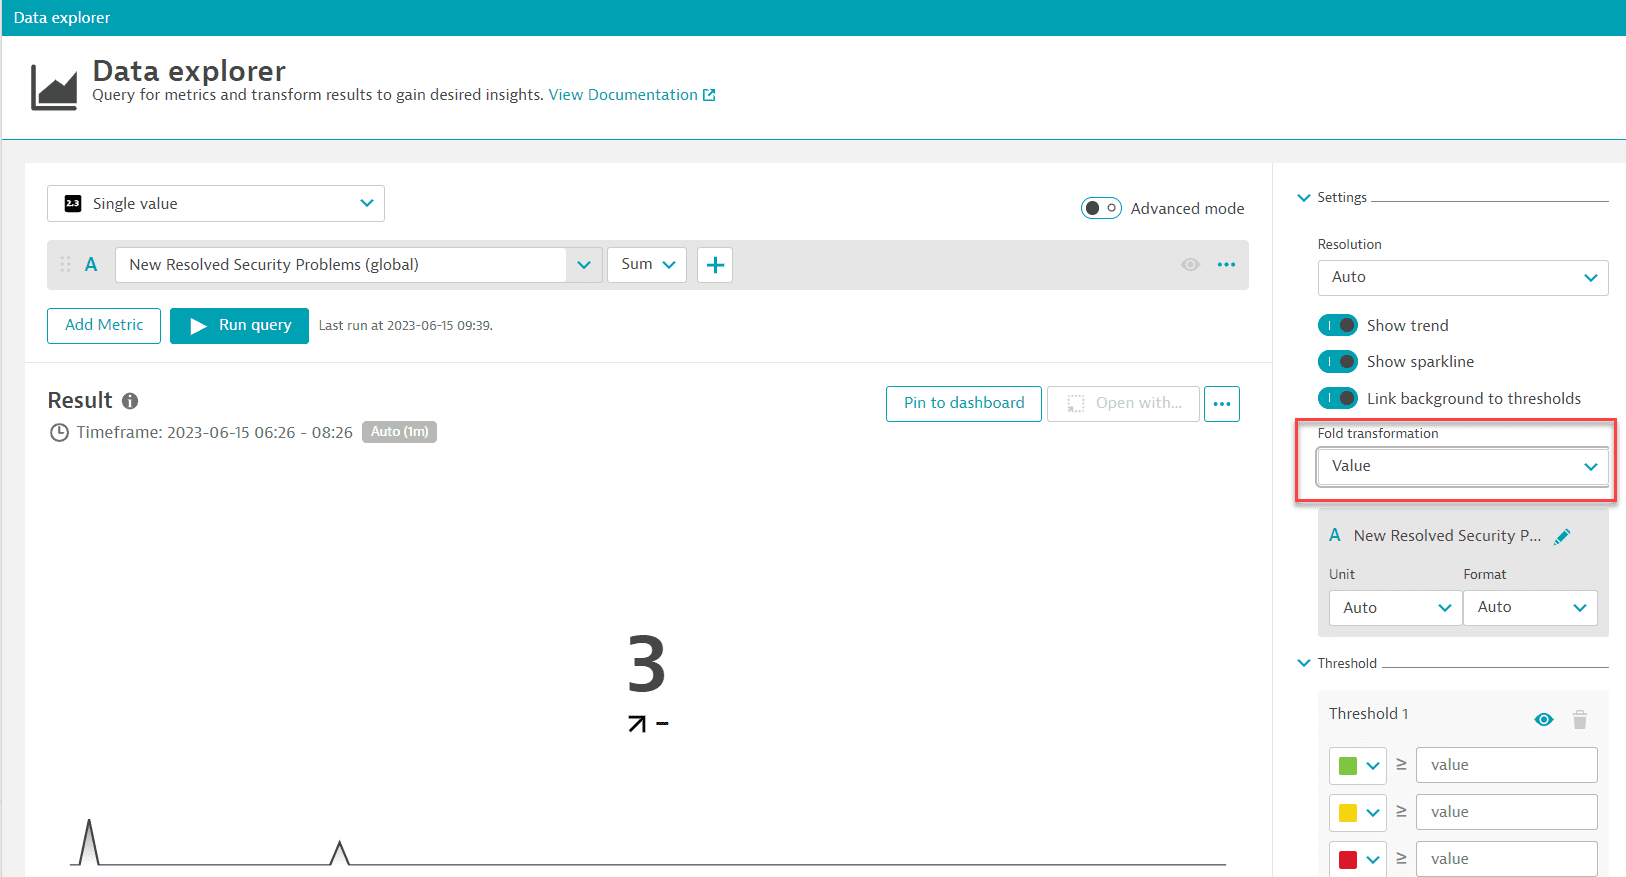
The vulnerability list shows the current state (the total count of vulnerabilities that are currently resolved), while using the metric query in Data Explorer shows the change over time.
For example, if two vulnerabilities are open and resolved several times over a period of time, the Data Explorer chart shows only one spike (which is the maximum over the given timeframe) while the vulnerabilities page shows two (because there are currently two resolved vulnerabilities).
To find out how many vulnerabilities were resolved in the given timeframe using the metric query
-
In Data Explorer, set the visualization type to
Single value. -
Expand Settings and set Fold transformation to
Value.This shows how many times the vulnerabilities were resolved during the selected timeframe.
Why are there different values on the Third-party vulnerabilities and vulnerability details pages?
There can be two reasons why values on these pages don't match:
Different number of affected entities
In Third-Party Vulnerabilities, the number of affected entities (process groups or hosts) on the Third-party vulnerabilities page (in the Affected entities column for a specific vulnerability) may differ from the number of affected entities on the vulnerability details page for the following reasons:
-
On the Third-party vulnerabilities page:
-
Affected entities aren't filtered by management zone.
-
Calculations take place every 15 minutes.
-
-
On the vulnerability details page:
-
Affected entities are filtered by management zone.
-
Current data is considered.
-
Different risk factors
In Third-Party Vulnerabilities, the assessment of risk factors (Public exploit, Public internet exposure, Reachable data assets, Vulnerable functions in use) in the infographic on the vulnerability details page and the Davis Security Score column on the Third-party vulnerabilities page may be different from the assessment of risk factors on the vulnerability details page (in the Vulnerability details section) for the following reason:
For the infographic on the vulnerability details page and the Davis Security Score column on the Third-party vulnerabilities page, calculations take place every 15 minutes For the Vulnerability details section on the vulnerability details page, current data is considered.
Why does my vulnerability have a different risk assessment and Davis Security Score than its affected entities?
A vulnerability is an aggregation of all its affected entities in your environment; therefore, it can have different values (risk assessment and Davis Security Score) than its affected entities. For example, the risk score of an affected entity might be 8.0, while the score of the aggregated vulnerability is 9.0. At the same time, if at least one affected entity is exposed to the internet, the aggregated vulnerability is also exposed to the internet.
Why does my vulnerability have a different risk assessment and Davis Security Score in different management zones?
A vulnerability is an aggregation of all its affected entities in the respective management zone; therefore, it can have different values (risk assessment and Davis Security Score) in different management zones. For example, the risk score of a vulnerability in one management zone might be 8.0, while the score of the same vulnerability in another management zone is 9.0. At the same time, if at least one affected entity is exposed to the internet, the aggregated vulnerability is also exposed to the internet.
Why am I seeing different vulnerabilities in production vs non-production environment?
You have the same vulnerabilities in two environments only if all of the following are the same in both environments:
- Deployment (including the OneAgent version)
- Settings
- Application usage
- Traffic
Public internet exposure
How is public internet exposure determined?
On Linux hosts, if there's no information, which can happen in different monitoring modes or because something went wrong, public internet exposure is detected via eBPF. Potential states are Public network and Not detected.
To determine public internet exposure, Dynatrace:
- Evaluates all the IP addresses detected in the last hour.
- Discards the private IP ranges.
- Groups the remaining IPs by subnet.
As soon as the respective subnets reach a certain (low) threshold, public internet exposure is triggered.
Vulnerable libraries
Does Dynatrace detect vulnerable libraries that aren't in use?
Runtime Vulnerability Analytics focuses on the runtime aspect, aiming to provide a prioritized list of vulnerabilities that are relevant to your running environments. For this purpose, Dynatrace only reports libraries that are actively used.
Where can I see the origin of a vulnerable library?
On the remediation tracking pages for process groups and processes affected by a vulnerability, you can see where the software component has been loaded from.
This feature is displayed for vulnerable Java, .NET, Node.js, Python, and Go software components.
Note that to display the origin of .NET software components, the minimum OneAgent version required is OneAgent version 1.301+.
Example:
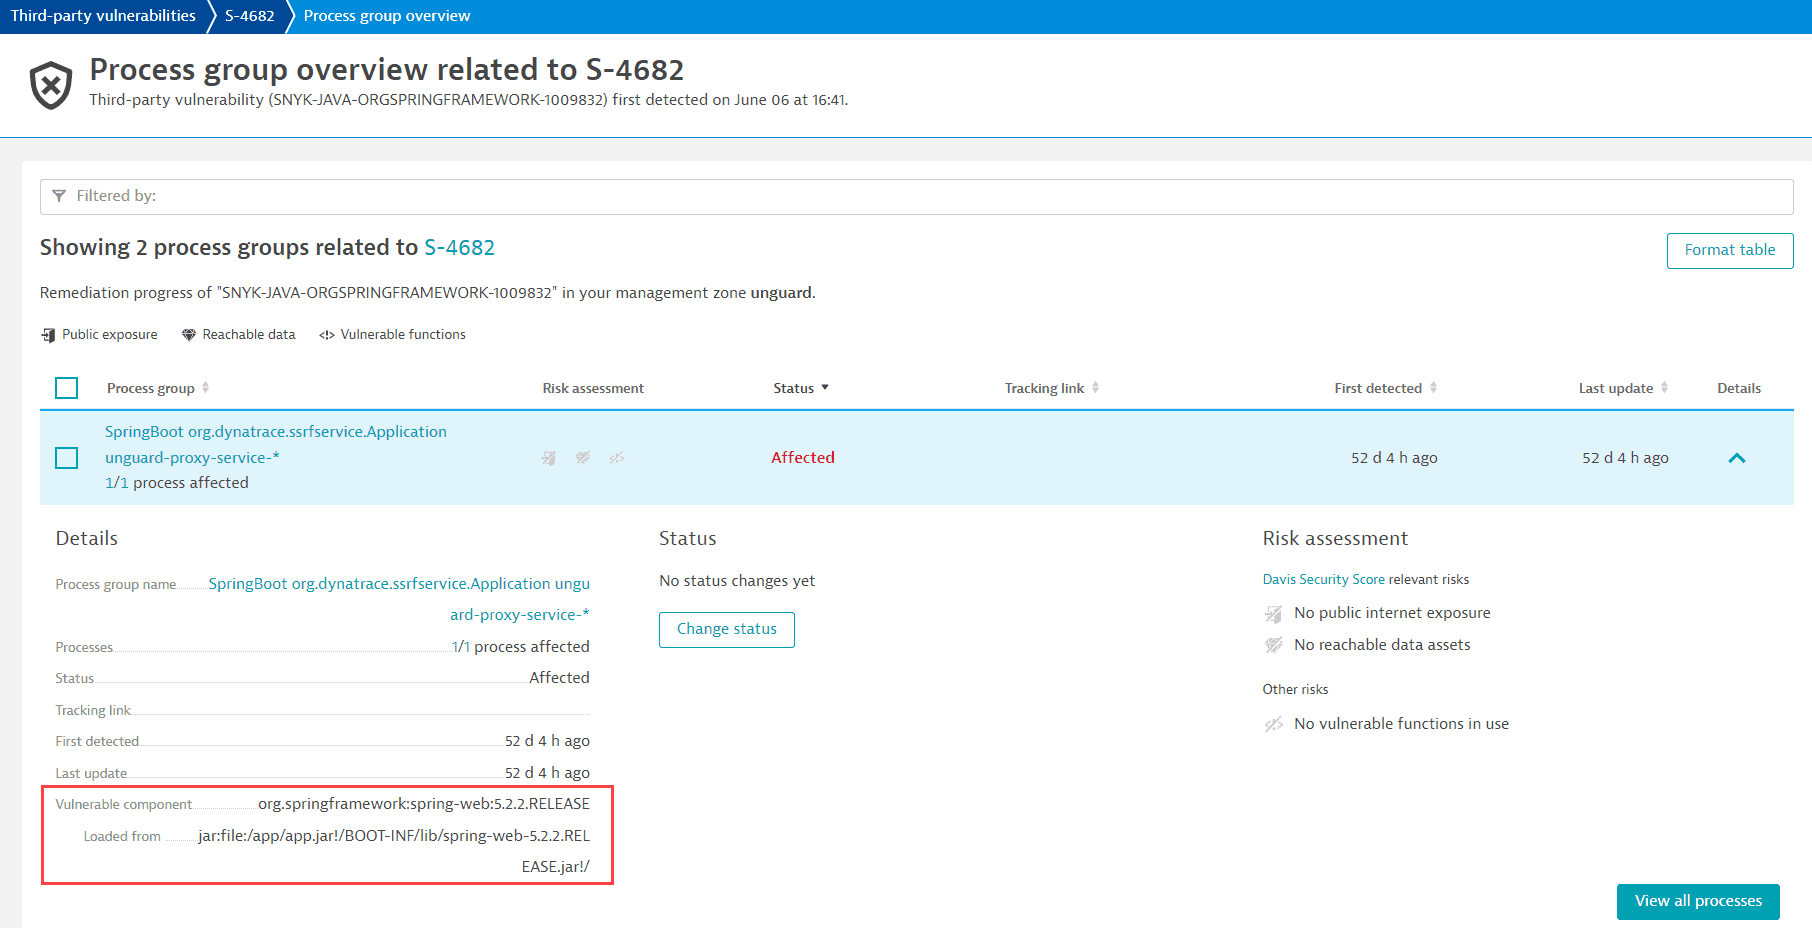
For information on how to navigate there, see Remediation tracking.
Vulnerable functions
How are vulnerable functions determined?
-
If the Dynatrace Vulnerability feed provides information about the vulnerable function, and OneAgent monitoring for Java vulnerable functions is enabled, OneAgent determines whether the vulnerable function is in use.
-
If the Dynatrace Vulnerability feed provides information about the vulnerable function, but the OneAgent feature is disabled, the number of vulnerable functions is displayed as Not available.
For more information about the Dynatrace Vulnerability feed, see Third-party vulnerability feeds.
Why is there no information on vulnerable functions?
There are two cases when information about vulnerable functions is not available:
- If no vulnerable function information is provided by the Dynatrace security research team.
- For runtime vulnerabilities, which are based on the NVD feed.
Why is there no data available for vulnerable functions?
-
Once you enable Third-party Vulnerability Analytics, it will take some time (one hour at the most) until data about vulnerable functions is displayed.
-
OneAgent monitoring for Java vulnerable functions is disabled. To enable it, see Enable OneAgent monitoring for Java vulnerable functions.
The OneAgent feature must be enabled for all processes affected by the vulnerability. For instructions on how to enable OneAgent monitoring, see Enable OneAgent monitoring for Java vulnerable functions.
-
No vulnerable functions of the vulnerability are contained in the release version of the third-party libraries (software components) in use.
-
No vulnerable functions are provided by the Dynatrace security research team.
-
You need to restart the processes affected by the vulnerability for updated information. For details, see FAQ: How can I know if information about vulnerable functions is outdated and what can I do about it?.
How do I know which processes to restart?
If you see the Restart required notification on the details page of a vulnerability, follow the steps below to determine which processes you need to restart:
- On the Process group overview card, select View all process groups.
- Filter by
Vulnerable functions: Restart required. - For each of the resulting process groups, select Details, then select the link provided in the Restart required notification to navigate to the list of processes that require a restart.
Example result:
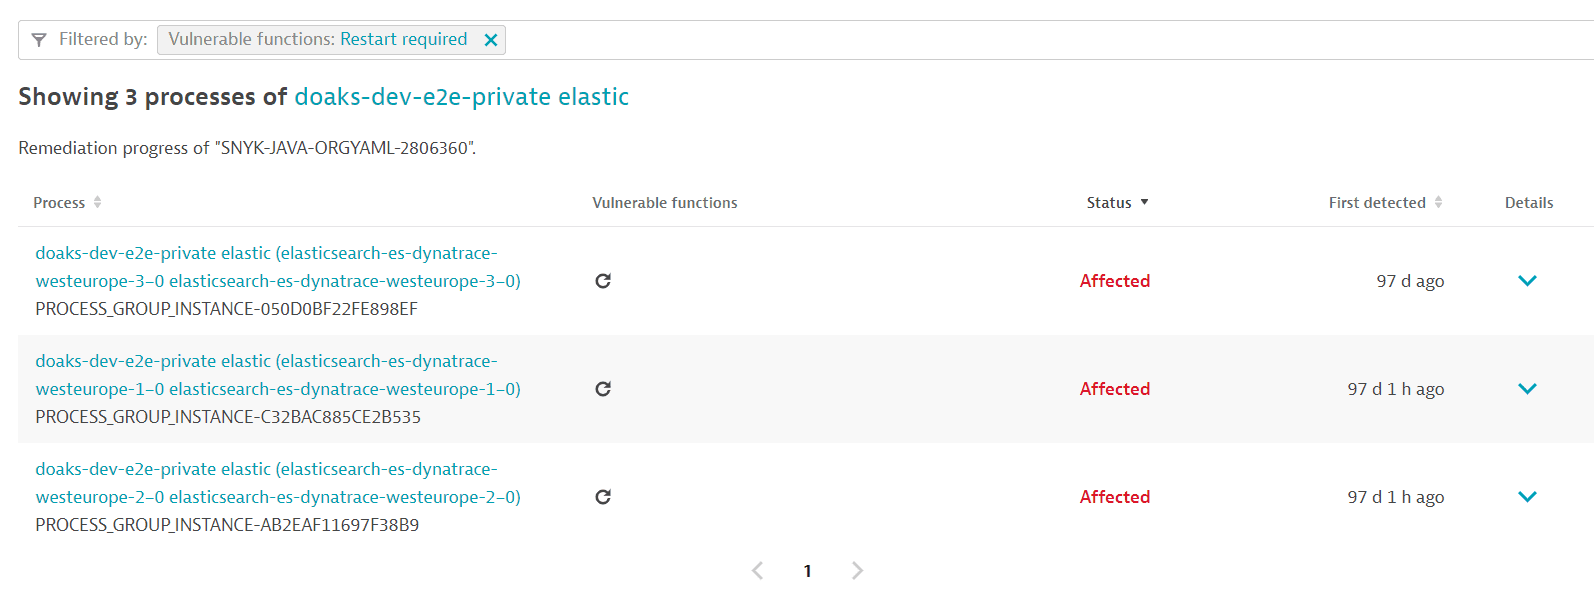
After a process restart, it takes about a minute for the updated information to be displayed.
This feature only works if OneAgent monitoring for Java vulnerable functions is enabled.
Why does my process still need to be restarted after I already restarted it?
If you followed the instructions to identify the process and restarted it, and the process still requires a restart (the same Restart required notification shows up, and the information about vulnerable functions is unchanged), this can happen in Kubernetes deployments if there's no persistent storage.
To fix this issue, add persistent storage by mounting file storage that isn't deleted when restarting your pods.
How can I know if information about vulnerable functions is outdated and what can I do about it?
OneAgent version 1.279+
If new information about a vulnerability's vulnerable functions is available, a process restart is required so that OneAgent can pick up and use the new data. In this case, a Restart required notification or symbol is displayed on
-
A vulnerability's details page (in Vulnerability details > Vulnerable functions)
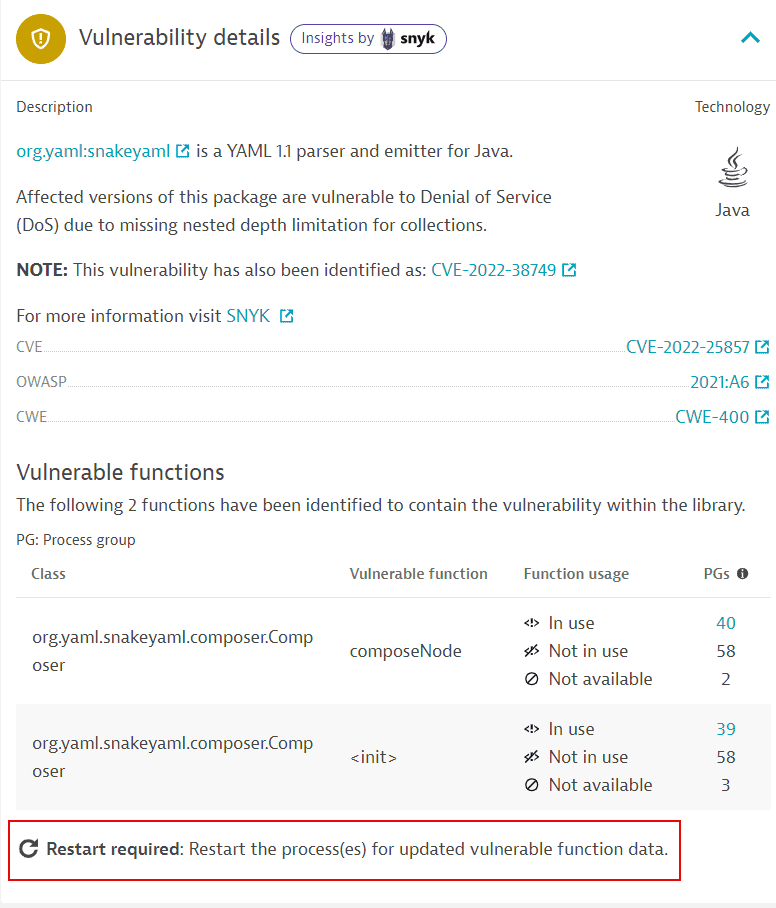 Restart required on a vulnerability details page
 -
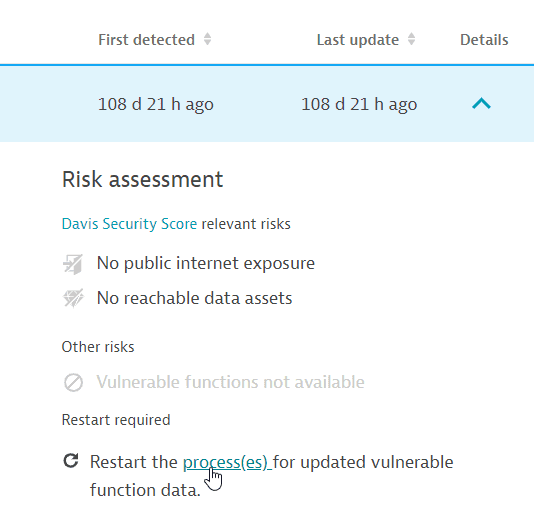
The process groups overview related to a vulnerability (in Details > Risk assessment)
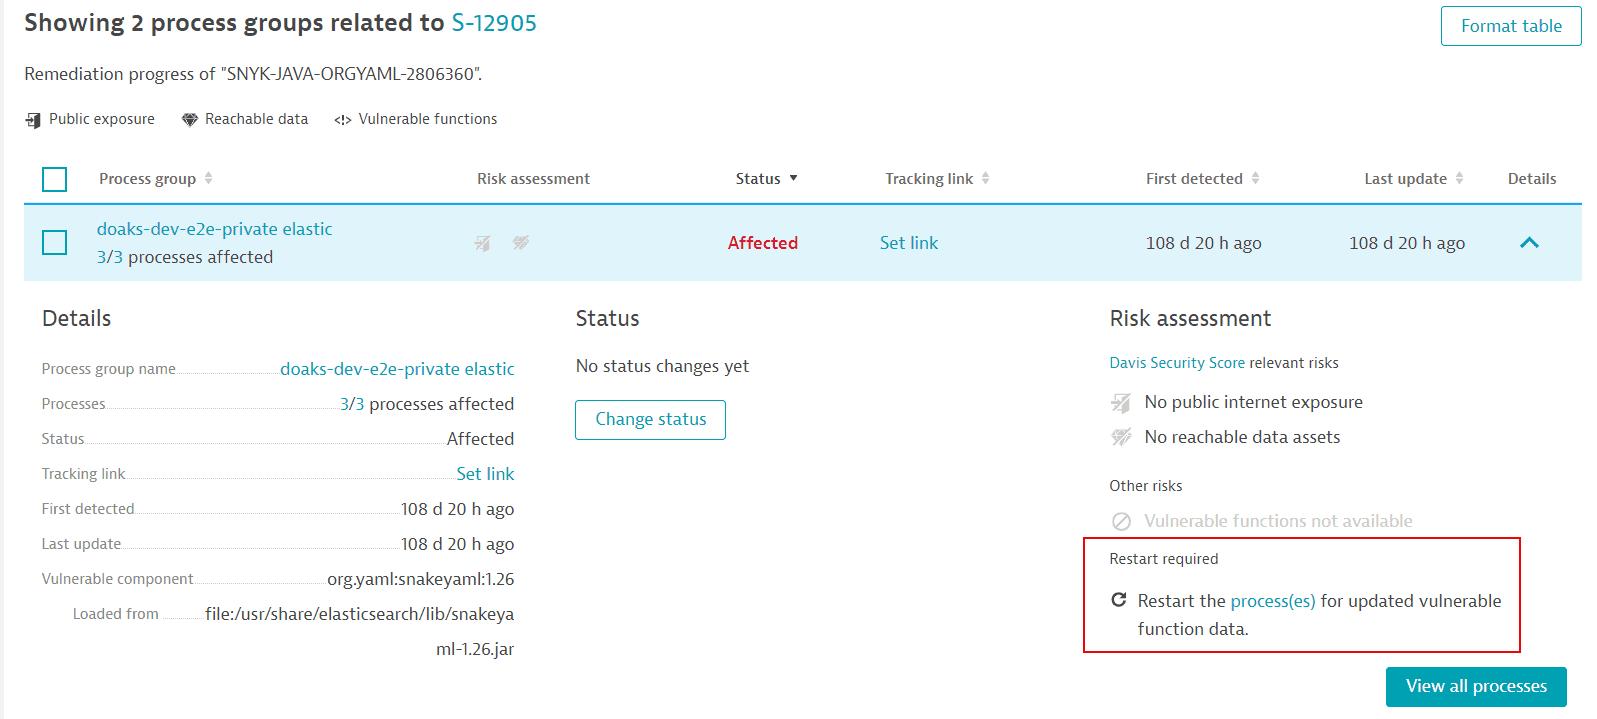 Restart required on the process groups overview related to a vulnerability
 -
The process list related to a vulnerability (in Vulnerable functions and Details).
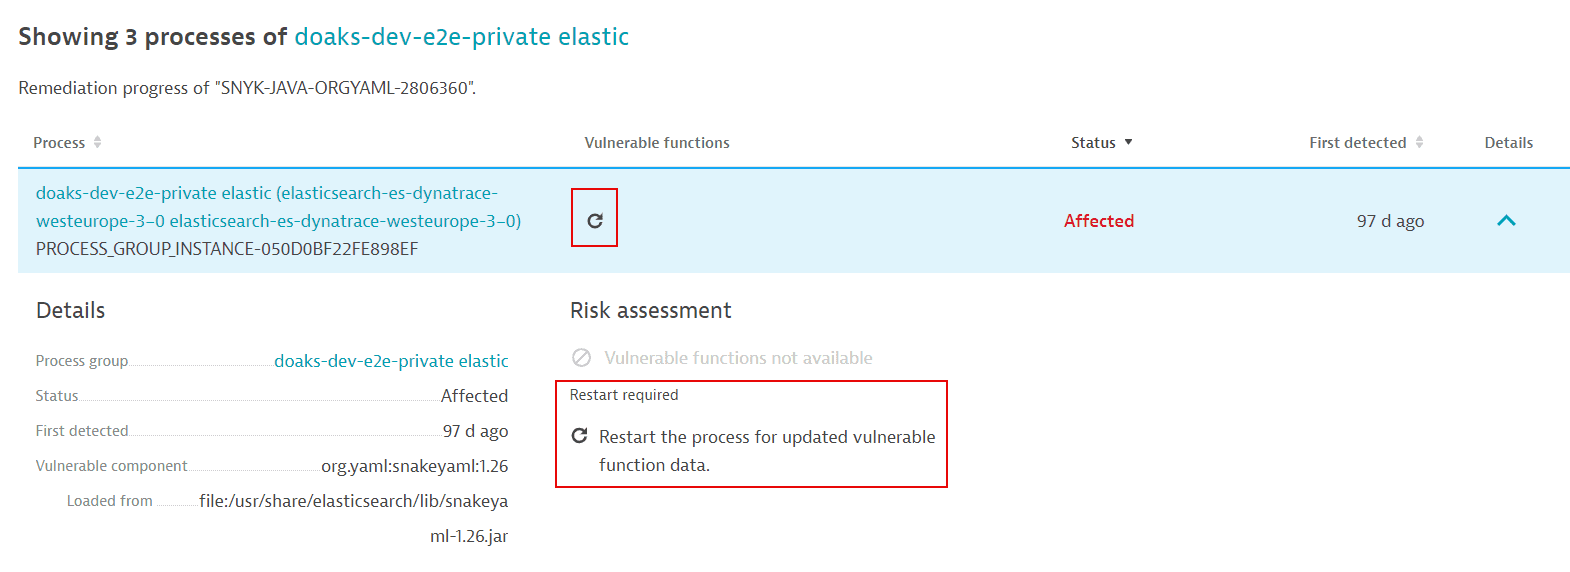 Restart required on the process list related to a vulnerability
Vulnerability feeds
What feeds does Dynatrace use for vulnerabilities and malicious code?
To fetch data about vulnerabilities, Dynatrace Application Security uses either the Dynatrace Vulnerability feed or NVD, depending on the vulnerable component. Malicious code in packages is exclusively sourced from the Dynatrace Vulnerability feed.
For more information, see Third-party vulnerability feeds.
Attack blocking mechanism
How does Dynatrace actually block attacks?
Selecting Block attack for an attack doesn't automatically block the respective attack; it takes you to the Settings page where you can create a monitoring rule to block that attack in the future. Dynatrace is configured to block future exploit situations, not the current ones.
The request (thread) with the exploit throws an exception in the running code. All other users who aren't attacking are unaffected.
Dynatrace detects when a user-supplied attack payload finds its way to a line of code that uses an insecure way of
- Talking to the database (SQL injection)
- Talking to the operating system (command injection)
- Doing a JNDI lookup (JNDI injection, such as Log4Shell)
- Doing a HTTP request (SSRF)
The vulnerability is identified with or without an attack. If the data sent by the client includes characteristics of an attack that reaches this line of code, it's deemed an exploit, and Dynatrace alerts or blocks it.
To learn more about the Runtime Application Protection mechanism, see How it works.
How is an attacker's IP determined?
In Runtime Application Protection, to determine an attacker's IP, Dynatrace verifies
- Specific HTTP headers, such as
X-Client-IPorX-Forwarded-For.
-
The client IP of the socket connection (if the HTTP headers mentioned above aren't available).
For details, see Client IP address detection.
Data retention
What's the data retention period for vulnerabilities, events, and attacks?
For information about how security-related data is stored in Dynatrace, see Data retention periods.
Consumption
How can I check how much my hosts consume?
- If you're using Dynatrace Platform Subscription, see
- If you're using Dynatrace classic licensing, see How capabilities affect monitoring consumption.
To see which hosts consume DPS/ASUs, in Security Overview, go to the Host coverage section for third-party and code-level vulnerabilities and select Monitored hosts. The resulting list of hosts are the hosts in your environment which consume DPS/ASUs. For more information, see Host coverage.
Why is Application Security still showing usage even though I disabled RVA?
I disabled Third‑party and Code‑level Vulnerability Analytics. My host shows 'Not analyzed', yet usage is still appearing in my subscription. Why?
This behavior applies to both Dynatrace classic licensing (ASU) and Dynatrace Platform Subscription (DPS).
Check whether Runtime Application Protection (RAP) is enabled. RAP depends on Runtime Vulnerability Assessment (RVA) to determine which vulnerability an attack attempts to exploit. Because RAP cannot operate without RVA, any host with RAP enabled will always consume ASUs/DPS for both RAP and RVA—even if the global switches for third‑party or code‑level vulnerability detection are turned off.