Data retention periods
- Reference
- 7-min read
Dynatrace retains different types of monitored data from your environments. The Dynatrace Managed Cluster keeps the monitoring data. The following table shows the general retention periods for service data, Real User Monitoring Classic (RUM Classic), synthetic monitors, Log Monitoring, and metric time series data.
Trial accounts
After a 15-day trial account expires, Dynatrace continues to retain the monitoring data from the account for 30 days to prevent data loss.
Purchased accounts
For active Dynatrace accounts, the following retention periods are set by default:
| Data category | Retention period |
|---|---|
Configurable, with maximum | |
Configurable, with maximum | |
Configurable, with maximum | |
| |
| |
Configurable, with maximum | |
Synthetic | Configurable, with maximum |
Configurable, with maximum | |
| |
OneAgent diagnostics (support archives and analysis results) | Configurable, default is |
| |
Open vulnerabilities: retained until resolution; Resolved vulnerabilities: |
Distributed traces
Dynatrace retains the complete details of every transaction for a maximum of 365 days, depending on your configuration. The complete transaction record lets you analyze individual transactions and get all the details available with your instrumentation.
For trial users, an additional storage-size limit applies, which can lead to shorter retention times.
Transaction store at DATASTORE_PATH/server/tenantData keeps the data. Dynatrace doesn't replicate this data across Managed Cluster nodes.
Code-level insights
Code-level insights are available with OneAgent instrumentation for 10 days.
After 10 days, session data is optimized for aggregated views. Non-aggregated and aggregated code-level data produce comparable results for longer timeframes, while differences may be expected for shorter timeframes.
Services: Requests and request attributes
Short-term service metric data, used in multidimensional analysis and request charting, is available for a maximum of 365 days, depending on your configuration, with the following interval granularity levels:
| Timeframe | Interval granularity |
|---|---|
Less than 20 minutes | 10 seconds |
20–40 minutes | 20 seconds |
40–60 minutes | 30 seconds |
More than 1 hour | 1 minute |
A short-timeframe analysis accesses code-level data that's available for 10 days. After 10 days, session data is optimized for aggregated views. For details on how aggregated and non-aggregated data compare, see Code-level insights.
Transaction store at DATASTORE_PATH/server/tenantData keeps the data. Dynatrace doesn't replicate this data across Managed Cluster nodes.
RUM Classic: User action data
Aggregated user action metrics, which are used in tables like Top user actions and Top JavaScript errors, are available for a maximum of 365 days, depending on your configuration. After 10 days, user actions data is optimized for aggregated views, and some individual user actions become unavailable for individual analysis. However, the sample set is large enough for statistically correct aggregations.
For key user actions, raw user action data is also kept for a maximum of 365 days, depending on your configuration. The retention for timeseries data of key user actions is the same as for timeseries metrics.
Transaction store at DATASTORE_PATH/tenantData keeps the data. Dynatrace doesn't replicate this data across Managed Cluster nodes.
RUM Classic: User sessions
User session data, including Session Replay, is stored for 35 days. Waterfall analysis and JavaScript error data is stored with distributed trace code-level insights and errors.
Data is stored in Elasticsearch store at DATASTORE_PATH/elasticsearch. Data is replicated across Managed Cluster nodes. Replication factor is set to three.
RUM Classic: Mobile crashes
Crash data and stack traces of mobile and custom applications are stored for 35 days.
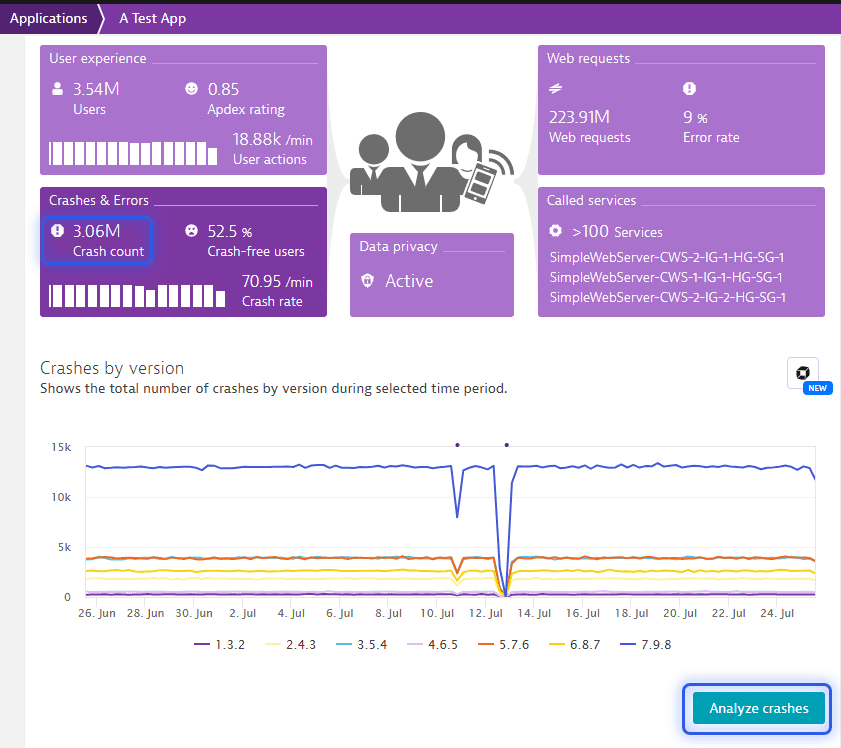
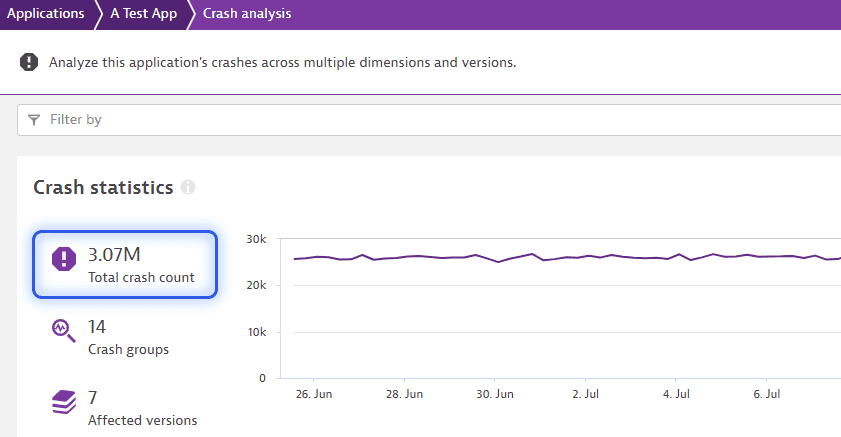
The crash reporting data displayed in the application detailed page may differ from such data in the statistics page. For these pages, it comes from different storage and has a different retention period.
Data is stored in Elasticsearch store at DATASTORE_PATH/elasticsearch. Data is replicated across Managed Cluster nodes. Replication factor is set to three.
RUM Classic: Session Replay
Minimum size of required Session Replay storage volume is entirely load-dependent. A maximum size isn't required.
The Session Replay data storage directory is a dedicated file store at DATASTORE_PATH/server/replayData and is used exclusively for Session Replay data. For more information about storage size recommendations, see Configure the secondary disk.
Log Monitoring
Log Monitoring allows you to store all logs centrally within external storage. Central storage makes log data available independent of log files themselves.
For storing log files centrally, you already use Elasticsearch store at DATASTORE_PATH/elasticsearch to store log files on your Dynatrace Managed Cluster. Replication factor is set to two. To configure log storage, see Log storage.
Depending on the number and size of Managed Cluster nodes and the selected log retention times, only a certain number of environments can use custom log retention. The system reports when no more custom log retention settings are possible based on the predicted current usage.
Memory dumps
Memory dumps are immediately deleted from the disk once they're uploaded to ActiveGate. When an upload isn't possible, memory dumps up to 20 GB are stored on the disk for up to 2 hours.
Metrics
The following interval granularity levels are available for dashboarding and API access:
| Timeframe | Interval granularity |
|---|---|
0–14 days | 1 minute |
14–28 days | 5 minutes |
28–400 days | 1 hour |
400 days–5 years | 1 day |
Data is stored in Metrics repository at DATASTORE_PATH/cassandra. Data is replicated across Managed Cluster nodes. Replication factor is set to three.
To provide accurate calculations for timeseries metrics, Dynatrace uses the P2 algorithm to calculate the quantiles dynamically. This algorithm yields good results and works well with values in the long tails of value distributions. However, the aggregation algorithm is neither associative ((a + b) + c == a + (b + c)) nor commutative (a + b + c == c + b + a). For some metrics, for example, response times, this can lead to different quantile values each time the algorithm runs or when the data is aggregated in different ways, for example, one metric is split by URL and another by browser.
OneAgent and ActiveGate diagnostics
OneAgent diagnostics and ActiveGate diagnostics are optional features that allow you to collect and analyze support archives for anomalies.
Dynatrace OneAgent or Dynatrace ActiveGate creates support archives and keeps them in Cassandra, where Dynatrace automatically deletes them after 30 days. When you allow Dynatrace to analyze an issue, Dynatrace keeps an additional copy of the support archive in the configured AWS S3 bucket. Dynatrace also automatically deletes results of the issue analysis and the support archive from the AWS S3 bucket after 30 days. Dynatrace OneAgent and Dynatrace ActiveGate don't keep copies of created support archives.
You can delete OneAgent or ActiveGate diagnostics issues at any time. If you delete an issue, the related support archive and analysis report are deleted from Cassandra and the AWS S3 bucket immediately. The analysis result in Dynatrace Health Control is deleted after 30 days.
Security data
Vulnerabilities
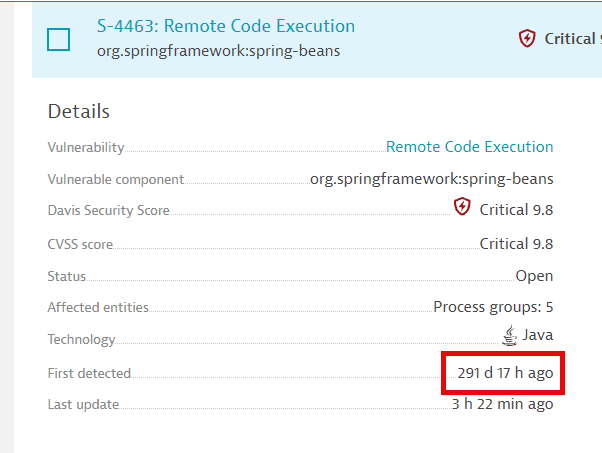
Dynatrace retains open third-party vulnerabilities and code-level vulnerabilities as long as they're open, regardless of the timeframe.
The storage time for resolved third-party and code-level vulnerabilities depends on when vulnerabilities are resolved:
- If a vulnerability is resolved before 365 days since it was first opened, it's deleted after 365 days.
- If a vulnerability is resolved after 365 days since it was first opened, it's deleted on its closest anniversary of the date when it was first opened.
Examples:
| First opened | First resolved | Reopened | Resolved again | Delete date |
|---|---|---|---|---|
2022-05-12 | 2023-05-06 | 2023-05-13 | ||
2022-05-12 | 2023-08-06 | 2024-05-13 | ||
2022-05-12 | 2023-08-06 | 2024-01-01 | 2024-02-08 | 2024-05-13 |
Events
Third-party vulnerability evolution events and code-level vulnerability evolution events are stored for 365 days. You can only query them up to the timestamp of when the vulnerability was first detected.
Attacks
Attacks are stored for 550 days.
Because retention is managed in monthly intervals, the exact duration may vary slightly depending on when the attack occurred and when cleanup is performed.