Metrics for Dynatrace Runtime Vulnerability Analytics
- Reference
Available metrics
The following Application Security metrics are available for Runtime Vulnerability Analytics.
Vulnerabilities
| Metric name | Dynatrace version | Description |
|---|---|---|
Open security problems (global) | 1.225+ | Number of currently open vulnerabilities seen within the last minute. The metric value is independent of any configured management zone (and thus global). |
New open security problems (global) | 1.222+ | Number of vulnerabilities that were recently created. The metric value is independent of any configured management zone (and thus global). |
New muted security problems (global) | 1.222+ | Number of vulnerabilities that were recently muted. The metric value is independent of any configured management zone (and thus global). |
Open security problems (split by management zone) | 1.231+ | Number of currently open vulnerabilities seen within the last minute. The metric value is split by management zone. |
New open security problems (split by management zone) | 1.231+ | Number of vulnerabilities that were recently created. The metric value is split by management zone. |
New resolved security problems (global) | 1.222+ | Number of vulnerabilities that were recently resolved. The metric value is independent of any configured management zone (and thus global). |
Dimensions used in vulnerability metrics
-
Risk level (
Critical,High,Medium,Low,None) -
Type (
Third-party vulnerability,Code-level vulnerability) -
Management zone name – only for split-by-zone metrics
-
Vulnerable component type (
Library,Runtime) – only available for third-party vulnerabilities -
Public internet exposure (
Public internet exposure,No public internet exposure,Public internet exposure not available) -
Reachable data assets (
Reachable data assets,No reachable data assets,Reachable data assets not available) -
Vulnerable functions (
Vulnerable functions in use,No vulnerable functions in use,Vulnerable functions not available) -
Assessment accuracy (
Full accuracy,Reduced accuracy,Accuracy not available) -
Public exploit (
Public exploit published,No public exploit published)
Affected entities
| Metric name | Dynatrace version | Description |
|---|---|---|
Vulnerabilities - affected entities count | 1.251+ | Total number of unique affected entities across all open vulnerabilities. The metric supports the management zone selector. |
Dimensions used in affected entities metrics
- Security problem ID
- External vulnerability ID
- Title
- Vulnerable component (Package name or
Not available) - CVE (All related CVE IDs or
Not available) - Risk level (
CRITICAL,HIGH,MEDIUM,LOW,NONE) - Technology (
Java,.NET,Node.js,PHP,GO) - Type (
Third-party vulnerability,Code-level vulnerability)
View
To view Application Security metrics
-
Go to Metrics.
-
Filter for the category of metrics you want, for example
affected process groups.- If you don't see results, turn off Only show metrics reported after the start of the selected timeframe.
- You can add more filters (
Tag,Unit,Favorites). See Filter and sort the table for details.
-
Expand Details for any metric to see metric details and a chart of the metric over the selected timeframe. For more information, see Metrics browser.
Example metric details:
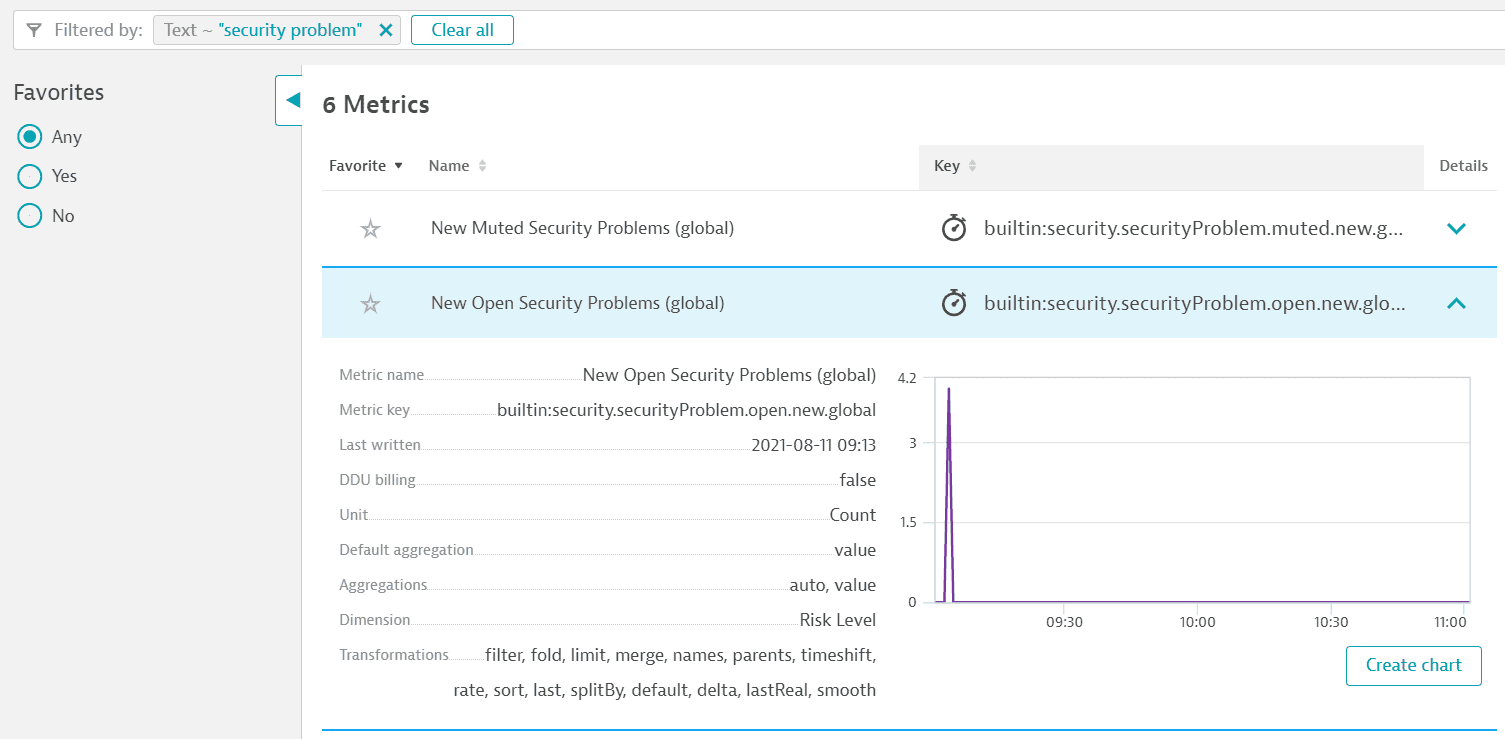 Metric example appsec
Usage
You can use Application Security metrics to
Example
To view the current status of affected entities in your environment and see how the process of remediating vulnerabilities is developing, create a chart for the Vulnerabilities - affected entities count metric and pin it to your dashboard.
Export and share
Once you run a query in Data Explorer, you can
 Third-Party Vulnerabilities
 Code-Level VulnerabilitiesApplication Security