Metrics Classic for Dynatrace Runtime Application Protection
- Reference
Available metrics
The following Application Security metrics are available for Runtime Application Protection.
Attacks
| Metric name | Dynatrace version | Description |
|---|---|---|
New attacks | 1.271+ | Number of attacks that were recently detected (based on when Dynatrace Cluster stores the attacks; as a result, there might be slight differences between the timestamp of the reported attacks metric and the timestamp of the attacks detected by OneAgent). The metric is management zone aware based on the process group dimension. |
Dimensions used in attack metrics
- Status (
Blocked,Allowlisted,Exploited) - Type (
SQL injection,CMD injection,JNDI injection,SSRF) - Process group (
builtin— primary entity for the management zone selector)
View
To view Application Security metrics
-
Go to Metrics.
-
Filter for the metric you want.
- If you don't see results, turn off Only show metrics reported after the start of the selected timeframe.
- You can add more filters (
Tag,Unit,Favorites). See Filter and sort the table for details.
-
Expand Details for any metric to see metric details and a chart of the metric over the selected timeframe. For more information, see Metrics browser.
Example metric details:
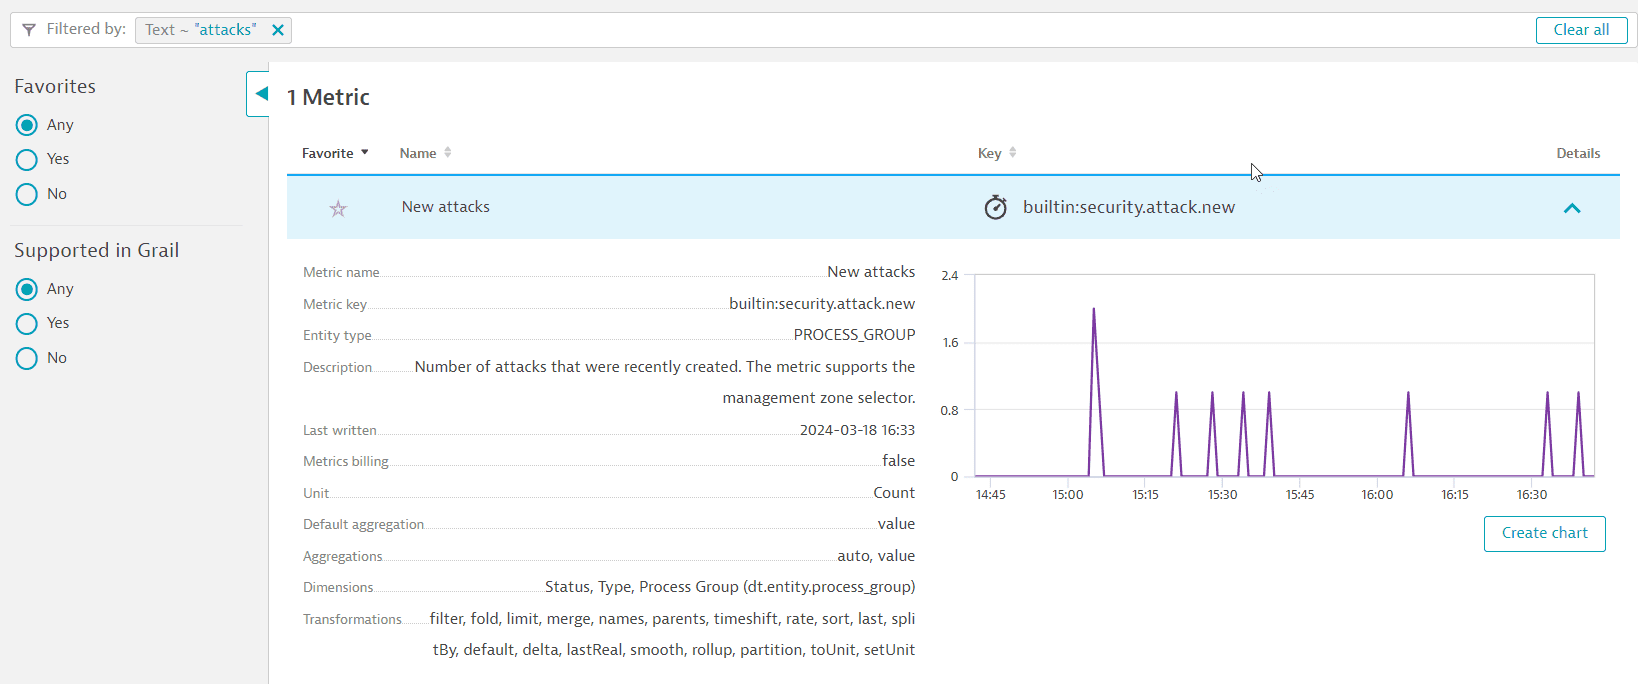 example metric attacks
Usage
You can use Application Security metrics to
Example
To keep an eye on the number of attacks over time, create a chart for the New attacks metric and pin it to your dashboard.
Export and share
Once you run a query in Data Explorer, you can
 AttacksApplication Security