Monitor Kubernetes
- How-to guide
- 5-min read
- Published Jul 07, 2025
The OpenTelemetry Collector provides extensive support for Kubernetes cluster and workload monitoring. It supports various receivers to collect critical metrics from Kubernetes clusters, objects, and kubelets.
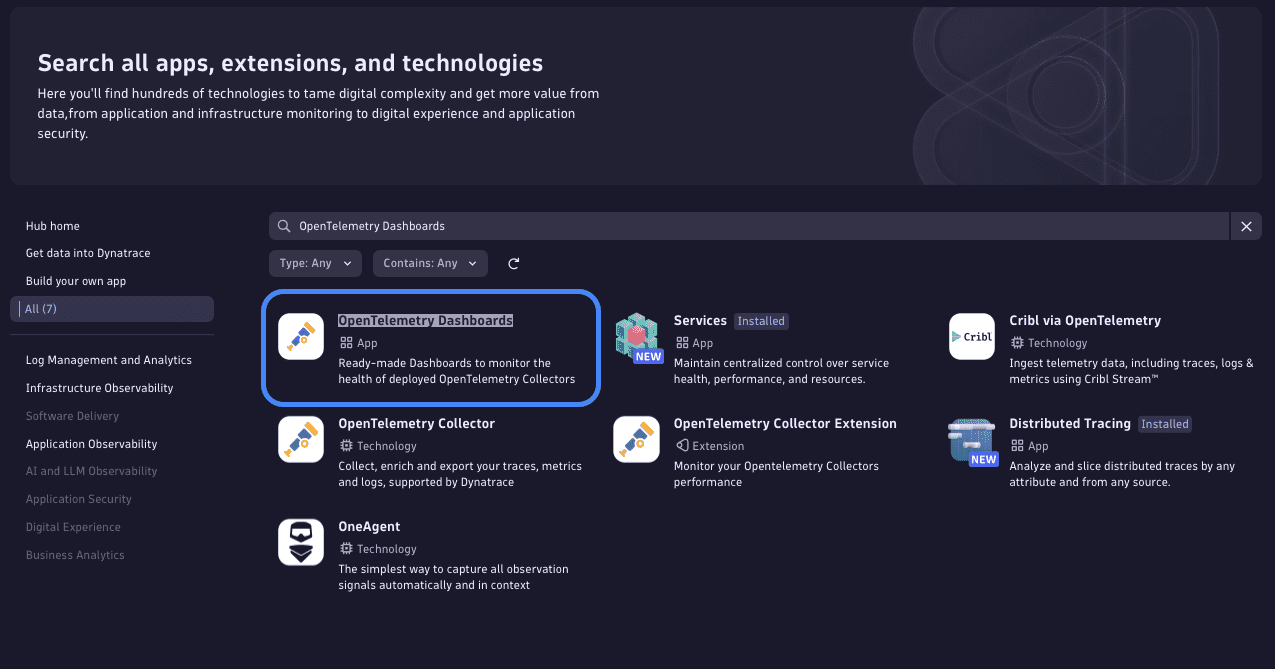
This use case explains how to set up your OpenTelemetry Collectors to get full visibility into your Kubernetes clusters through Ready-made dashboards provided by the Dynatrace OpenTelemetry Dashboards app.
Dynatrace recommends using the Dynatrace Operator for Kubernetes monitoring. However, this use case is designed specifically for OpenTelemetry users who choose not to deploy the Dynatrace Operator. It leverages pure OpenTelemetry data, which is not integrated into the Dynatrace Kubernetes application. Despite this, it provides ready-made Kubernetes dashboards and enables users to create custom dashboards and notebooks using the collected telemetry data.
Prerequisites
- One of the following Collector distributions with the Kubernetes Cluster, Kubernetes Objects, and Kubelet Stats receivers:
- Two Collector deployments
- One in agent mode for workload level telemetry
- One in gateway mode for cluster level telemetry and forwarding to Dynatrace
- The API URL of your Dynatrace environment
- An API token with the relevant access scope
- Kubernetes configured for the required role-based access control
See Collector Deployment and Collector Configuration on how to set these up with the configurations provided below.
Demo configurations
RBAC configuration
Configure the following rbac.yaml file with your Kubernetes instance, to allow the Collector to use the Kubernetes API with the service-account authentication type.
apiVersion: v1kind: ServiceAccountmetadata:labels:app: otelcol-dtname: otelcol-dt---apiVersion: rbac.authorization.k8s.io/v1kind: ClusterRolemetadata:name: otelcol-dtlabels:app: otelcol-dtrules:- apiGroups:- ""resources:- events- namespaces- namespaces/status- nodes- nodes/spec- nodes/stats- nodes/proxy- pods- pods/status- replicationcontrollers- replicationcontrollers/status- resourcequotas- servicesverbs:- get- list- watch- apiGroups:- appsresources:- daemonsets- deployments- replicasets- statefulsetsverbs:- get- list- watch- apiGroups:- batchresources:- jobs- cronjobsverbs:- get- list- watch- apiGroups:- autoscalingresources:- horizontalpodautoscalersverbs:- get- list- watch- apiGroups:- coordination.k8s.ioresources:- leasesverbs:- get- list- watch- create- update- patch- delete---apiVersion: rbac.authorization.k8s.io/v1kind: ClusterRoleBindingmetadata:name: otelcol-dtlabels:app: otelcol-dtroleRef:apiGroup: rbac.authorization.k8s.iokind: ClusterRolename: otelcol-dtsubjects:- kind: ServiceAccountname: otelcol-dtnamespace: default
Collector configuration
Agent deployment
extensions:health_check:endpoint: 0.0.0.0:13133receivers:kubeletstats:auth_type: "serviceAccount"collection_interval: 10snode: '${env:K8S_NODE_NAME}'extra_metadata_labels:- k8s.volume.typek8s_api_config:auth_type: "serviceAccount"endpoint: "https://${env:K8S_NODE_NAME}:10250"insecure_skip_verify: truemetric_groups:- node- pod- container- volumeprocessors:filter:error_mode: ignoremetrics:metric:- 'IsMatch(name, "k8s.volume.*") and resource.attributes["k8s.volume.type"] == nil'- 'resource.attributes["k8s.volume.type"] == "configMap"'- 'resource.attributes["k8s.volume.type"] == "emptyDir"'- 'resource.attributes["k8s.volume.type"] == "secret"'k8sattributes:filter:node_from_env_var: K8S_NODE_NAMEextract:metadata:- k8s.pod.name- k8s.pod.uid- k8s.pod.ip- k8s.deployment.name- k8s.replicaset.name- k8s.statefulset.name- k8s.daemonset.name- k8s.job.name- k8s.cronjob.name- k8s.namespace.name- k8s.node.name- k8s.cluster.uid- k8s.container.nameannotations:- from: podkey_regex: metadata.dynatrace.com/(.*)tag_name: $$1pod_association:- sources:- from: resource_attributename: k8s.pod.name- from: resource_attributename: k8s.namespace.name- sources:- from: resource_attributename: k8s.pod.ip- sources:- from: resource_attributename: k8s.pod.uid- sources:- from: connectionexporters:otlp:endpoint: otelcolsvc:4317tls:insecure: trueservice:extensions:- health_checkpipelines:metrics:receivers:- kubeletstatsprocessors:- filter- k8sattributesexporters:- otlp
Gateway deployment
extensions:health_check:endpoint: 0.0.0.0:13133receivers:otlp:protocols:grpc:endpoint: 0.0.0.0:4317k8sobjects:error_mode: ignoreobjects:- name: eventsmode: watchk8s_cluster:auth_type: "serviceAccount"collection_interval: 10sallocatable_types_to_report:- cpu- memory- podsnode_conditions_to_report:- Ready- MemoryPressure- PIDPressure- DiskPressure- NetworkUnavailablemetrics:k8s.node.condition:enabled: truek8s.pod.status_reason:enabled: trueprocessors:k8sattributes:filter:node_from_env_var: K8S_NODE_NAMEextract:metadata:- k8s.pod.name- k8s.pod.uid- k8s.pod.ip- k8s.deployment.name- k8s.replicaset.name- k8s.statefulset.name- k8s.daemonset.name- k8s.job.name- k8s.cronjob.name- k8s.namespace.name- k8s.node.name- k8s.cluster.uid- k8s.container.nameannotations:- from: podkey_regex: metadata.dynatrace.com/(.*)tag_name: $$1pod_association:- sources:- from: resource_attributename: k8s.pod.name- from: resource_attributename: k8s.namespace.name- sources:- from: resource_attributename: k8s.pod.ip- sources:- from: resource_attributename: k8s.pod.uid- sources:- from: connectiontransform:error_mode: ignoremetric_statements:- context: resourcestatements:- set(attributes["k8s.cluster.name"], "${env:CLUSTER_NAME}")- set(attributes["k8s.workload.kind"], "job") where IsString(attributes["k8s.job.name"])- set(attributes["k8s.workload.name"], attributes["k8s.job.name"]) where IsString(attributes["k8s.job.name"])- set(attributes["k8s.workload.kind"], "cronjob") where IsString(attributes["k8s.cronjob.name"])- set(attributes["k8s.workload.name"], attributes["k8s.cronjob.name"]) where IsString(attributes["k8s.cronjob.name"])- set(attributes["k8s.workload.kind"], "daemonset") where IsString(attributes["k8s.daemonset.name"])- set(attributes["k8s.workload.name"], attributes["k8s.daemonset.name"]) where IsString(attributes["k8s.daemonset.name"])- set(attributes["k8s.workload.kind"], "statefulset") where IsString(attributes["k8s.statefulset.name"])- set(attributes["k8s.workload.name"], attributes["k8s.statefulset.name"]) where IsString(attributes["k8s.statefulset.name"])- set(attributes["k8s.workload.kind"], "replicaset") where IsString(attributes["k8s.replicaset.name"])- set(attributes["k8s.workload.name"], attributes["k8s.replicaset.name"]) where IsString(attributes["k8s.replicaset.name"])- set(attributes["k8s.workload.kind"], "deployment") where IsString(attributes["k8s.deployment.name"])- set(attributes["k8s.workload.name"], attributes["k8s.deployment.name"]) where IsString(attributes["k8s.deployment.name"])# remove the delete statements if you want to preserve these attributes- delete_key(attributes, "k8s.deployment.name")- delete_key(attributes, "k8s.replicaset.name")- delete_key(attributes, "k8s.statefulset.name")- delete_key(attributes, "k8s.daemonset.name")- delete_key(attributes, "k8s.cronjob.name")- delete_key(attributes, "k8s.job.name")log_statements:- context: log # watched Events which do have message key in log bodyconditions:- IsMap(log.body) and log.body["object"] != nil and log.body["object"]["message"] != nilstatements:- set(log.body, log.body["object"])- flatten(log.body, resolveConflicts=true)cumulativetodelta:exporters:otlphttp:endpoint: ${env:DT_ENDPOINT}headers:Authorization: "Api-Token ${env:DT_API_TOKEN}"service:extensions:- health_checkpipelines:metrics/forward:receivers:- otlpprocessors:- transform- cumulativetodeltaexporters:- otlphttpmetrics:receivers:- k8s_clusterprocessors:- k8sattributes- transform- cumulativetodeltaexporters:- otlphttplogs:receivers:- k8sobjectsprocessors:- transformexporters:- otlphttp
Validate your settings to avoid any configuration issues.
Components
For our configuration, we configured the following components:
Agent deployment
Receivers
Under receivers, we specify the kubeletstats receiver.
This receiver requires the environment variable K8S_NODE_NAME to be set to spec.nodeName using the Kubernetes Downward API (see example).
Processors
Under processors
filter: To filter Kubernetes attributes.k8sattributes: To extract and provide pod data.
Exporters
Under exporters, we specify the otlp exporter and configure it to export the data to our gateway Collector instance. Make sure to configure the correct hostname for endpoint.
Service pipelines
Under service, we assemble our receiver, processor, and exporter objects into pipelines for traces, metrics, and logs. These pipelines allow us to send OpenTelemetry signals via the Collector instance and have them automatically enriched with additional Kubernetes-specific details.
Gateway deployment
Receivers
Under receivers, we specify the following receivers as active receiver components for our gateway deployment:
otlp: To accept OTLP requests.k8sobjects: To receive objects from the Kubernetes API server.k8s_cluster: To receive cluster-level metrics and entity events from the Kubernetes API server.
Processors
Under processors, we specify the following processors:
-
k8sattributes: To extract and provide pod data. This requires the environment variableK8S_NODE_NAMEto be set with the Kubernetes node name. This receiver requires the environment variableK8S_NODE_NAMEto be set tospec.nodeNameusing the Kubernetes Downward API (see example). -
transform: To transform Kubernetes metrics. This requires the environment variableCLUSTER_NAMEto be set with the name of the cluster. Set the variable value to an arbitrary name that you want your cluster to show up with inside Dynatrace. -
cumulativetodelta: To enable conversion of cumulative metrics.
Exporters
Under exporters, we specify the otlphttp exporter and configure it with our Dynatrace API URL and the required authentication token.
For this purpose, we set the following two environment variables and reference them in the configuration values for endpoint and Authorization.
DT_ENDPOINTcontains the base URL of the Dynatrace API endpoint (for example,https://{your-environment-id}.live.dynatrace.com/api/v2/otlp)DT_API_TOKENcontains the API token
Service pipelines
Under service, we assemble our receiver, processor, and exporter objects into pipelines for traces, metrics, and logs. These pipelines allow us to send OpenTelemetry signals via the Collector instance and have them automatically enriched with additional Kubernetes-specific details.
Install and access ready-made dashboards
Install dashboards
To make these dashboards available in your tenant, install the OpenTelemetry Dashboards app via the Dynatrace Hub.
Access dashboards

When accessing the dashboards, you have the following choices:
- OpenTelemetry K8s Cluster: A comprehensive overview of cluster performance, including nodes, pods, containers, events, and more.
- OpenTelemetry K8s Node - Pods: Visualizes pod-level resource consumption across Kubernetes nodes.
- OpenTelemetry K8s Namespace - Pods: Analyzes resource usage of all pods within a specific namespace.
- OpenTelemetry K8s Namespace - Workloads: Focuses on resource allocation and performance of workloads within a namespace.

Limits and limitations
Data is ingested using the OpenTelemetry protocol (OTLP) via the Dynatrace OTLP APIs and is subject to the API's limits and restrictions. For more information see: