What's new in Dynatrace SaaS 1.338
- Release notes
- 5-min read
- Rollout start on May 05, 2026
This page showcases new features, changes, and bug fixes in Dynatrace SaaS version 1.338. It contains:
Platform | Dynatrace Assist
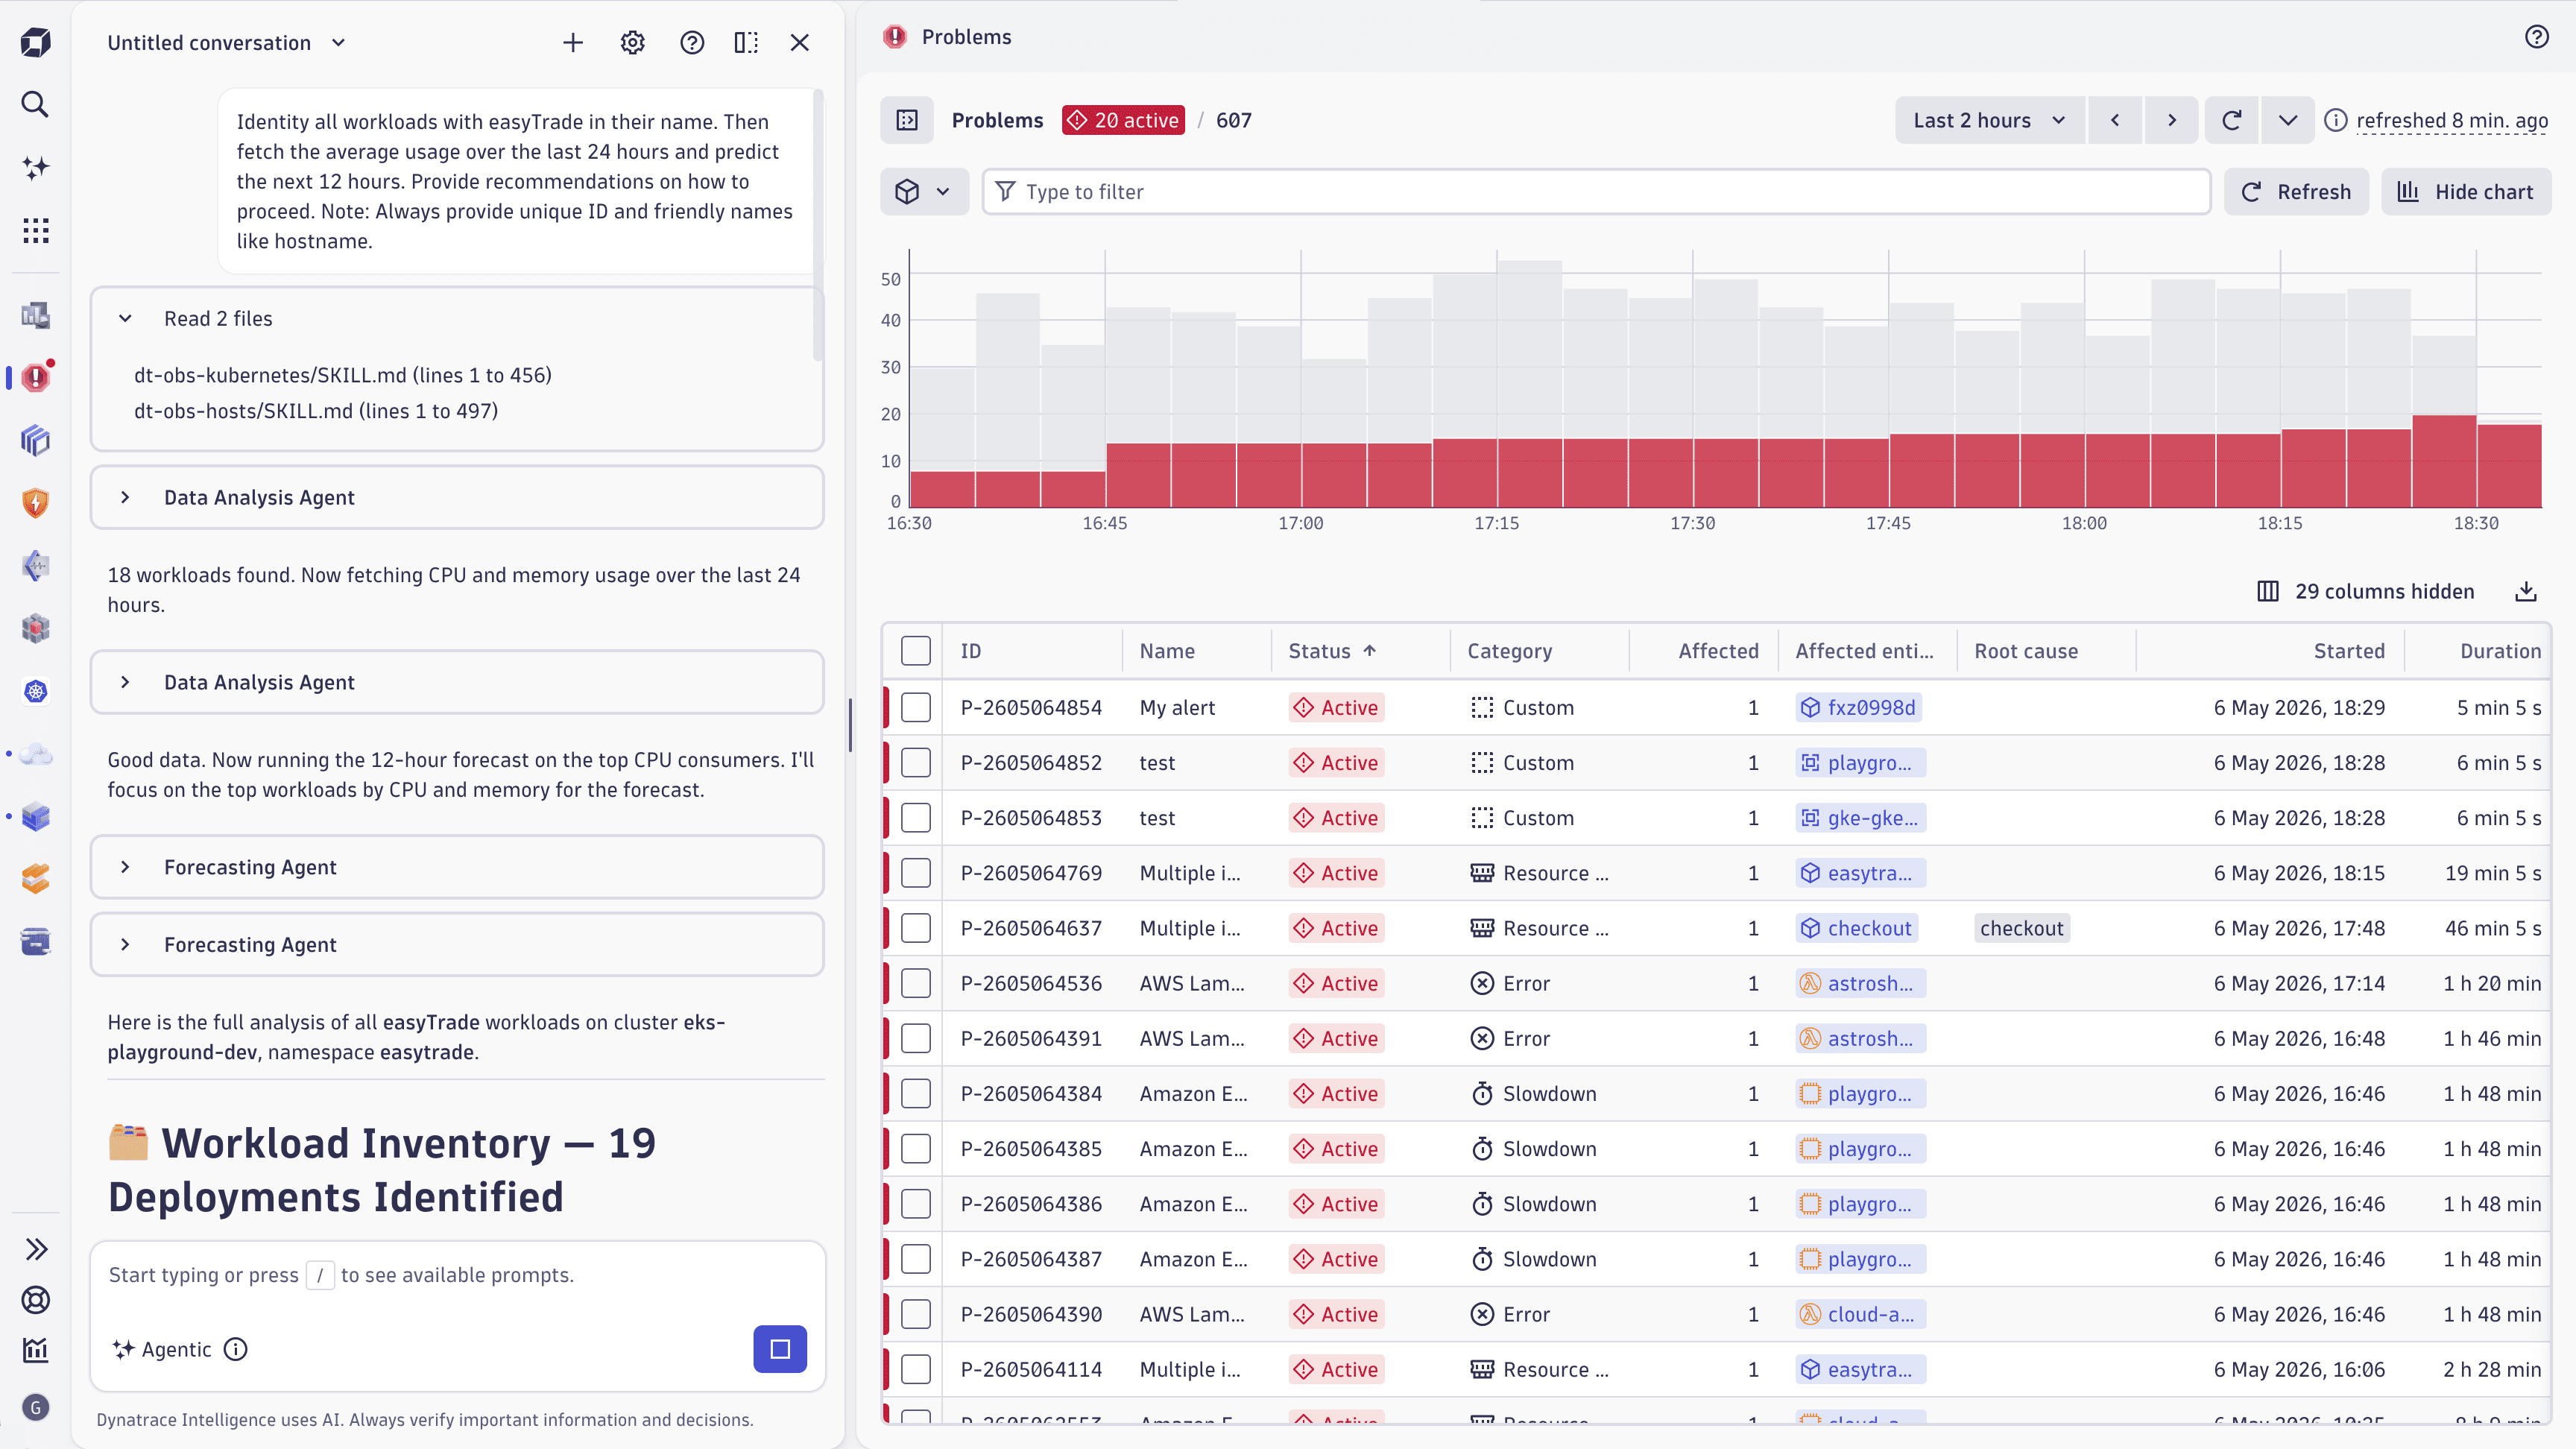
Dynatrace Assist gets even smarter than before
Dynatrace Assist receives four updates in this release that change how it reasons, generates DQL, and fits into your workflow. Together, they deliver more accurate responses, more reliable query generation, and a redesigned chat interface.
- Side-by-side mode: The Dynatrace Assist chat moves from a full-screen modal to a side panel, available in both floating and pinned layouts. You can now chat with Dynatrace Assist while keeping your dashboard, notebook, or any other app page in view, removing the context-switching that came with the previous modal interface.
- Reference files and skills: Dynatrace Assist now consults a curated knowledge base of reference files and skills (following the same open format as Anthropic's Claude Agent Skills) that capture Dynatrace domain expertise. This grounds Dynatrace Assist's reasoning in structured guidance from Dynatrace SMEs, for deeper and more targeted analysis than documentation and the foundation model alone can provide.
- New foundation model: The driver LLM behind Dynatrace Assist switches from OpenAI GPT-4o (hosted on Azure) to Anthropic Claude Sonnet 4.6 (hosted on Amazon Bedrock). Internal evaluations show meaningfully better responses across multi-step reasoning, tool use, and complex investigations.
- Custom NL2DQL model: Our natural-language-to-DQL capability moves from a RAG-based approach to a purpose-built, fine-tuned foundation model based on Llama 3.1 8B, trained on hundreds of thousands of real DQL examples. The result is significantly more reliable DQL generation across Dynatrace Assist chat,
 Notebooks,
  Dashboards, and the Dynatrace MCP servers.
Feature updates
Account Management | Subscriptions and Licensing
Improved pricing visibility in Account Management
We updated the pricing page in Account Management to display capability-based pricing in an organized, expandable table format. The page now shows all current price points for DPS capabilities on your active subscription at a glance, with the ability to expand rows to view pricing across different timeframes.
We added historical pricing context for amended subscriptions. When a capability price changes, the new price displays prominently, and previous price points remain accessible in expandable rows. Removed capabilities continue to appear with their pricing history for reference, marked as N/A for current pricing.
We also introduced a View prices option in Subscription > History, allowing you to access pricing details for expired subscriptions directly from the rate card view.
Application Observability | Distributed Tracing
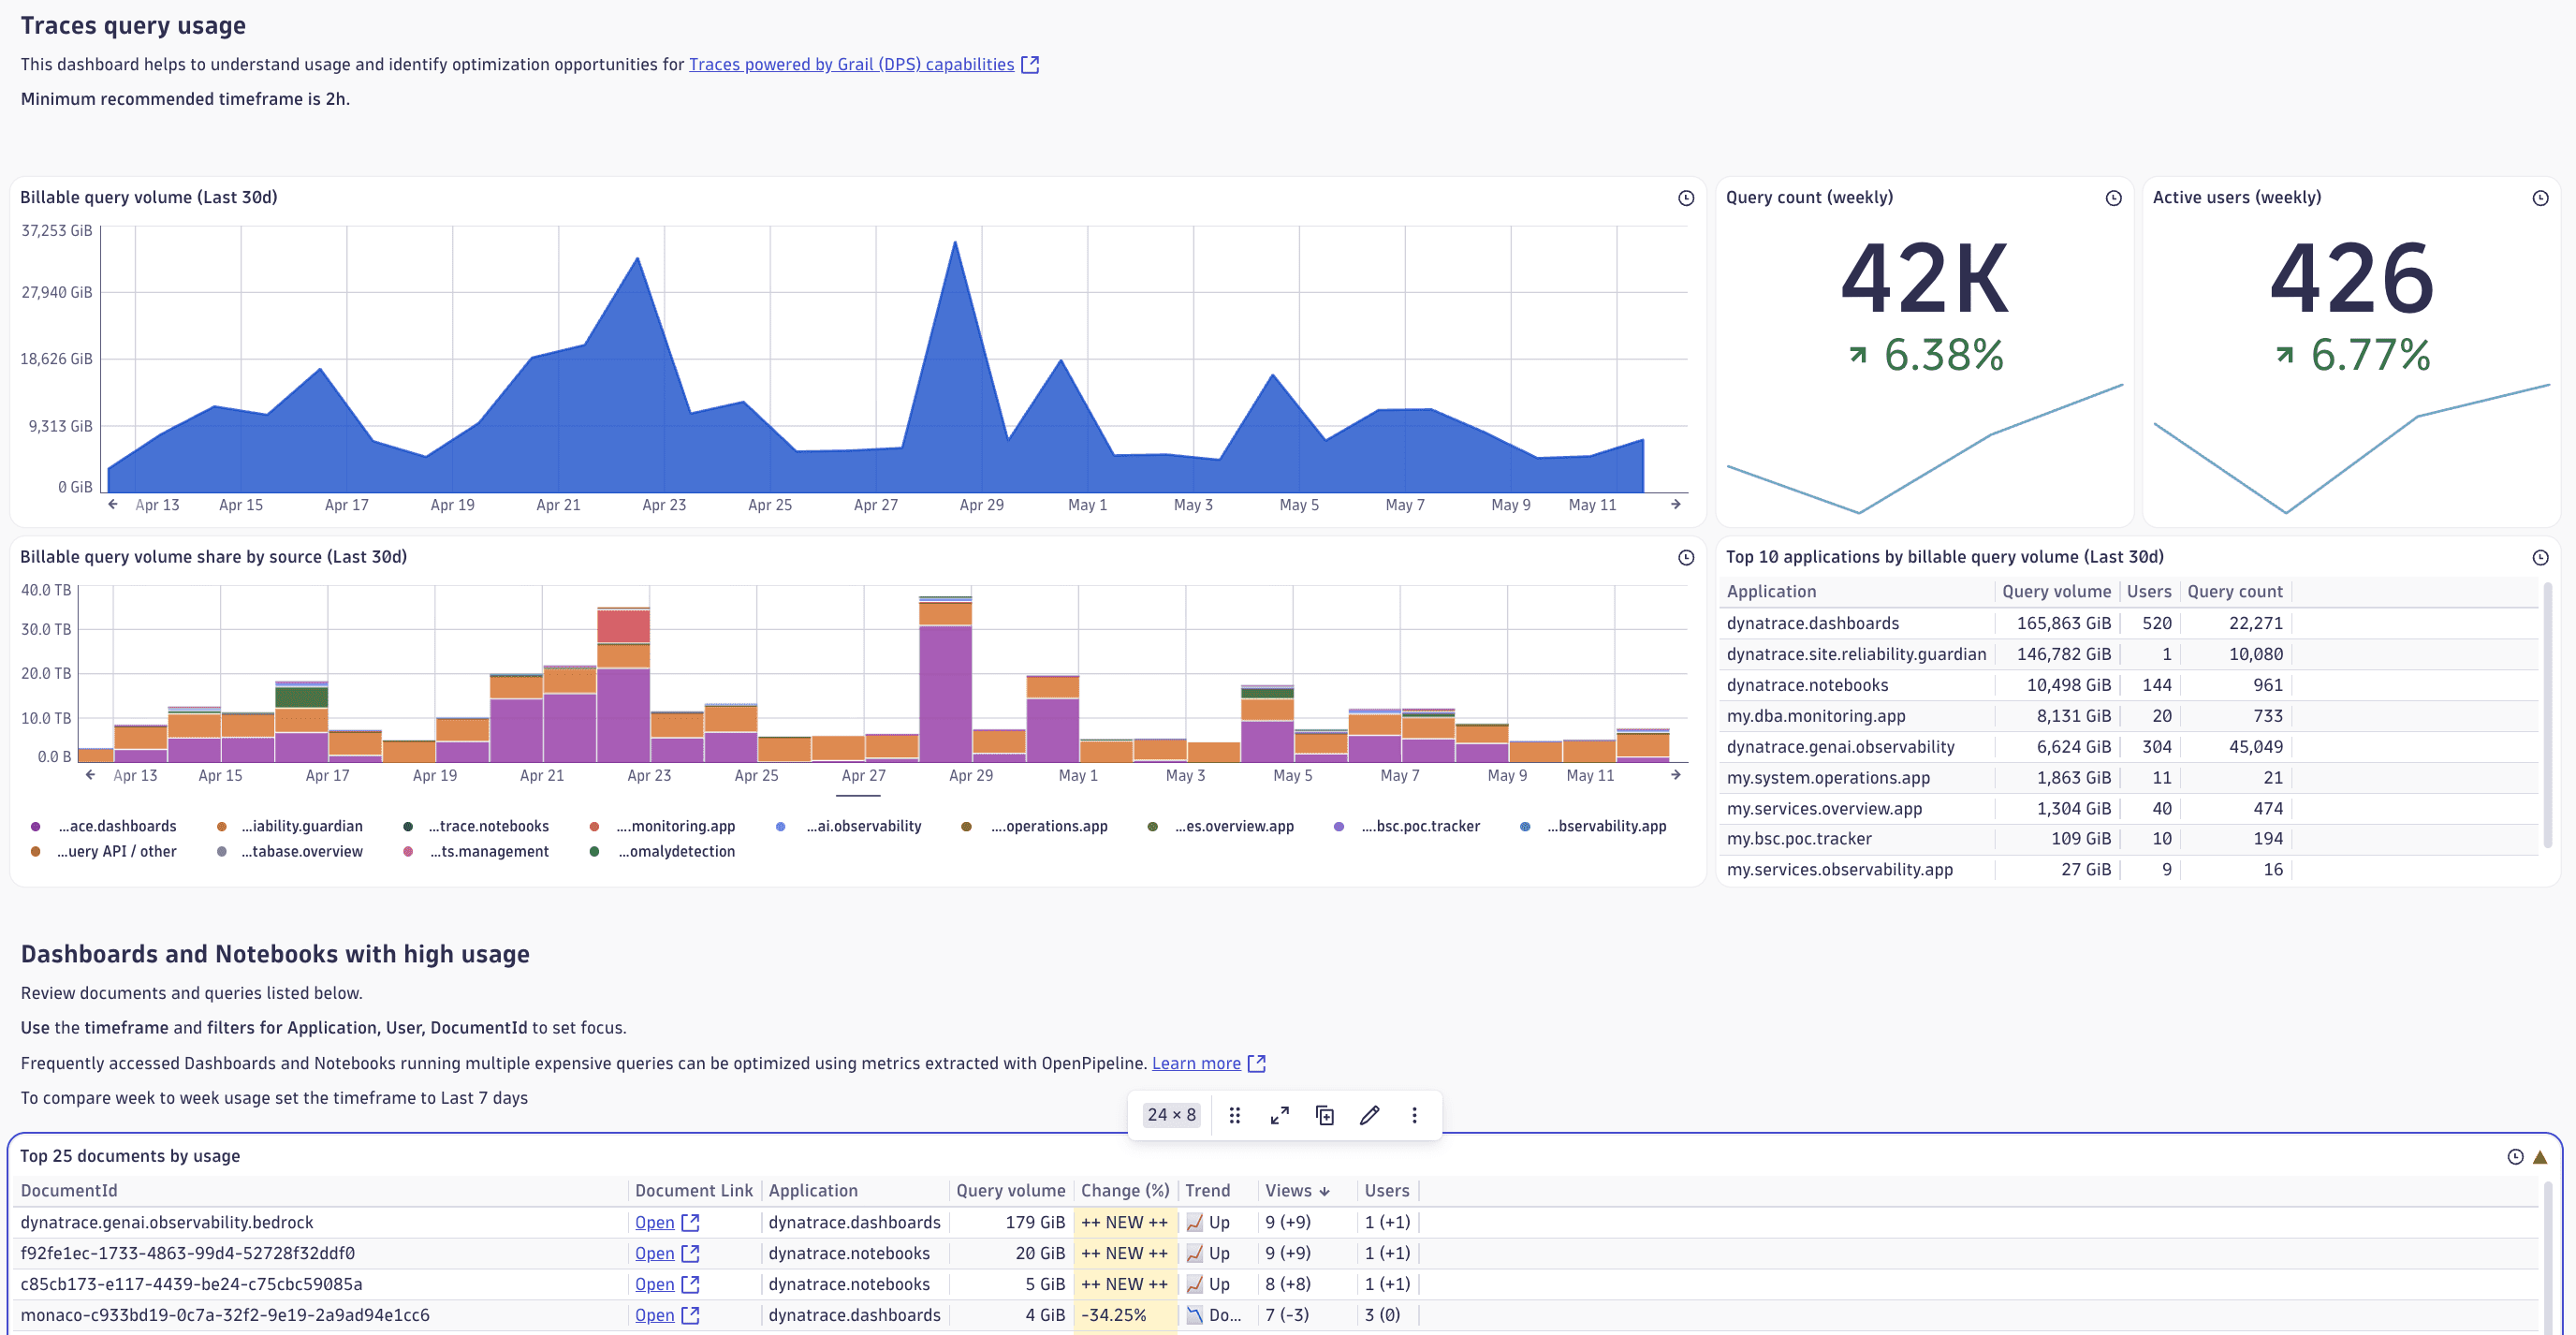
Understand and optimize trace usage with a new ready-made dashboard
Visualize your trace usage across the platform with the new Usage - Traces ready-made dashboard.
-
Spot query consumption spikes: Quickly identify sudden increases in query activity and dive into the source.
-
List expensive dashboards and notebooks: See which dashboards and notebooks drive the most log usage.
-
Bucket retention overview: Inspect bucket retention and usage.
Find the new dashboard in Dashboards > Ready-made dashboards > Usage - Traces.
Platform
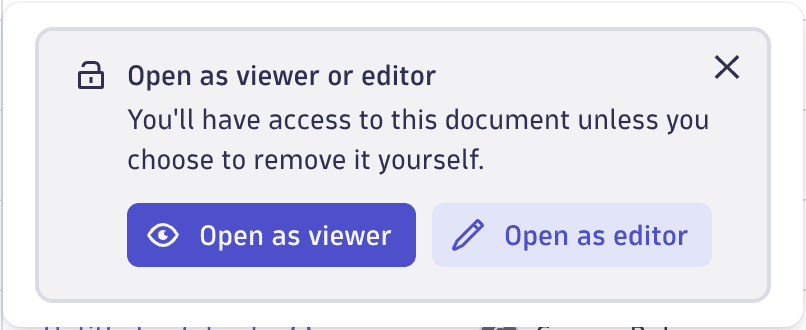
One-click admin share for notebooks and dashboards
As an admin, you can now add a one-click read-only share from the Document management page to grant yourself read-only access to any notebook or dashboard. No action is required from the document owner. The read-only access is granted until you remove it, and no notification emails are sent.
Platform
Set hidden variable values via URL to share pre-configured dashboard views
You can now change the value of hidden variables by editing the dashboard URL parameters. This makes it easy to share dashboard links with specific preset filter values, even when the variable isn't displayed as a filter on the dashboard.
Platform
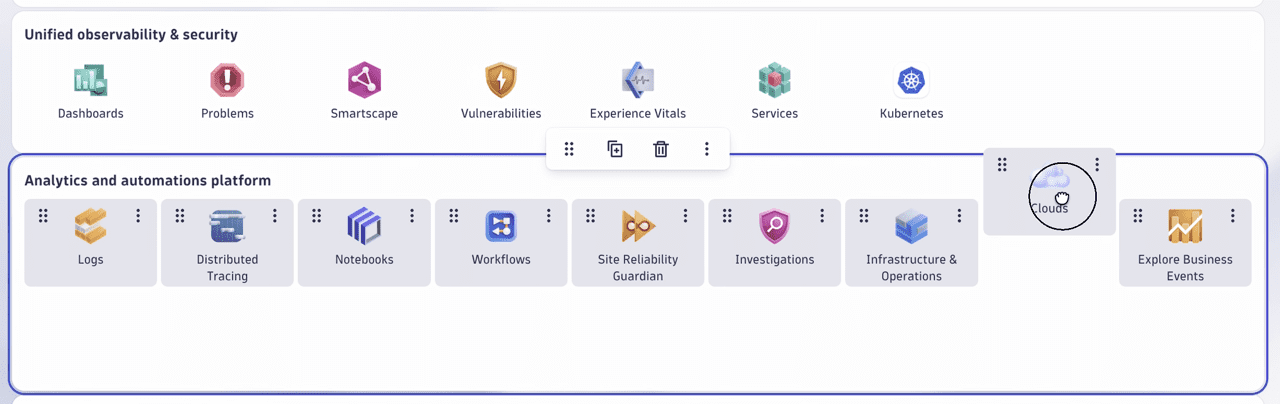
Drag links between sections in Launcher
In ![]() Launcher, you can now move links between sections. You no longer need to remove and re-add links to move them to a different section. Select Customize in the upper-right corner, and drag the required link into another section.
Launcher, you can now move links between sections. You no longer need to remove and re-add links to move them to a different section. Select Customize in the upper-right corner, and drag the required link into another section.
Platform | Dashboards
Apply changes across tiles without re-navigating to active tabs and settings
When you edit a dashboard and switch between tiles, the side panel and the expanded settings now preserve their active state. If you're working on the Visual tab for one tile and select another tile of the same type, the Visual tab stays active instead of resetting to Data. This reduces repetitive navigation, allowing you to compare settings and copy configurations across tiles more efficiently.
Platform | DQL
Query snapshots of fields in your Grail data
We extended DQL with the new fieldsSnapshot command that returns a list of fields present in your data. For example, to gather the list of fields that exist in your log data, run the following query.
fieldsSnapshot logs
Remember that the data is periodically collected in the background, and newly ingested fields may take some time to appear in the field snapshot. Additional command parameters let you filter by buckets or split the data by different dimensions, among other options.
Platform | Notebooks
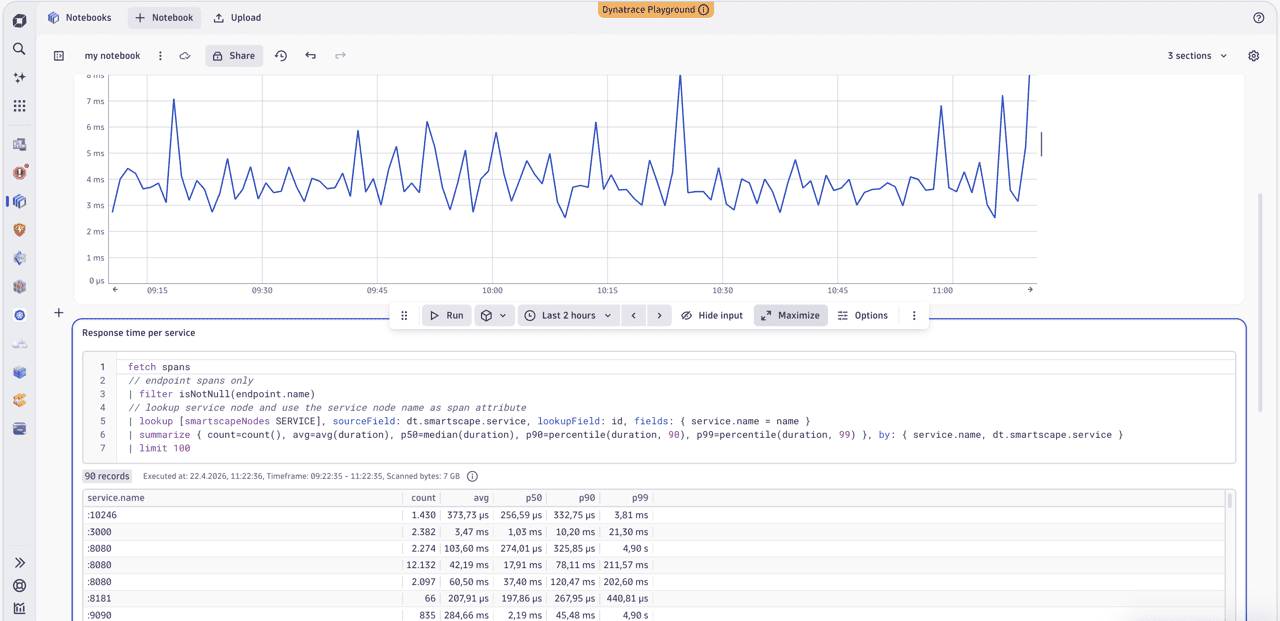
Focus on what matters with maximizable sections in Notebooks
You can now maximize individual sections in Notebooks to focus on a single task without distractions. Select Maximize in the section toolbar or select Shift + F to expand a section. After you maximize the section, drag the divider to control how much space is dedicated to the query or configuration area and the result area. Select Minimize in the section toolbar or select Esc to return to the full view.
Platform | OpenPipeline
OpenPipeline asset support for completed API migration
The next major version upgrade for each extension will add the installation of ingest assets to OpenPipeline, for example, metric extraction or Smartscape extraction. This will require the new version of the configuration API for OpenPipeline to be available for your environment, which was released in November 2025. For details on the differences between the legacy and new configuration APIs, see Migrate OpenPipeline configurations to Settings API.
Platform | OpenPipeline
Forward data to GCP locations
You can now forward ingested data to a Google Cloud Platform (GCP) storage location.
Breaking changes
Infrastructure Observability
Classic ingest is blocked for certain custom metric keys
To prevent dimension cardinality explosion for the latest versions of the database extensions, metrics starting with postgres.tables., postgres.indexes., mysql.tables., and mysql.indexes. now have their ingestion blocked for classic storage. Ingested metrics with these keys are only available in Grail.
Fixes and maintenance
Resolved issues in this release (SaaS)
- Fixed filtering of the Data Forwarding section in the OpenPipeline usage overview dashboard by the Configuration dashboard variable. (PPX-10704)
- Fixed an issue where you couldn't open a dashboard tile link by selecting it. (PAPA-32751)
- Fixed the AWS Lambda configuration snippet generation in response to changes to the Dynatrace endpoint. (MGD-11106)
- Fixed an issue where the GET account audits endpoint of the Account Management API would return a
500error instead of a504error in case of a timeout. (LIMA-43865) - Fixed an issue where environment-level usage details were not recorded for the Real User Monitoring Property DPS capability. Account Management and all other RUM capabilities were not affected. This issue may recur in isolated cases. (LIMA-42934)
- Removed the
FunctionExecutionUnitsmetric from the Azure Web Sites Overview tab. (INFOBS-8876) - Fixed an issue where the problem records in Grail were losing
event.severityupon problem closure. (DI-27308) - ServiceNow notifications that fail with the
429 Too Many RequestsHTTP error code are now retried up to two times in 15-minute intervals. This reduces the likelihood of problems remaining open in ServiceNow when ServiceNow can't initially process notifications. (DI-27261) - Improved the target URL detection for nested load actions. (DEM-24346)
- Fixed an incorrect ActiveGate image reference in the generated
synthetic.yamltemplate for OpenShift, which was pointing to a nonexistent image (dynatrace/activegate:<version>) instead of the correct one (dynatrace/dynatrace-activegate:<version>). (DEM-24277) - Fixed formatting of the ActiveGate ID in data produced by Dynatrace extensions. (DAQ-23179)
- When the Enhanced endpoints for SDv1 feature is enabled for a process group, service method names are derived from the
{http.request.method} {http.route}span attribute instead of the normalized request path. Key requests are now explicitly excluded from this behavior and always retain standard naming, ensuring that key request baselining and alerting are not disrupted by the Enhanced endpoints for SDv1 feature. (APPOBS-34331) - Fixed incorrect colors of some icons displayed in the Dynatrace web UI. (MGD-11182)
- Properties
activeGateTypeandseedTokenhave been restored to all ActiveGate Token API documentation. (ICP-4157)