What's new in Dynatrace SaaS 1.336
- Release notes
- 6-min read
- Rollout start on Apr 07, 2026
This page showcases new features, changes, and bug fixes in Dynatrace SaaS version 1.336. It contains:
Feature updates
Application Observability | Distributed Tracing
New automatic instrumentation for AWS Lambda in .Net
We added new AWS Lambda layers for automatic AWS Lambda instrumentation (tracing, log correlation), with broad support for:
- AWS SDKs such as SQS, SNS, and EventBridge
- Lambda triggers
- Databases (DynamoDB)
- And much more
Application Observability | Services
New technology-related dimensions on service metrics
We’ve added telemetry.sdk.language, dt.agent.module.type, rpc.system, and dt.process_group.detected_name to the dimensions of service metrics to allow for technology-based filtering.
Infrastructure Observability | Kubernetes
Insights into further Kubernetes object types
") Kubernetes version 1.40 provides extended visibility and insights:
Kubernetes version 1.40 provides extended visibility and insights:
- Enhanced Kubernetes object visibility now includes a new Kubernetes object type,
HorizontalPodAutoscaler(HPA). - You can now monitor and get insights from up to five
CustomResources(CRs). For details, see Getting started with Kubernetes experience. - For cloud connections (AWS, Azure, or GCP), the Kubernetes cluster details page now shows the YAML/JSON configuration of that cloud entity.
Platform
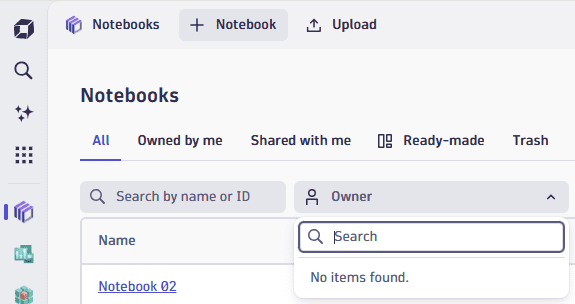
Improved filtering for finding dashboards and notebooks
We’ve made it easier for you to find dashboards, notebooks, and launchpads:
- When you select Owner, you can now filter by owner.
- The Owned by me and Shared with me filters now have their own tabs.
Platform | Dashboards
Ready-made dashboards last modified date now updated only when content changes
The last modified date of a ready-made dashboard is now updated only when its content changes, making it easier to identify updated dashboards.
Platform | Dashboards
Upload and manage images directly in Markdown
In  Dashboards,
  Notebooks, and Launcher, you can now upload images directly in Markdown, so you no longer need to host them externally.
Add or edit a Markdown section or tile and then, on the Markdown toolbar, select and choose Upload image.
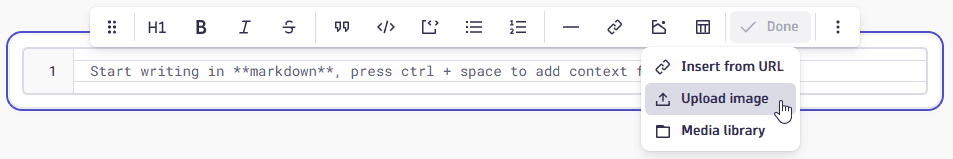
This displays Image library:
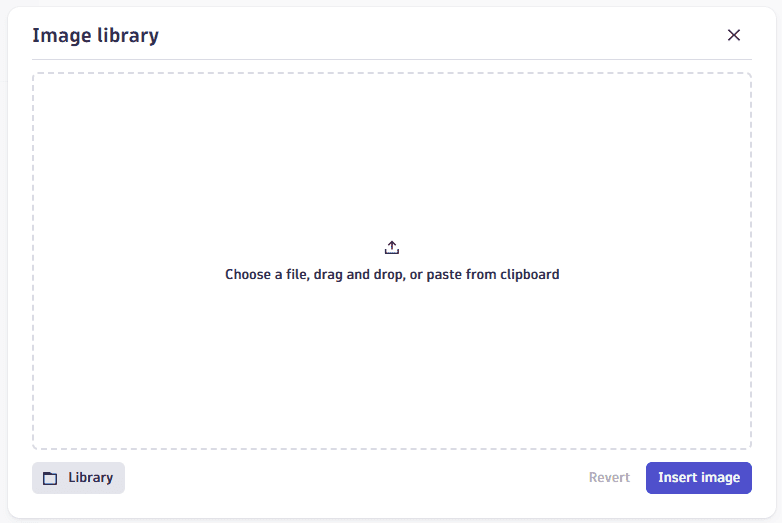
Upload your image file in one of three ways:
- Select
 and browse for the image file you want to upload.
 - Drag an image file to the window.
- Select Library and browse for an image from a library of uploaded images.
Platform | Dashboards
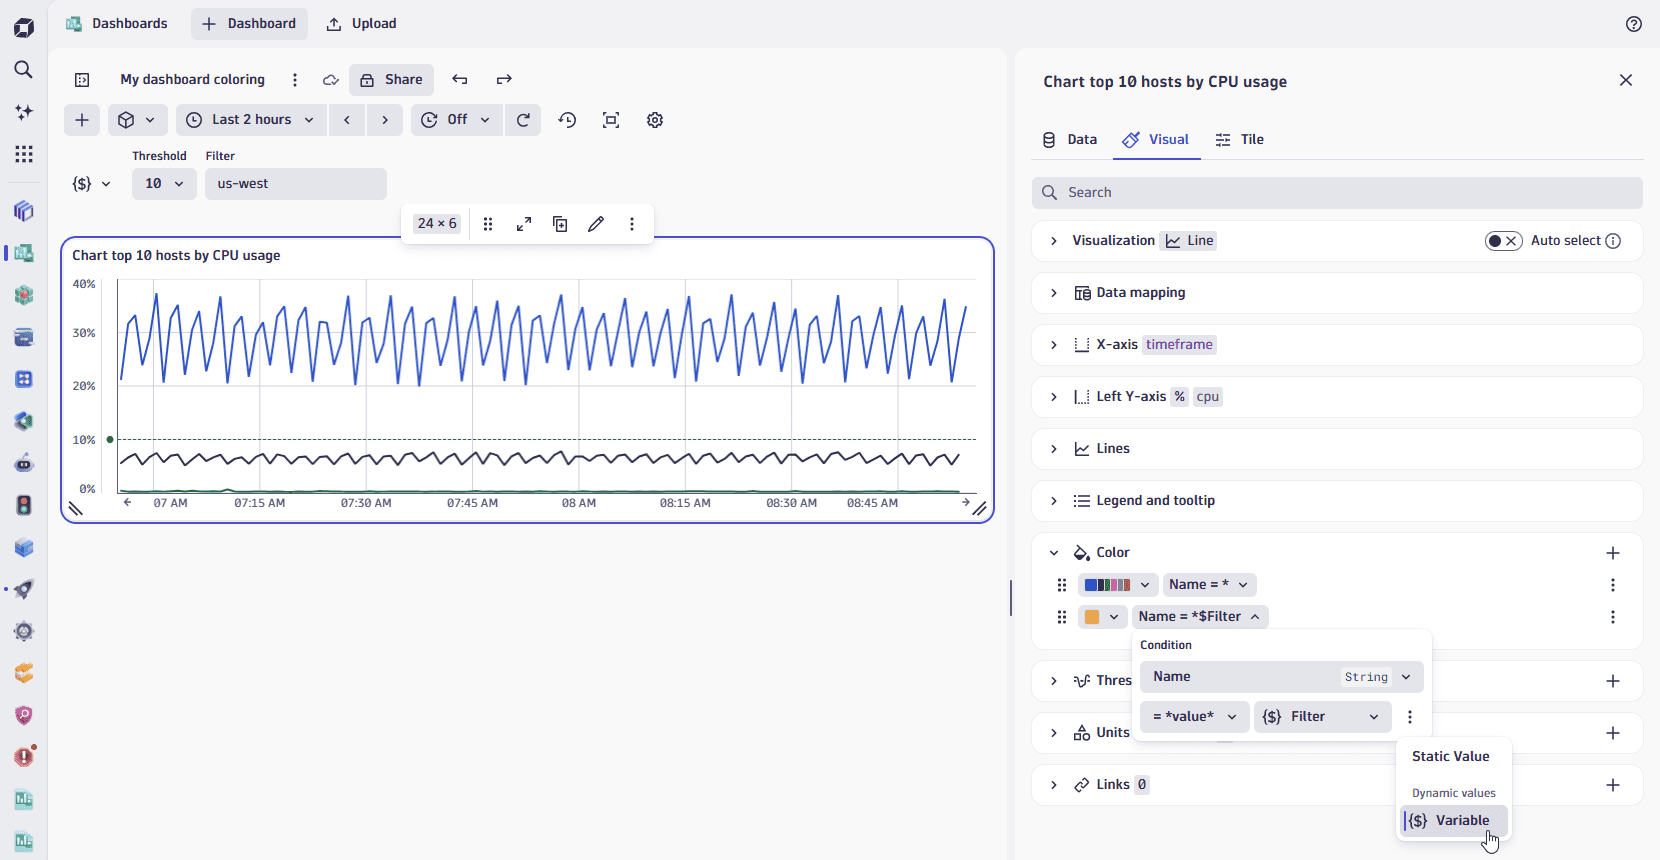
Use dashboard variables for dynamic coloring and threshold conditions
Building on our recently released coloring and thresholds enhancements, you can now use dashboard variables in your coloring and threshold conditions for fully dynamic styling.
- Select (Actions menu) next to the value input.
- Select Variable.
- Choose a variable that fits your condition.
Whenever dashboard variables change, your color and threshold rules are automatically re-evaluated—keeping your visualizations in sync with your selections.
Platform | Dashboards
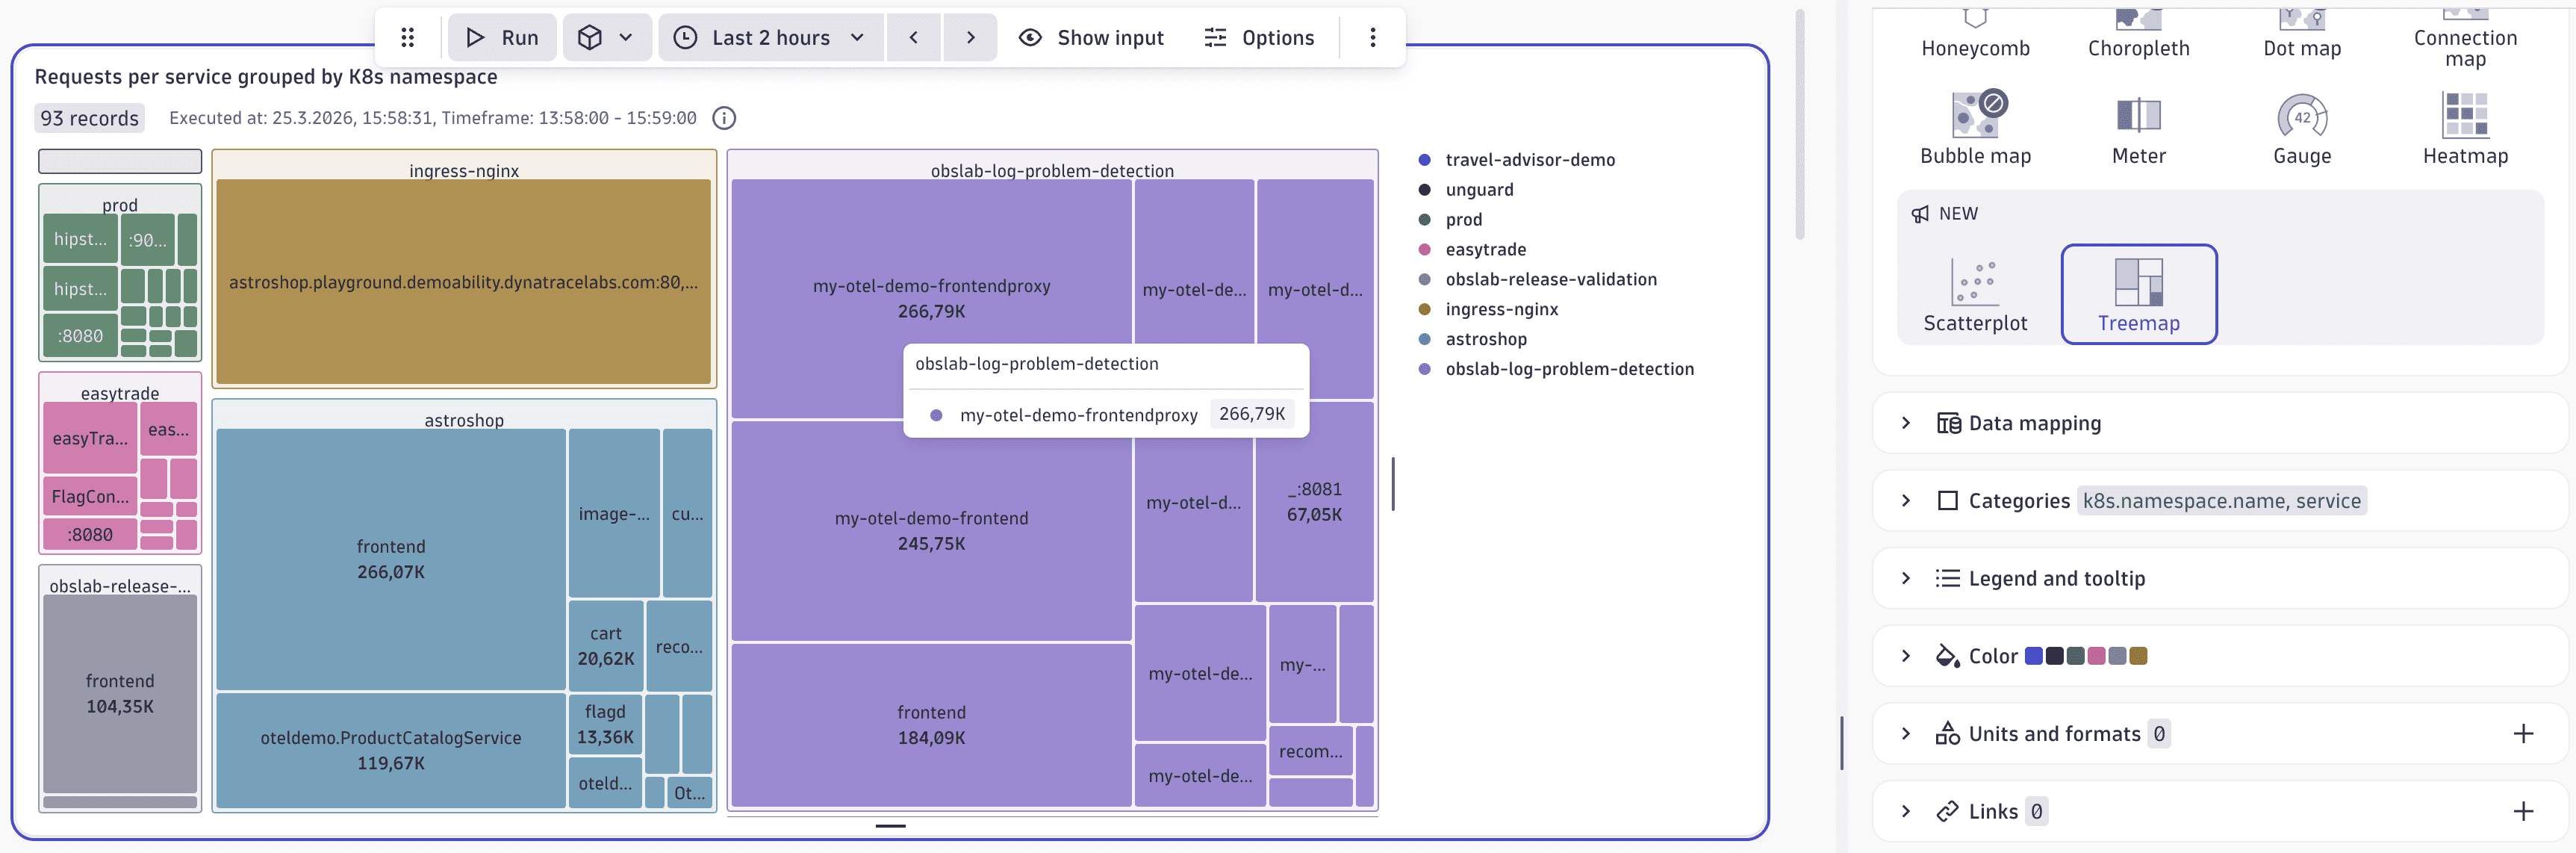
Spot dominant categories at a glance with new Treemap visualization
The new Treemap visualization is now available in Dashboards and Notebooks. It’s great for comparing proportions within hierarchical data across up to two levels.
Each rectangle represents a category or subcategory, and its size corresponds to the underlying value, making it easy to visually identify dominant categories at a glance.
A simple way to query data in a suitable format is to use the summarize command and group by two fields.
For example:
smartscapeNodes HOST| summarize count(), by:{cloud.provider, os.version}
The screenshot below shows a more complex example with the number of requests per service, grouped by Kubernetes namespace.
Platform | Dashboards
Table color options moved to new colors surface
In Dashboards and Notebooks, as part of our coloring and thresholds enhancements, the option to control where colors are applied in table visualizations is moved from the Cells settings to the redesigned Colors settings.
You can now choose whether a color rule applies to a specific value, a cell, row values, or a complete row—giving you more precise control over how your tables communicate critical information.
Platform | Dashboards
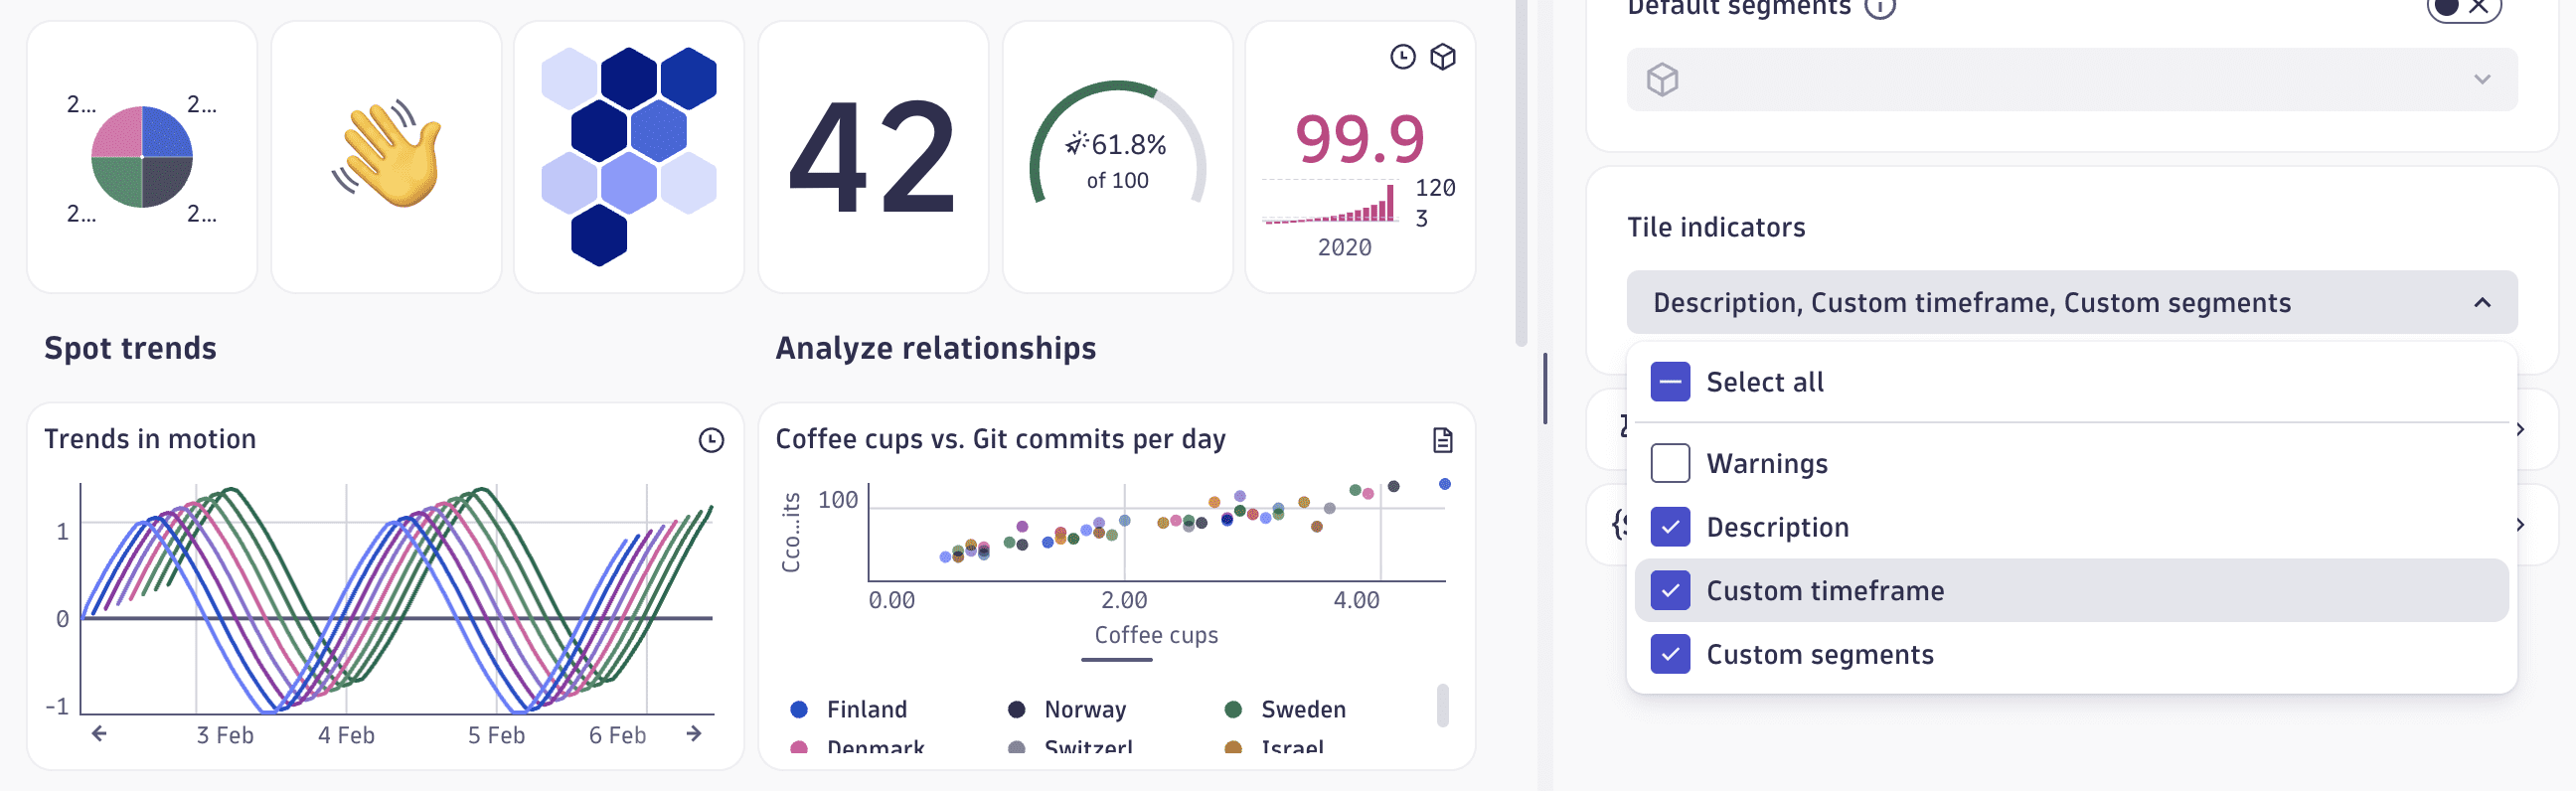
Control tile indicator visibility at the dashboard level
In Dashboards, you can now choose which tile indicators appear on your dashboard.
- Select (Settings) in the upper-right corner of the dashboard, and select Tile indicators.
- Select or clear the indicators for Warnings, Description, Custom timeframe, and Custom segments at the dashboard level. Use Select all to toggle all indicators at once.
Hiding unneeded indicators gives you cleaner dashboards by removing visual clutter when certain indicators aren't relevant to your audience.
Platform | Notebooks
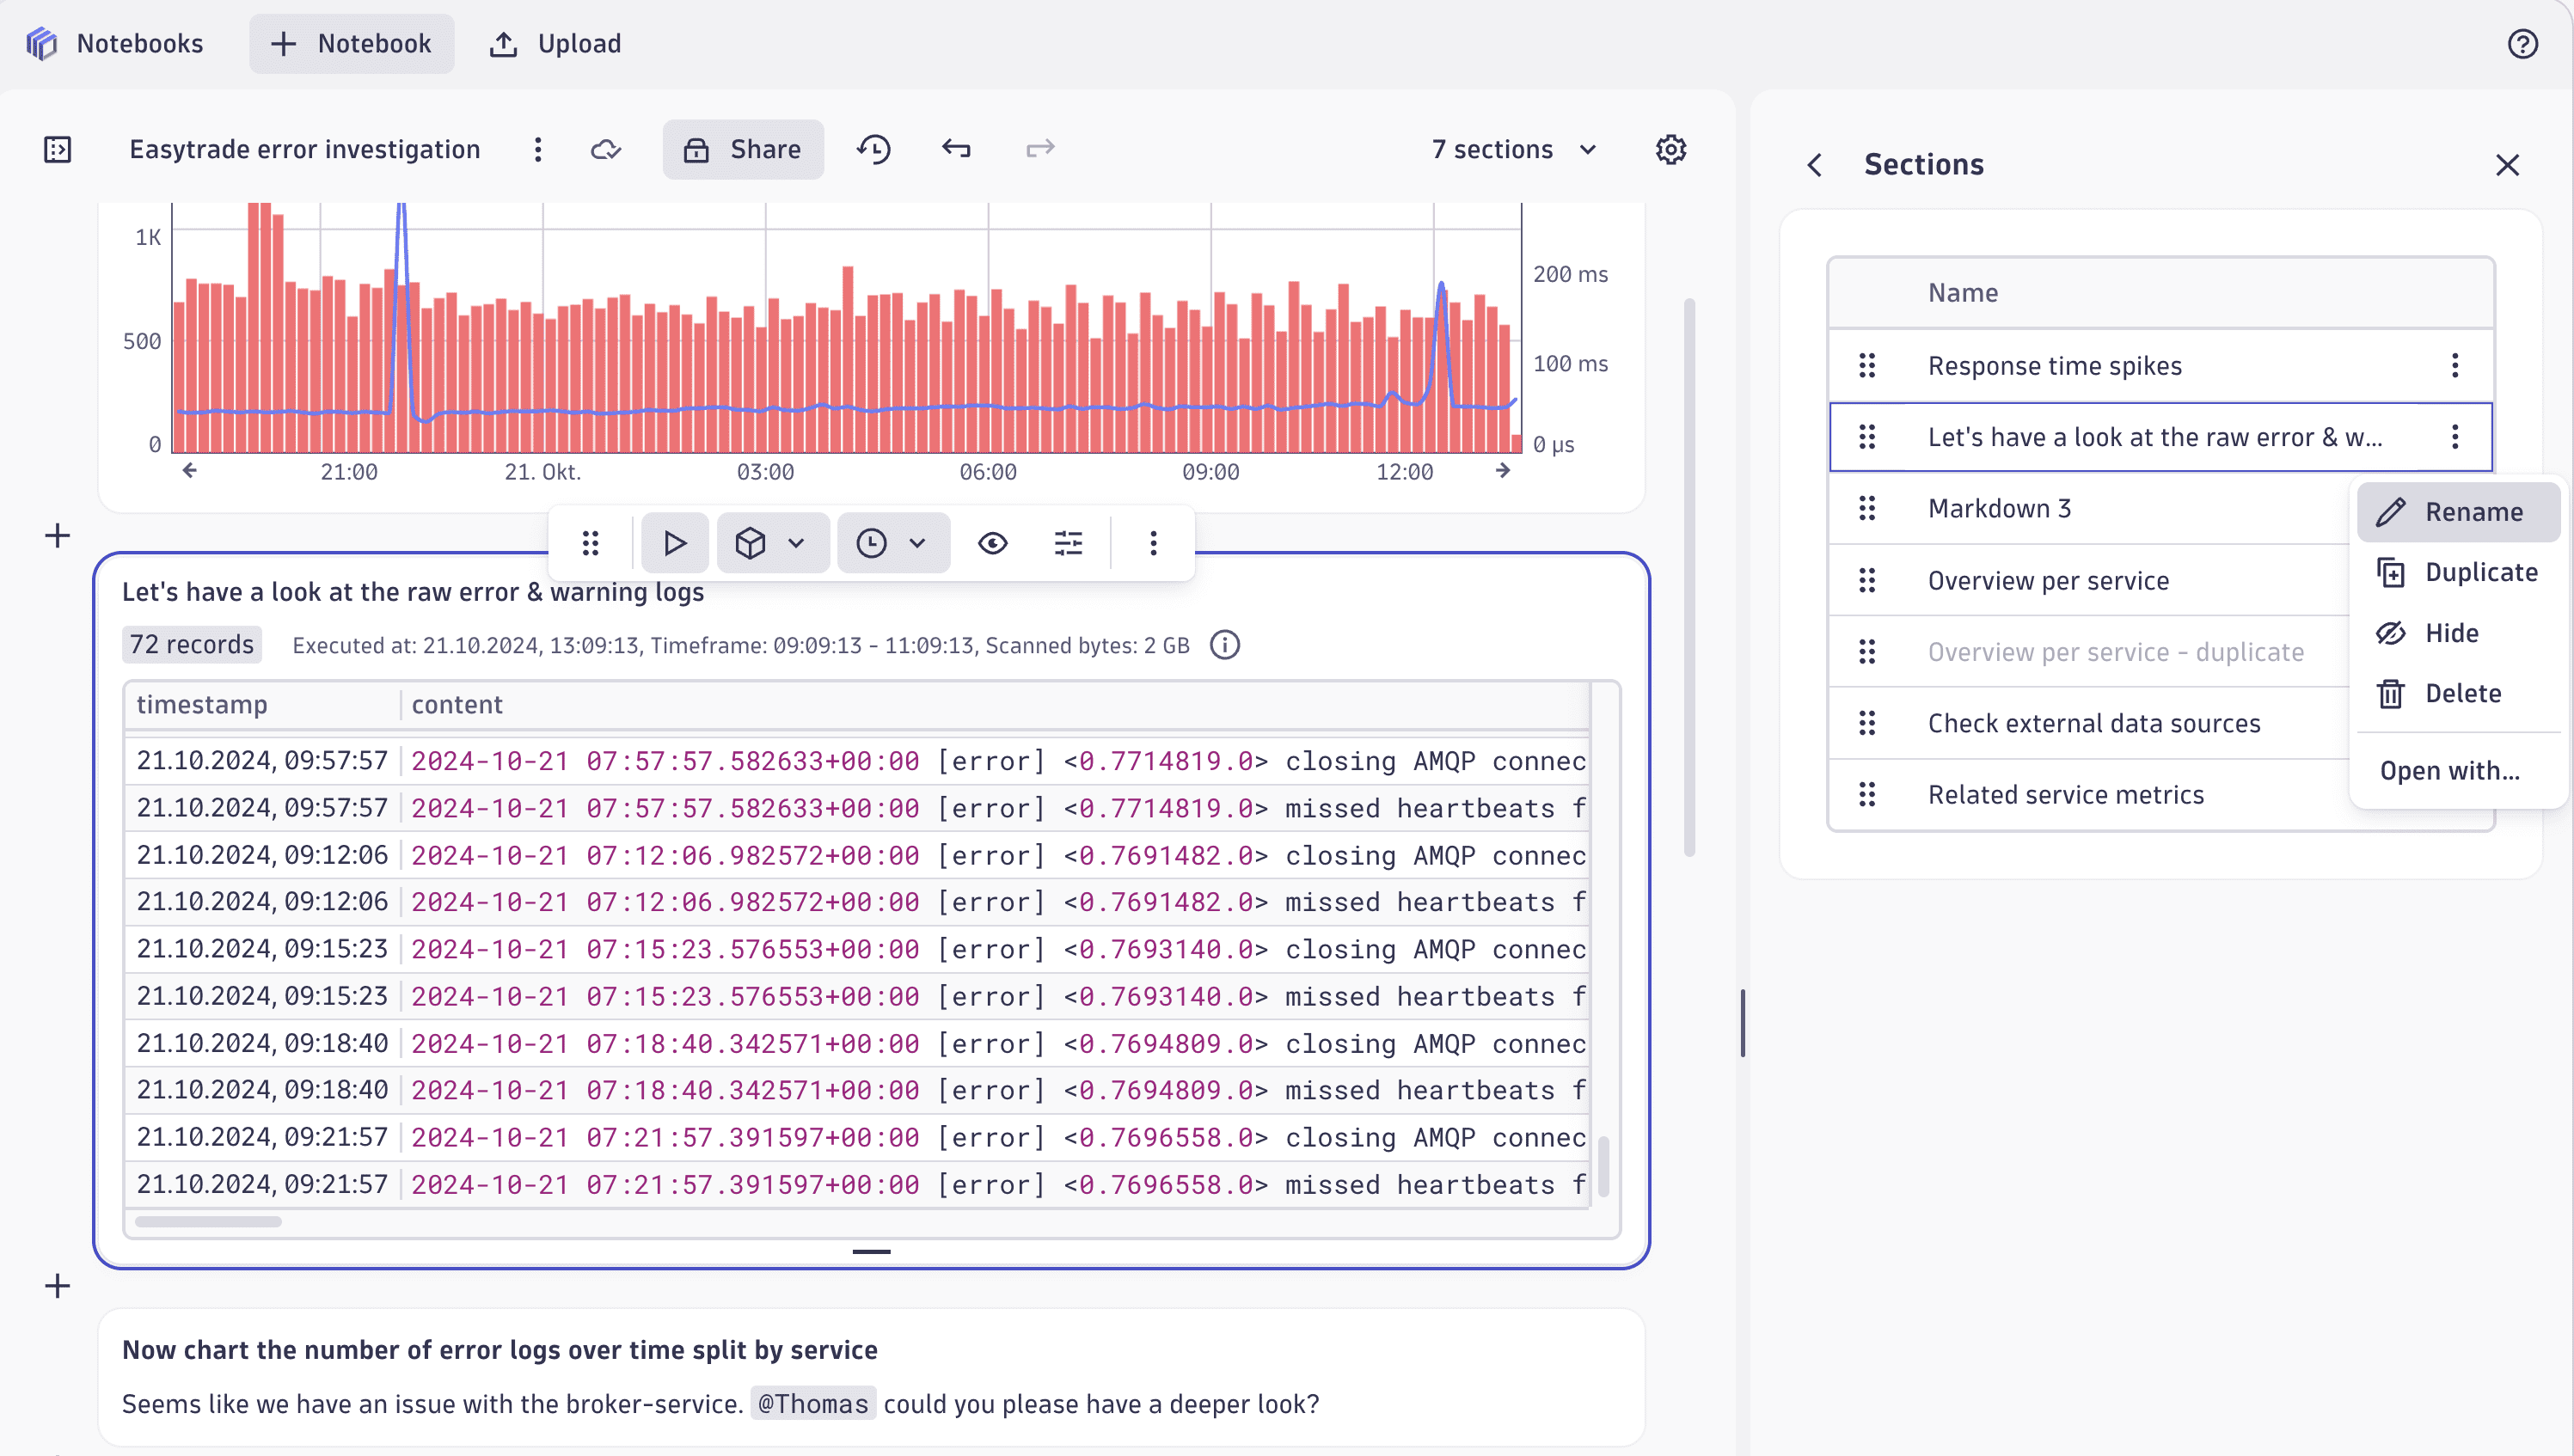
Navigate and organize large notebooks with the new Sections overview
Navigating and reorganizing large notebooks just got easier with the Sections overview.
To open the new Sections overview, select Settings in the upper-right corner of the notebook and select Sections.
- Alternatively, you can open the [section count] sections menu in the upper-right corner and select Manage sections.
From the Sections overview panel:
- To go to a section, select the section name.
- To reorder sections, drag them into new positions.
- Select (Actions menu) to access other section commands:
- Rename (or just double-click the section name to make it editable)
- Duplicate
- Hide
- Delete
- Open with
Platform | Settings
See settings schema stability with the maturity attribute
You can now understand the stability of a settings schema through the new maturity attribute in the Settings API - GET all schemas endpoint. It exposes PREVIEW, EARLY_ADOPTER, and GENERAL_AVAILABILITY to indicate schema stability.
Breaking changes
Infrastructure Observability | Extensions
Dashboards shipped with extensions have a more user-friendly ID scheme
Dashboards shipped with extensions now have IDs that follow the <extension-name>-<dashboard-name> pattern, which allows for easy cross-linking between dashboards within one extension. This change breaks the existing dashboard bookmarks: previous IDs are replaced with IDs based on the new pattern.
Infrastructure Observability | Hosts
Smartscape no longer creates host entities for app-only-monitored containers
Smartscape no longer creates a host entity when the only OneAgent on a host runs inside a container in application-only monitoring mode. Previously, this could result in host entities for nodes that weren't actually host-monitored, leading to misleading topology and metrics.
For example, in a Kubernetes cluster where OneAgent runs only inside a container in app-only mode, no host entity is created for the Kubernetes node.
Platform
New user permission required to share dashboards, notebooks, and launchpads
Users who work with dashboards, notebooks, and launchpads now require permission to execute dynatrace.documents.
- For users who rely on Dynatrace default policies, no changes are required.
- For all other users, you’ll need to update the relevant IAM policies according to the policy statement below. (Replace the
<app>placeholder with all relevant apps.)ALLOW app-engine:apps:run where shared:app-id in(<app>,”dynatrace.documents”);
This is due to changes that we’ve introduced to the internal sharing mechanism, which will help us roll out improvements more efficiently.
Platform | OpenPipeline
Made transaction.* attributes unusable for pipeline routing
Transaction attributes can no longer be used in pipeline routing rules. This includes:
transaction.is_root_spantransaction.is_failedtransaction.is_endpoint_requesttransaction.is_message_processingtransaction.is_faas_invocationtransaction.service_mesh.is_root_spantransaction.service_mesh.is_failed
Fixes and maintenance
Resolved issues in this release (SaaS)
- Improved container instrumentation rules to prevent accidental instrumentation of OpenShift 4.14+ platform components. This improves performance and reduces overhead. (OA-61720)
- Fixed an issue where multiple threads could trigger redundant reconnections to the data store after a connection reset, causing unnecessary load and potential instability. (MGD-11060)
- Fixed an issue where the
structurequery parameter was ignored on requests to the SaaS Log ingestion API endpoints. The parameter is meant to override the data model for a single request, but affected requests always used the environment's default data model instead. (ICP-3080) - Fixed an issue where anomaly detectors with schema version 1.0.12 or earlier could not be saved when the
actorfield was not explicitly set. (DI-27005) - Fixed an issue where service-level and application-level root causes were only shown in
 Problems Classic. Now,
  Problems also shows these root causes, so both views are consistent.
 - Fixed an issue where the event count in Problems in the problem details view did not match the event counts in the event table. The summary count and event table count now align. (DI-26173)
- Fixed an issue where page resizes were not accounted for when replaying RUM sessions via Session Replay (moving the renderer back in time). (DEM-21951)