What's new in Dynatrace SaaS 1.334
- Release notes
- 4-min read
- Rollout start on Mar 10, 2026
This page showcases new features, changes, and bug fixes in Dynatrace SaaS version 1.334. It contains:
Business Analytics
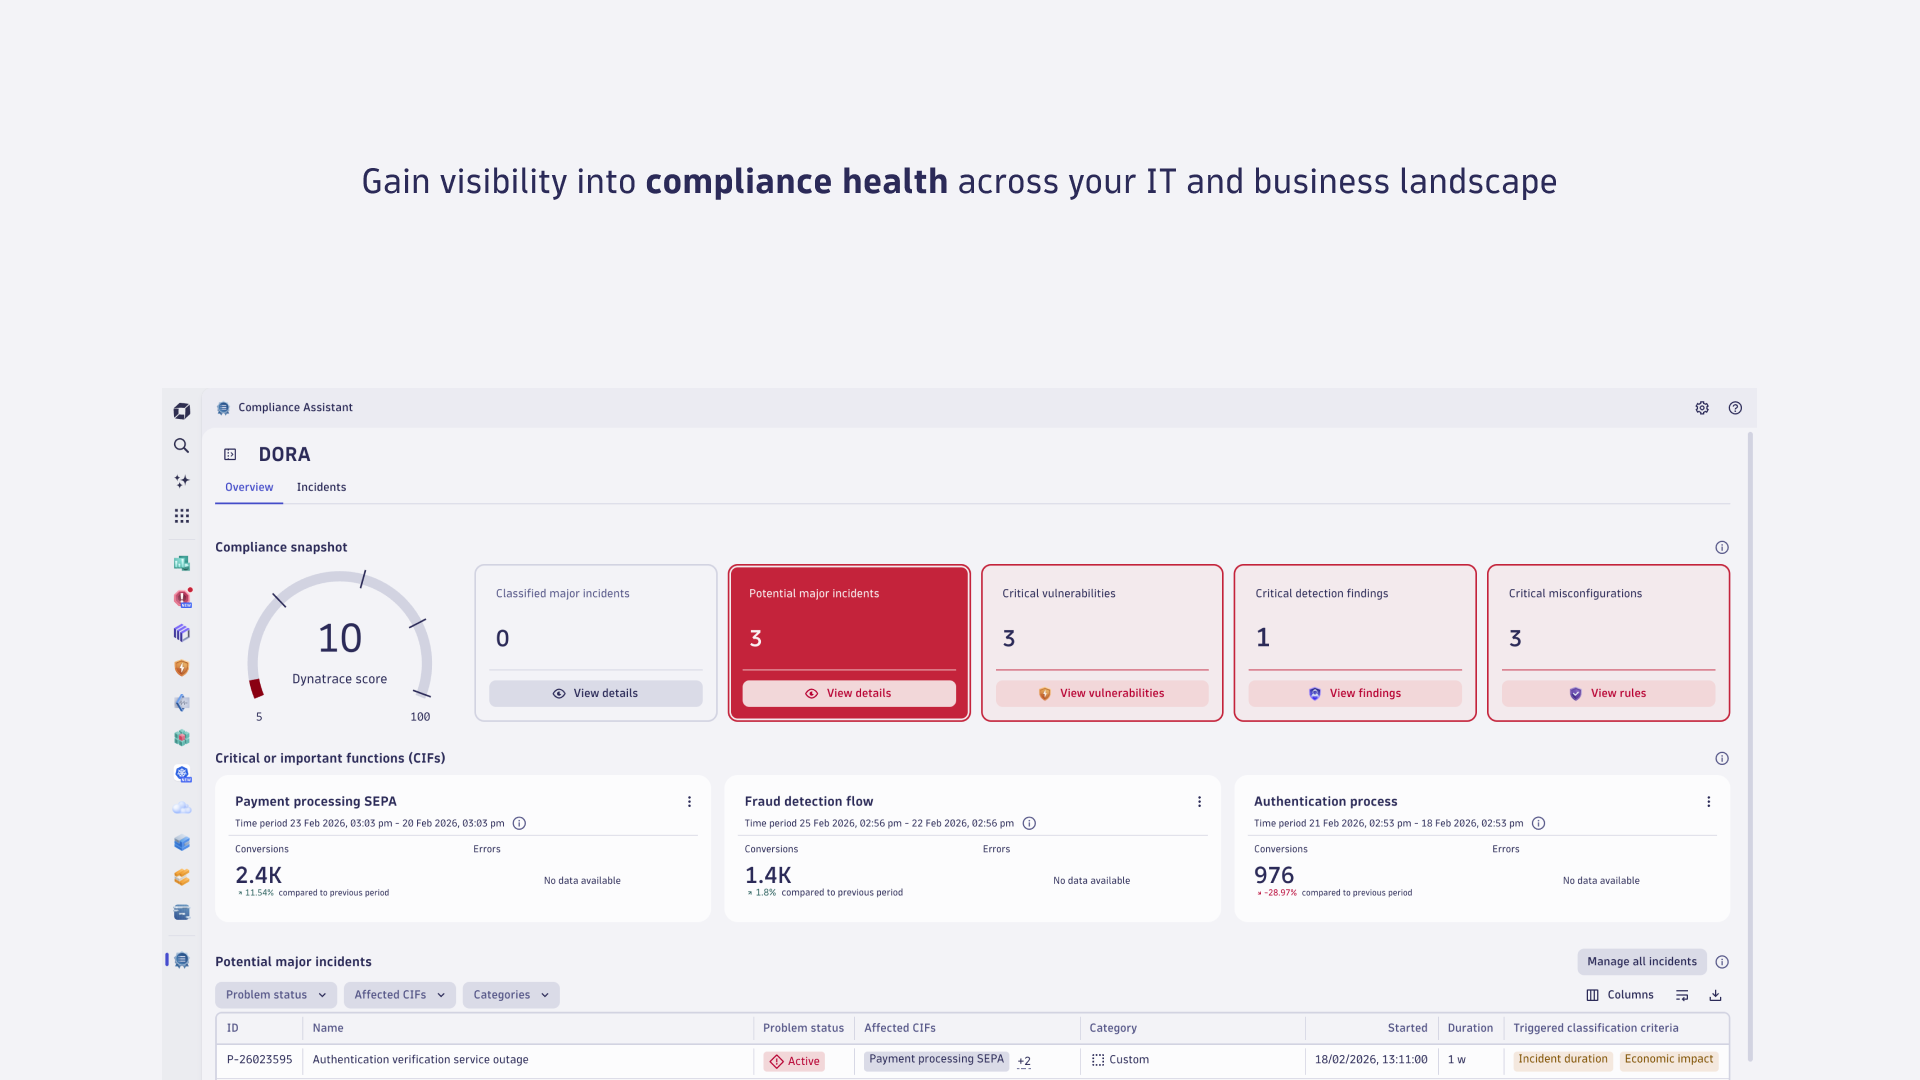
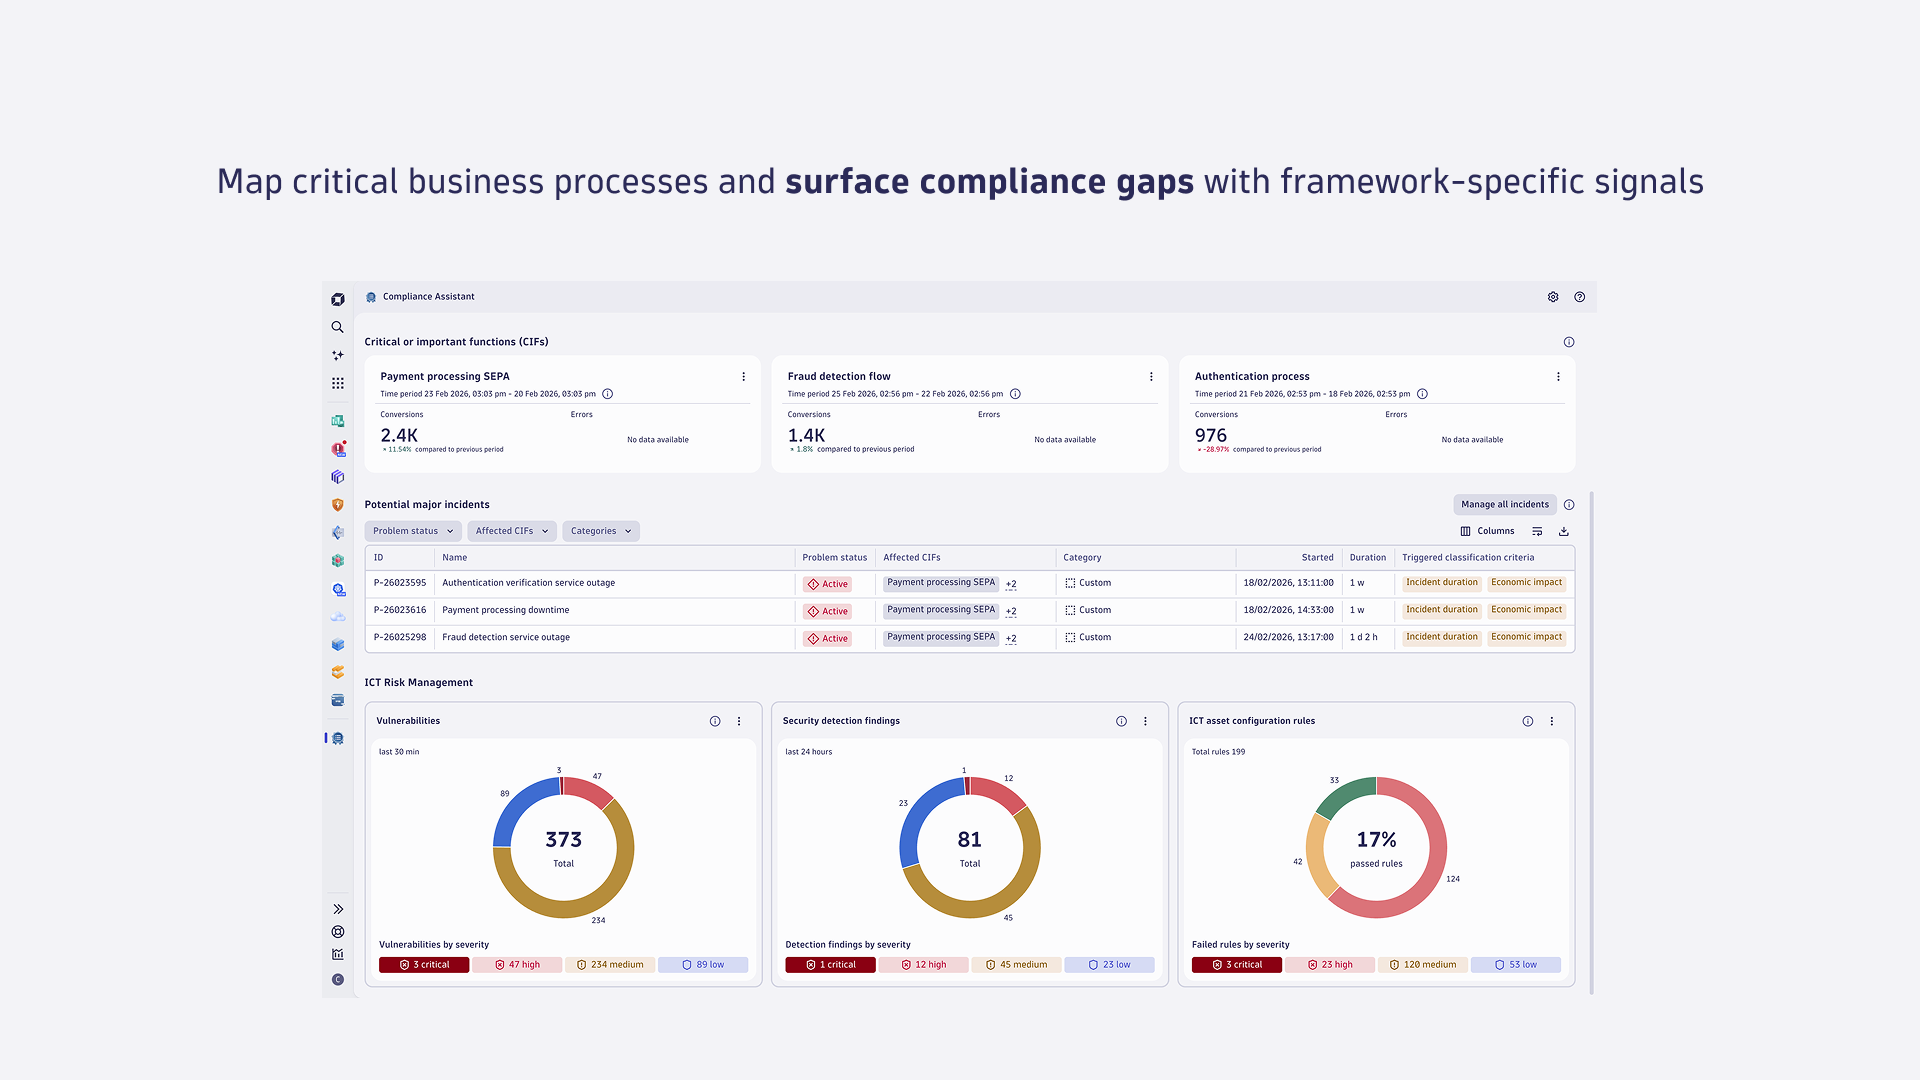
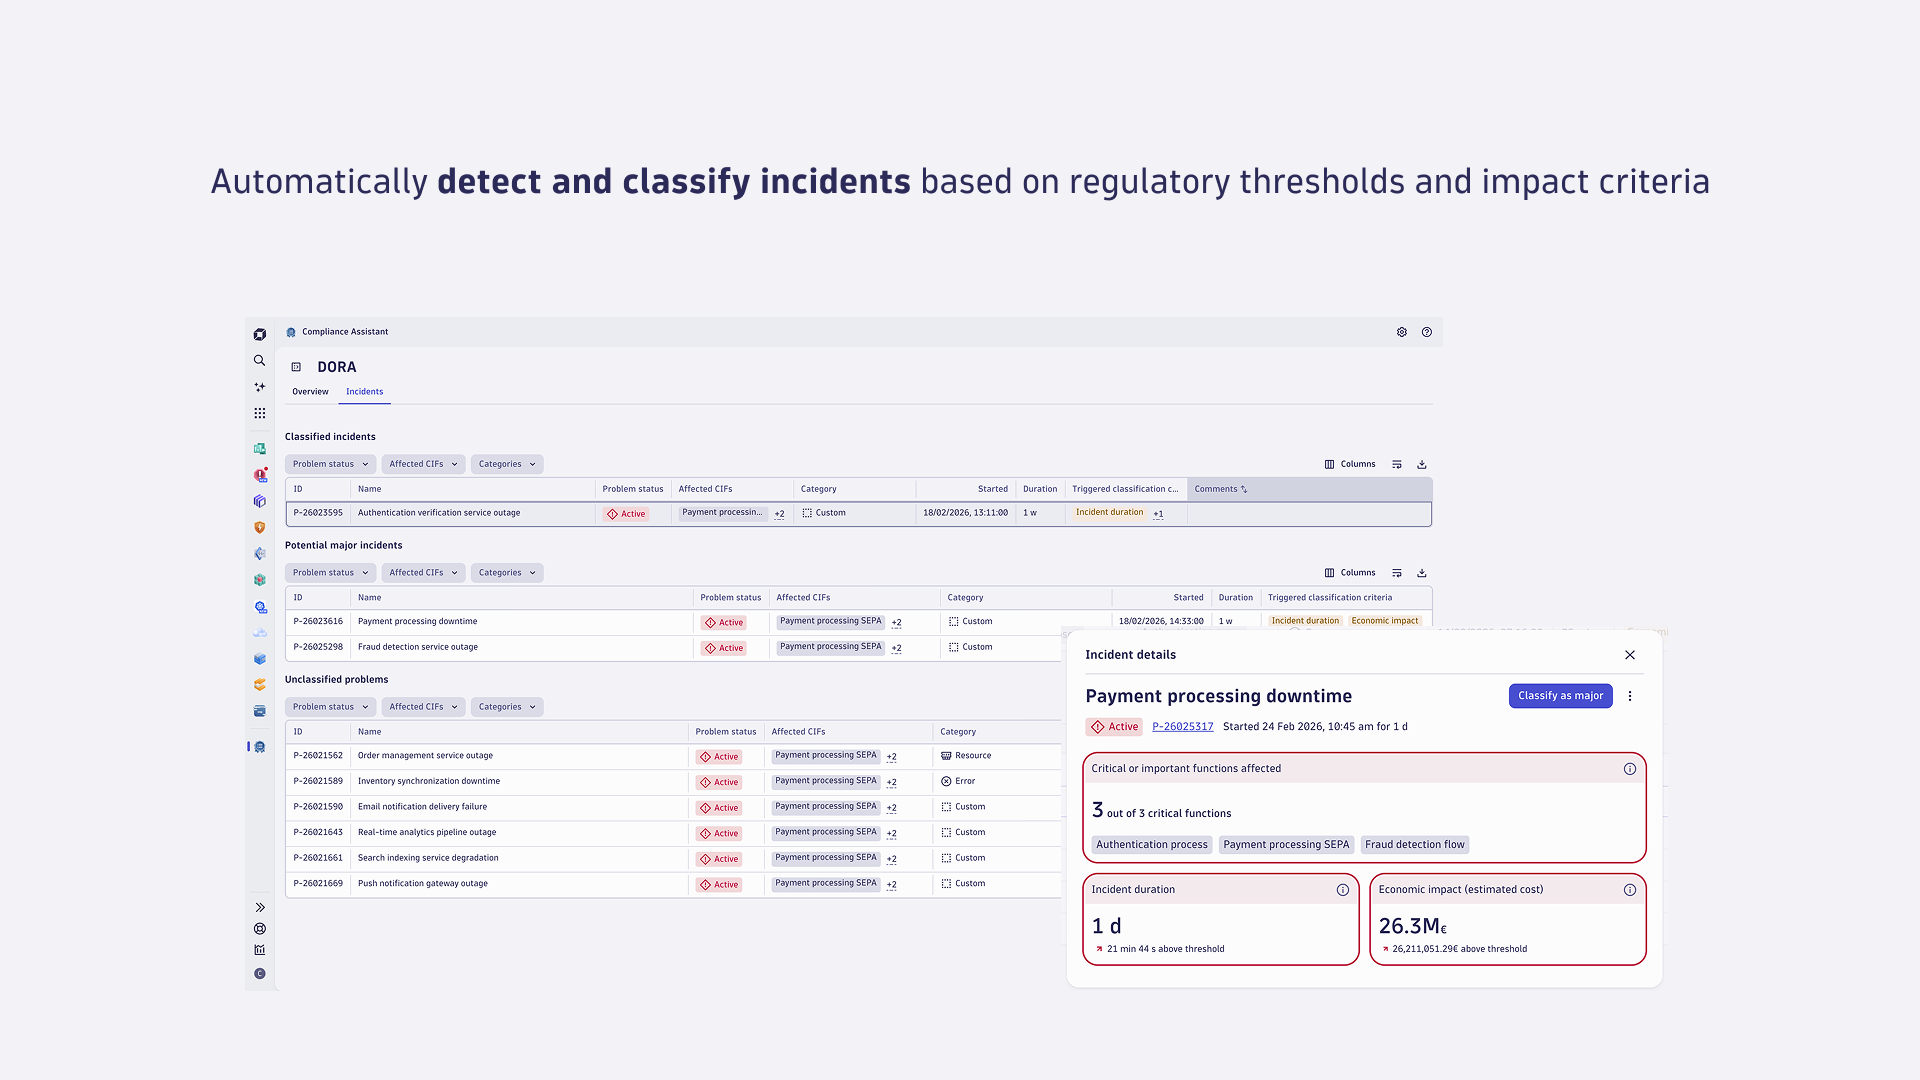
Compliance Assistant is now in GA
Dynatrace Compliance Assistant has been released to General Availability (GA), enabling you to track, manage, and automate compliance across your IT and business landscape. Compliance Assistant now supports the EU DORA Regulation compliance framework with the key capabilities to:
- Identify critical or important functions (CIFs) mapping compliance-relevant IT assets to critical business processes using Business Flow.
- Proactively mitigate risks with real-time visibility into compliance health.
- Automate incident classification in line with regulatory criteria to simplify regulatory reporting.
For more information, see:
Feature updates
Account Management | Subscriptions and Licensing
Get subscription overview for your DPS for Hybrid setup
If more than one account consumes from your DPS subscription commit, you can now see the total consumption in the Account Management portal.
Every user with View account permissions on one of the consuming accounts can view the breakdown of total DPS consumption across all consuming accounts, unless configured otherwise.
The API for accessing this data is planned to be available in the upcoming releases.
Application Observability | Distributed Tracing
New automatic instrumentation for AWS Lambda in Go
We added new AWS Lambda layers for automatic Go instrumentation (tracing, log correlation). The new support includes the generic AWS SDK and SNS.
Application Observability | Log Analytics
Updated replacement strings for built-in masking rules
We introduced new replacement strings for built-in masking rules. The matching patterns are unchanged. To avoid backward compatibility problems, the previous rules are kept and renamed with [Outdated-Built-in] prefix. You can modify or delete the previous rules at any time.
Application Security
CIS benchmark version update for AKS and EKS
We now support CIS Benchmark 1.8.0 for both Azure Kubernetes Service (AKS) and Amazon Elastic Kubernetes Service (EKS). This update ensures compliance with the latest security recommendations and improved alignment with industry standards.
Application Security
CCSS-based severity classification for SPM benchmark rules
The severity classification scheme for benchmark rules in  Security Posture Management now adopts the Common Configuration Scoring System (CCSS). Via this unified framework for evaluating and assigning severity levels, rule severity is determined consistently and security‑driven across all supported benchmarks. For details, see Strengthen your security posture with the Common Configuration Scoring System for misconfigured production environments.
Application Security | Vulnerabilities
Library and Kubernetes vulnerability scanning now uses the Dynatrace Vulnerability feed
Library and Kubernetes vulnerability scanning now relies on the Dynatrace Vulnerability feed. This update delivers more accurate, transparent, and threat‑aware vulnerability data while preserving strong coverage of critical risks. As part of this change, a small percentage of previously detected vulnerabilities will no longer be covered and will be marked as Deprecated. You can review them using the Status > Deprecated filter. For more information, see Introducing the Dynatrace Vulnerability feed: Accurate, transparent, and threat-aware..
Infrastructure Observability | Kubernetes
") Kubernetes app onboarding
Kubernetes app onboarding
You can now include permissions for ConfigMaps and Secrets when connecting your new cluster via Kubernetes onboarding page.
Platform | Dashboards
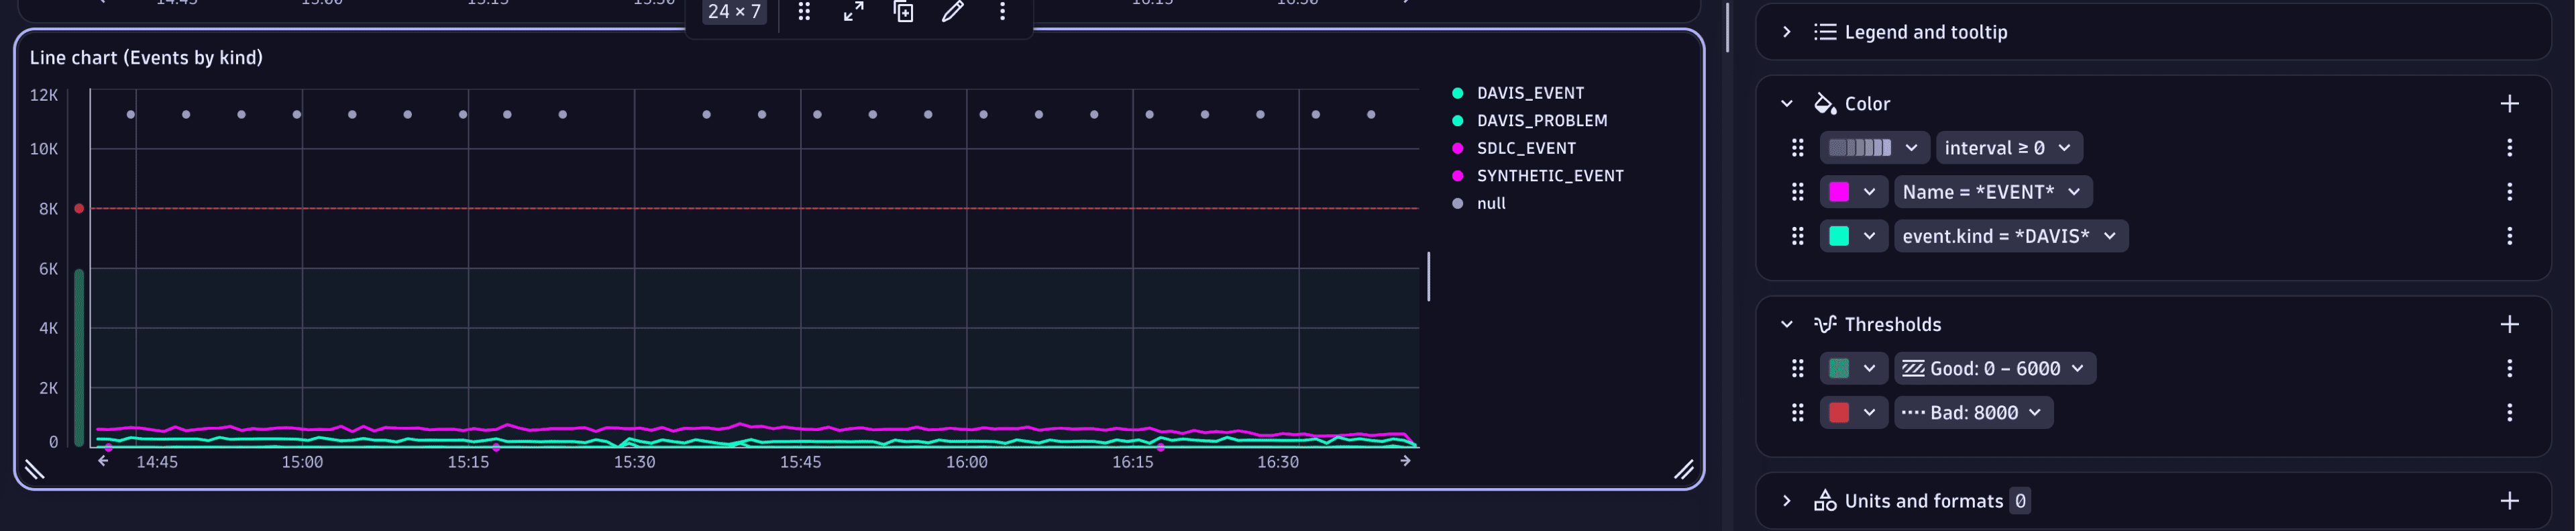
Enhanced coloring and thresholds for Dashboards and Notebooks
We enhanced color and threshold settings for charts in  Dashboards and
  Notebooks.
-
Charts now share a unified coloring surface and web UI across all chart types and support combining palettes with color overrides.
Color overrides can be sorted, and each entry includes actions such as moving up or down, duplicating, and deleting. Override conditions expose operators that change dynamically based on the selected field.
Your existing color configurations and the persisted data model are auto-migrated to the new controls.
-
Thresholds now have a dedicated collapsible section, matching the web UI of color and unit settings.
The section lists available thresholds and their settings. For each threshold, the following settings are available: a color picker, an enriched configuration dropdown, and an action menu to move, duplicate, or remove entries. The thresholds configuration includes the following options: range or line display, color-fill, axis (left/right), label, and minimum or maximum values based on static or dynamic fields or variables.
Thresholds in this section can be ordered, and order is relevant. If more than one threshold applies to a value, the last threshold in the list has priority.
Platform | DQL
Calculate weighted percentiles with DQL
The percentile and median aggregation functions in the summarize and makeTimeseries commands now provide an optional weight parameter. You can use the weight parameter to compute the approximate weighted percentile or median, where the number of occurrences of each value is scaled with the respective weight.
Platform | DQL
New function in DQL to calculate percentiles from aggregated spans
The percentileFromSamples aggregation function is now available for the summarize and makeTimeseries commands. The new function, which works similarly to the existing percentile aggregation function, is designed for cases where each record has an array of values, such as the duration samples in aggregated spans. You can use the originalCount parameter to weight the samples.
fetch spans| filter isNotNull(aggregation.duration_samples) and isNotNull(aggregation.count)| summarize p95 = percentileFromSamples(aggregation.duration_samples, 95, originalCount: aggregation.count)
Platform | Grail
Enriching queries with lookup tables now generally available
Lookup tables in Grail are now available to customers of the latest Dynatrace with DPS licensing. For more information, see Lookup data in Grail.
Starting with Dynatrace SaaS version 1.334:
- The maximum number of files per environment increases to 10,000.
Starting with Dynatrace SaaS version 1.335:
- The usage of lookup data in Grail generates Events powered by Grail consumption.
For existing lookup data in Grail uploaded during the preview, no changes are needed.
Software Delivery | Ecosystem
Jumpstart automation with Workflow Templates
Workflow templates are now available in  Workflows. When you create a workflow, you can browse a library of pre-built, ready-to-use automations for common scenarios, pick a template, customize it to your environment, and activate it in minutes. No workflow expertise is required. Templates are available for popular integrations, including PagerDuty, ServiceNow, Slack, Microsoft Teams, AWS, Kubernetes, Red Hat Ansible, Jenkins, and GitLab, as well as AI-powered automation agents built on Dynatrace Intelligence.
Breaking changes
Platform | Dynatrace Intelligence
Holiday-aware baseline modification is disabled by default
The holiday-aware baseline is disabled by default for all users.
If you want to enable it, go to Settings Classic > Anomaly detection > Holiday-aware baseline modification.
Digital Experience | Synthetic
Update to on_demand_execution event (v1.2.0)
The on_demand_execution event has been updated to version 1.2.0.
The execution.scheduling_timestamp and execution.data_delivery_timestamp fields now use the timestamp format instead of numeric (long), improving clarity and consistency. The new format is also adopted in the web UI.
Platform
Use Smartscape queries instead of classic entity queries
We have entered a transition phase to migrate all of Dynatrace to the new Smartscape storage. Therefore, classic entity queries and the classic Monitored entities API should no longer be used. Classic queries remain fully supported for the next year. Your existing DQL queries using the classic entity model continue to work.
We recommend exploring and becoming familiar with the Smartscape enhanced topology model (Dynatrace version 1.330) and, when available, transitioning to the new Smartscape storage features. Note that Smartscape storage does not yet cover all entity types. You can review the latest state of the new model in the Semantic Dictionary.
Dynatrace will provide dedicated migration guidance and tooling to help you transition from classic entity-based queries to Smartscape-based queries.
Fixes and maintenance
Resolved issues in this release (SaaS)
- Fixed missing information in events for APM services in Grail about the related Kubernetes workloads. (INFOBS-5542)
- The response of the
/platform/management/ingest/v1/dqlProcessor/verifyand/platform/management/ingest/v1/matcher/verifyendpoints, when the request body is missing, has been changed toHTTP 400 Bad Request. Previously, it wasHTTP 500 Internal Server Error. (PPX-9510) - Fixed issue where the high NIC usage threshold setting changed only the transmission threshold. This setting now changes both the transmission threshold and the received threshold. (OA-60782)
- Resolved failed entity attribute persistence due to invalid Kubernetes label values. (MGD-9439)
- In
 Azure Classic, the Azure Application Gateway services' Further details tab no longer redirects to
  AWS Classic. (INFOBS-7465)
 - Changed values of
dt.agent.monitoring_modefield to be consistent with Dynatrace Platform and the Semantic Dictionary. (ICP-320) - Fixed validation error of the Alerting Profile setting that was shown when an invalid management zone was entered. (DI-25814)
- You can now view error details of errors without a response on the User action analysis page. (DEM-21758)
- Mobile errors with new line characters now display error details instead of an empty page. (DEM-21498)
- We refreshed the public suffix list that Dynatrace relies on to automatically determine cookie domains. If a cookie domain isn’t configured, Dynatrace selects the effective top‑level domain plus one (eTLD+1) based on the current public suffix list. (DEM-21162)
- Error details where the response value is empty now load data under the Error details page, instead of returning
HTTP 400 Bad Request. (DEM-18267) - The JSON unwrapping feature now supports cases where the entire content field contains an escaped JSON object. Fully escaped payloads are now detected and unwrapped. (APPOBS-32163)