What's new in Dynatrace SaaS 1.335
- Release notes
- 9-min read
- Rollout start on Mar 24, 2026
This page showcases new features, changes, and bug fixes in Dynatrace SaaS version 1.335. It contains:
Platform | Dashboards
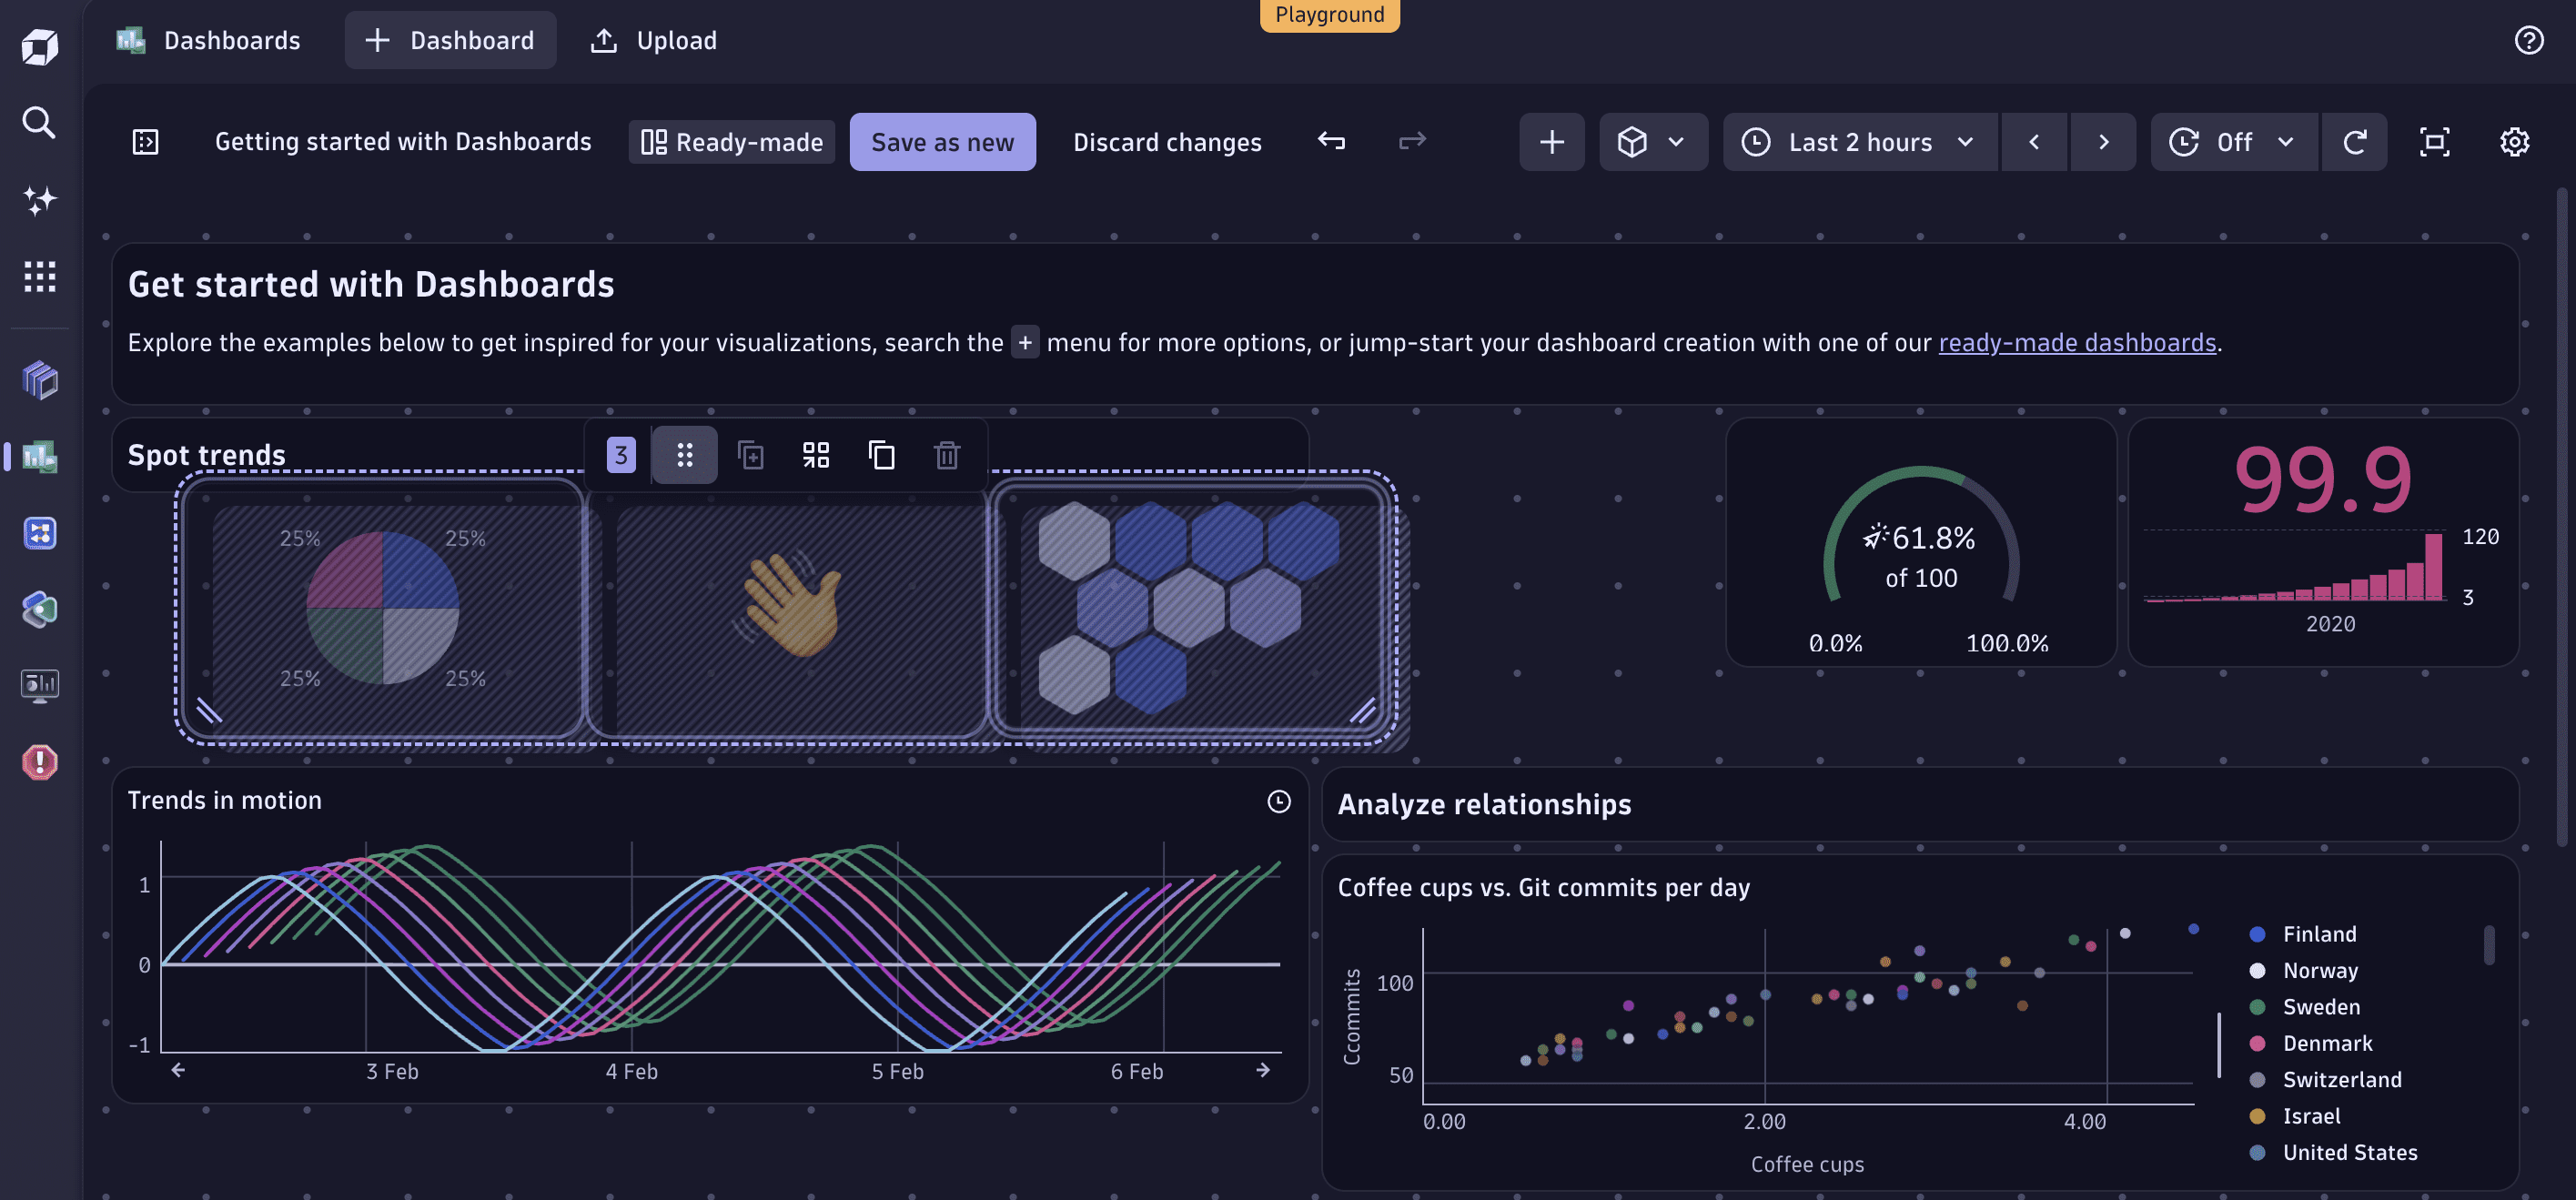
Build and refine dashboard layouts faster with smarter tile management
In  Dashboards, we improved how you add, duplicate, resize, and move tiles on your dashboard grid—so you spend less time arranging and more time analyzing.
- Resize multiple tiles at once. Select several tiles and resize them simultaneously.
- Add tiles in place. Use the button on a tile edge to insert a new tile. If space is available, it's placed automatically; otherwise, the existing tile is split to fit.
- Duplicate tiles without breaking your layout. Duplicates are placed in the nearest available space next to the original. If none exists, the original tile is split to accommodate the copy.
- See where new tiles land. Both add and duplicate show a drop zone preview before placement.
- Place tiles with precision. Tiles become transparent during resize and movement, so you can see the grid underneath and snap tiles exactly where you want them.
Feature updates
Account Management
Verify IAM changes with the new audit log for accounts
The highly requested account-level audit log is here. Within the Account Management portal, you can now search for changes to your access management settings, including group to permission bindings, changes to policies and boundaries, as well as changes to user to group membership for non-federated groups. The functionality is available via UI and API.
In the future, we will extend the audit log functionality to cover subscription and licensing-related changes, as well as other settings in the Account Management portal.
Account Management | Identity Access Management
Welcome future users with the new account invite process
The new account invite process includes the following updates:
- A new interface for inviting users to an account with direct group assignment.
- Inline group creation and permission assignment for invited users.
- Users must confirm their invitation via email before they can access their Dynatrace account.
- After accepting the invitation, users are presented with an overview of the environments they have access to.
Application Observability | Log Analytics
Log Monitoring Classic end-of-life
With this release, Log Monitoring Classic is automatically upgraded to Log Management and Analytics in SaaS environments that have not ingested logs in the past 90 days. Environments actively ingesting data to Log Monitoring Classic are currently not impacted. This change is the second milestone in the end-of-life for Log Monitoring Classic SaaS.
The next and last milestone will arrive in January 2027, when all remaining Dynatrace SaaS environments with Log Monitoring Classic will be automatically upgraded to Log Management and Analytics.
We recommend upgrading Log Monitoring Classic to Log Management and Analytics ahead of end-of-life, following this guide. See also the first announcement of the end-of-life for Log Monitoring Classic SaaS.
This announcement does not impact Log Monitoring Classic on Dynatrace Managed or Log Monitoring APIs on Dynatrace Managed.
Application Observability | Log Analytics
Understand and optimize Logs usage with the new Usage - Logs ready-made dashboard
Visualize your Logs usage across the platform with the new Usage - Logs ready-made dashboard. With this dashboard, you can now:
- Spot query consumption spikes: Identify sudden increases in query activity and dive into the source.
- List expensive dashboards and notebooks: See which dashboards and notebooks drive the most log usage.
- Retain with Included Queries visualizations: Inspect the buckets retention and usage of included queries.
Find the new dashboard at Dashboards > Ready-made dashboards > Usage - Logs.
The ready-made dashboard Log query usage and costs is now deprecated and will be removed by the end of June 2026. You can create a local copy to keep using it. Use Usage - Logs going forward.
Application Observability | Services
Service request metrics are now enriched with primary Grail fields and primary Grail tags
Service request metrics (dt.service.request.*) are now automatically enriched with primary Grail fields and primary Grail tags whenever these exist on the source span. This includes AWS fields (aws.account.id, aws.region), Azure fields (azure.location, azure.resource.group, azure.subscription), GCP fields (gcp.region, gcp.project.id), and primary tags (primary_tags.__KEY__). These modifications allow you to set up Segments and permissions in Grail, or use ready-made Segments (for example, for Kubernetes Namespace). They also streamline filtering in all Dynatrace apps, including  Notebooks and Dashboards.
Application Security
Updated golang library to version 1.25.7 in Kubernetes Node Configuration Collector (NCC)
We have updated the golang library to v1.25.7 in Kubernetes Node Configuration Collector (NCC) to address known vulnerabilities. The NCC image was released as version 1.5.4.
Business Analytics | Business Analytics
Improved support for Business Observability
A new Get started with business observability banner is now available in  Explore Business Events. This enhancement provides a direct way for you to connect with Dynatrace services to accelerate your journey into business observability:
- Quickly reach out to the Dynatrace services team for guidance on deriving value from business events and business observability use cases.
- Move faster from exploration to impact by implementing business event–based insights.
Infrastructure Observability | Hosts
Combined process grouping rules
This update combines the Simple detection rules, Advanced detection rules, and Declarative process grouping rules into integrated process grouping rules. You can now overwrite built-in detection rules and redefine process grouping and detection to activate split, merge, or no-monitoring. This combination now allows grouping based on environment variables, processes, properties, and user-defined strings. The same rules now apply across all agents and modes, reducing uncertainty about the right settings to change the default grouping. See more in Process grouping rules.
Platform | CoPilot
New tenants: Generative AI enabled by default
Generative AI is now enabled by default for all new tenants. This change allows admins to opt out rather than requiring them to opt in to use features like DQL generation in Notebooks or Dashboards, and Dynatrace Assist in non-agentic mode.
To use agentic mode in Dynatrace Assist, admins still need to enable it explicitly in ![]() Settings.
Settings.
This change only affects tenants created after Dynatrace version 1.335 is rolled out. For older tenants, both agentic and generative AI will remain disabled unless they were explicitly enabled before.
Platform | Dashboards
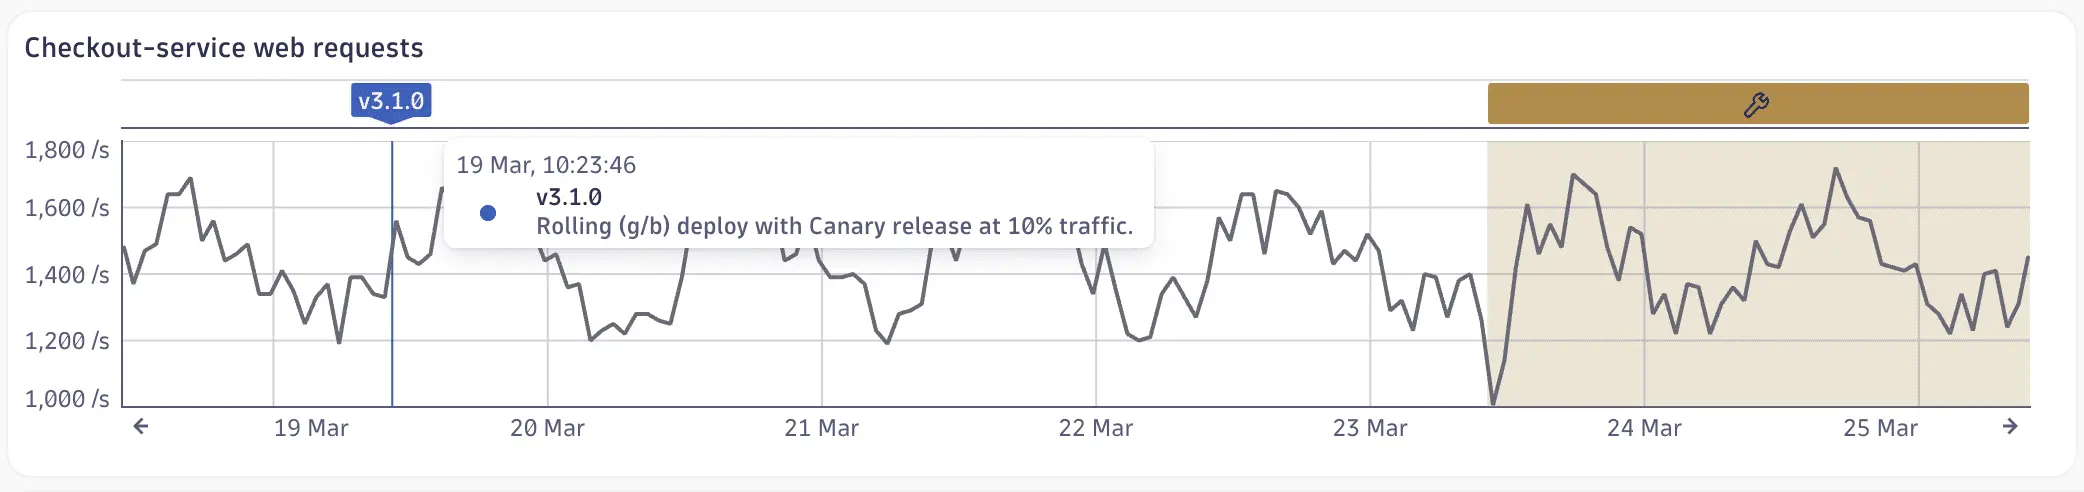
Correlate events with metric trends using annotations in Dashboards for faster troubleshooting
In Dashboards, you can now use annotations to highlight significant events such as deployments, alerts, problems, and custom events directly on your timeseries charts.
- Annotations are powered by DQL or code, so they update automatically as new data arrives.
- A global selector gives you instant control over which annotations are visible, letting you isolate specific event types while troubleshooting.
This means you spend less time switching between tools and more time understanding why a metric changed.
For details, see Add annotations to a dashboard.
Platform | DQL
New aggregation for histogram metrics
You can now use the percentRank aggregation with the timeseries and maketimeseries commands to calculate the fraction of observations below a specified threshold. This aggregation performs the inverse of the percentile aggregation. For example, if your p99 response time is 1.5 seconds, then the percentRank fraction of response times below 1.5 seconds is 0.99 (or 99%). percentRank is particularly useful if you have response time SLOs.
For details, see the DQL commands timeseries and maketimeseries.
Platform | Dynatrace Intelligence
Problems app: New Affected entities column
 Problems now includes an Affected entities column in the problem table, visible by default. Entity names are displayed with direct links, so you can identify impacted services, apps, or synthetic tests and navigate to them. Selecting an entity opens contextual actions such as View service and Open with.
Platform | Dynatrace Intelligence
Problem comments for collaborative remediation
You can now add comments directly to problems to better support coordination during incident remediation.
With this update, you can:
- Add comments to problems: Users with viewer rights can attach text comments to existing problems to share context, updates, or remediation notes.
- Use markdown formatting: Write comments with simple markdown, including bold text and inline links, for clear and structured communication.
- Review the comment feed: View a chronological feed of all comments on a problem for full incident context.
- Query comments via DQL: Use DQL and Grail to filter problems by comments or retrieve comments for specific problems.
- Integrate with automated processes: Deployment pipelines and other automated systems can programmatically attach annotation events to problems using the
CUSTOM_ANNOTATIONevent type, reliably linking post-mortem information to the incident.
Platform | Notebooks
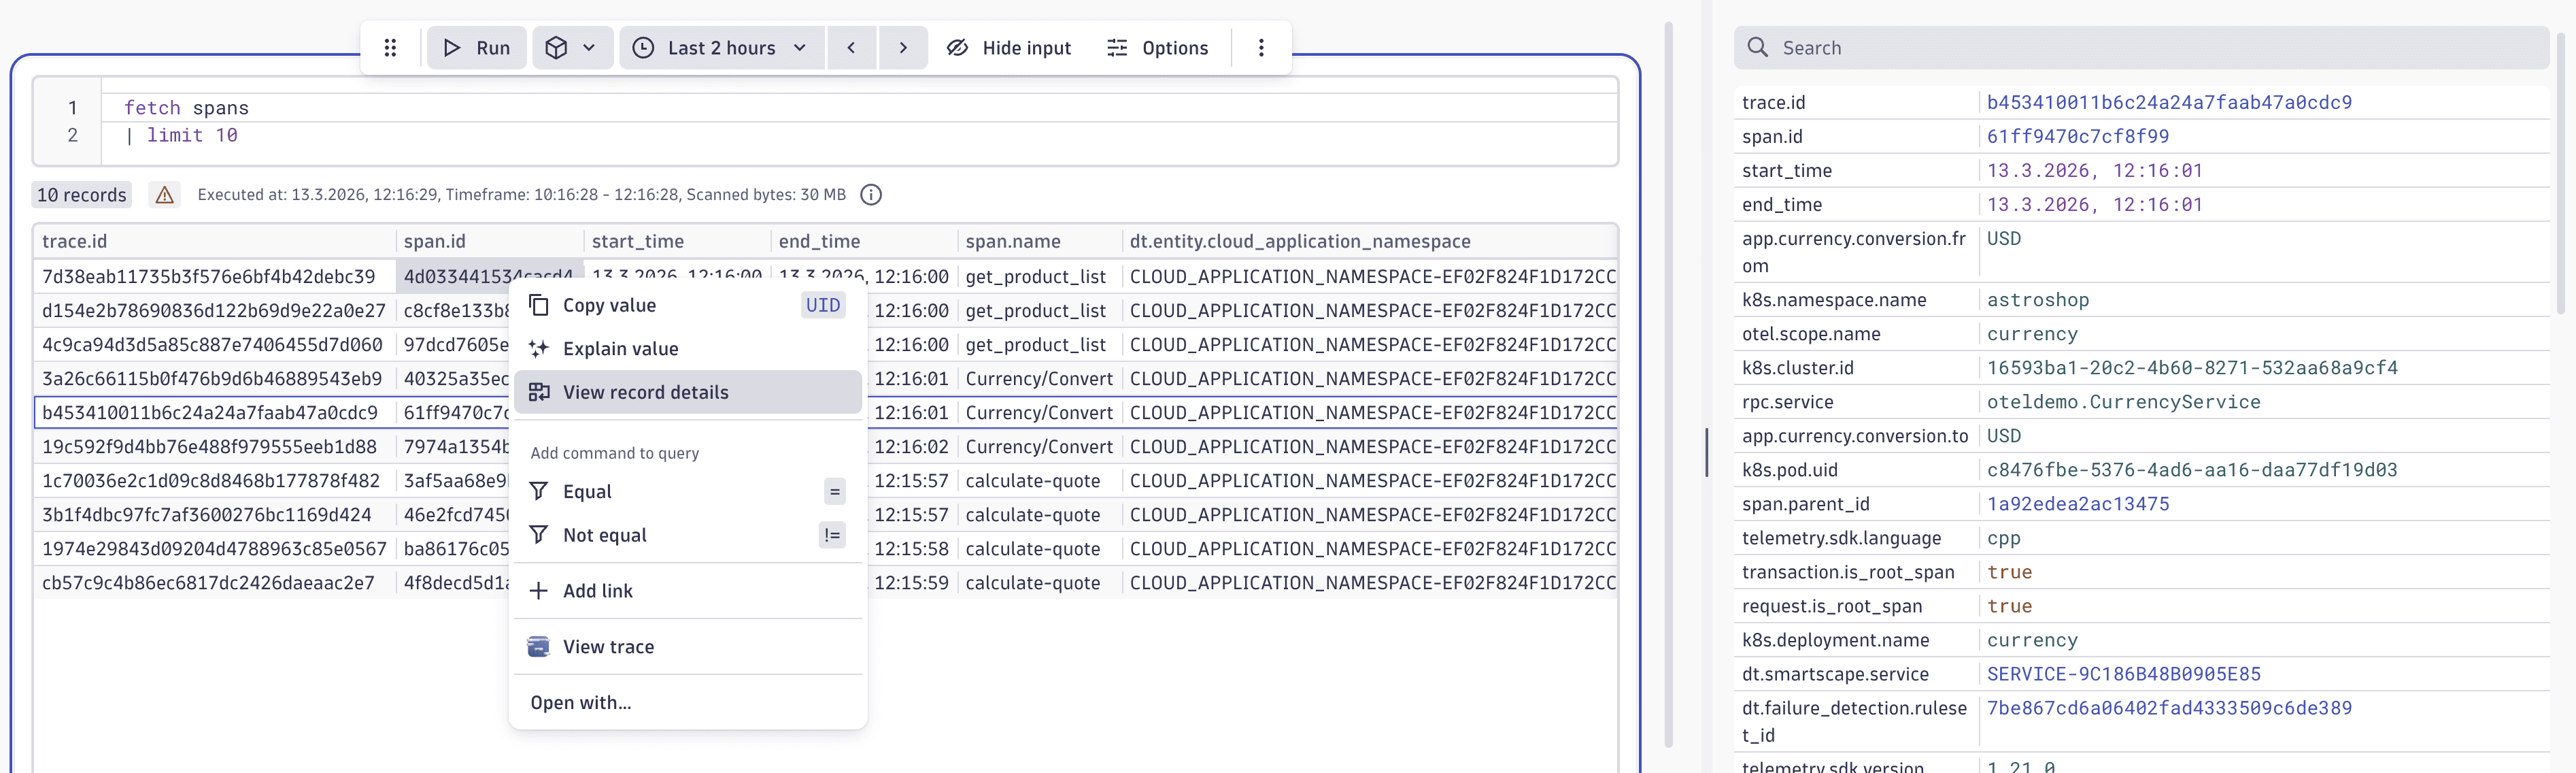
Explore records in detail with the new record details panel for Notebooks and Dashboards
In a Dashboards or Notebooks table visualization, you can now right-click any row to select View record details. This displays the selected record, rotated 90 degrees, in a side panel, for a much better overview of records with many fields.
- As you navigate rows in the table using your keyboard or mouse, the side panel updates automatically, making it easier to browse through your data.
- The record details panel also includes a Search bar to quickly filter fields, and supports the same right-click interactions available from the table.
Platform | Notebooks
Keep important columns in view with pinned columns in tables
In Dashboards and Notebooks table visualizations, you can now pin columns to keep them visible while scrolling horizontally.
- To pin a column to the left or right of a table, right-click the column header and select Pin left or Pin right.
- To unpin a column, right-click the column header and select Unpin.
This can be especially useful when working with larger result sets containing many fields.
As part of this change, drag-and-drop column reordering has been removed, but you can still reorder columns using the Visibility and order options.
Platform | Settings
Metrics catalog in Settings
![]() Settings now includes a metrics catalog, giving administrators a central place to browse and manage all metrics in their environment - both built-in and custom. Use the catalog to search and sort across your full metrics inventory, and inspect key metadata including metric key, kind, display name, description, and unit. Where needed, you can edit display name, description, and unit directly to keep your metrics organized and meaningful across teams.
Settings now includes a metrics catalog, giving administrators a central place to browse and manage all metrics in their environment - both built-in and custom. Use the catalog to search and sort across your full metrics inventory, and inspect key metadata including metric key, kind, display name, description, and unit. Where needed, you can edit display name, description, and unit directly to keep your metrics organized and meaningful across teams.
Breaking changes
Application Observability
SemDict-compliant attributes now replace undocumented ones in the service_mesh namespace
Service mesh spans were previously marked with undocumented attributes in the service_mesh.* namespace. We updated them to use the new documented transaction.service_mesh.* semantics. This could affect custom DQL queries and pipeline configurations.
Platform | DQL
Smartscape IDs are no longer directly comparable with strings in DQL
To compare a Smartscape ID with a string, especially a string literal, convert the string to a proper Smartscape ID, for example:
fetch logs| filter dt.smartscape.host == toSmartscapeId("HOST-0000000000000001")
This change affects the DQL comparison operators (==, !=, <, <=, >, >=), the in operator, and the in() function, as well as join conditions (join, joinNested, lookup).
Platform | OpenPipeline
OpenPipeline legacy config API sunsets on June 29, 2026
The legacy configuration API for OpenPipeline (see GET a configuration) was deprecated in November 2025 (with Dynatrace version 1.327) and replaced with a configuration based on the Settings API. This immediately delivered fine-grained permissions, and since then, we have added new features to OpenPipeline that can only be configured via the new Settings API.
- If you’re using only the UI, this is a non-breaking change, with slight differences in the permissions model.
- If you’re using the API or Config-as-code, Dynatrace converts the configuration, which you can then download and merge into the repository. See the detailed migration guide at Migrate OpenPipeline configurations to Settings API. You can trigger the migration from the OpenPipeline config UI in
 Settings.
On June 29, 2026, we will deactivate the legacy API and migrate all tenants that were not previously migrated to the new Settings-based configuration API.
Fixes and maintenance
Resolved issues in this release (SaaS)
- Improved how Data Explorer handles bad requests to provide more useful feedback when queries return a result set that’s too large or when a user executes too many requests. (MGD-9727)
- Fixed an issue where anomaly detectors with schema version 1.0.12 or earlier could not be saved when the
actorfield was not explicitly set. (DI-27005) - Fixed generic entity extraction (using
dt.davis.is_entity_remapping_allowedanddt.davis.preferred_entity_type) for Davis events extracted in OpenPipeline. If an entity can be extracted based on a generic type setting and the given event properties from the pipeline config, the entity will be used as the source entity for the event. (DI-26181) - Prioritized the description provided by OneAgent for
OSI_NIC_UTILIZATION_HIGHevent types. (DI-26086) - Added
dynatrace.com/split-mountsannotation to the synthetic pod template. This annotation was introduced in Dynatrace Operator 1.8.0 to avoid conflicts with application images that already contain a/var/lib/dynatracedirectory, enabling correct injection into ActiveGate pods. Adding this annotation to synthetic deployments aligns the synthetic pod template with the Operator's default behavior for ActiveGate-managed pods. (DEM-22172) - Added missing support for
OPEN_PIPELINEassets in Extensions. (DAQ-23064, DAQ-22679)
 - Fixed an issue where the
dt.source_entityandloglevelattributes were being overwritten by Azure log processing rules. These attributes now retain their original values if set by the source. (APPOBS-33744) - Fixed an issue that prevented the name lookup for very new CWEs. (SIA-19047)
- Smartscape entity IDs for entity relations between namespaced and non-namespaced Kubernetes entities are now correctly calculated. (INFOBS-7885)
- Added an alternative Azure monitoring landing page with a simplified subscription list for environments where the default Azure view loads too slowly. (INFOBS-7830)
- Fixed the datatype for
dt.davis.affected_users_count,which was previouslydoubleand is nowlong. (DI-26260) - Extended extension assets logging on import errors. (DAQ-20952)