What's new in Dynatrace SaaS version 1.333
- Release notes
- 5-min read
- Rollout start on Feb 24, 2026
This page showcases new features, changes, and bug fixes in Dynatrace SaaS version 1.333. It contains:
Feature updates
Application Observability | Services
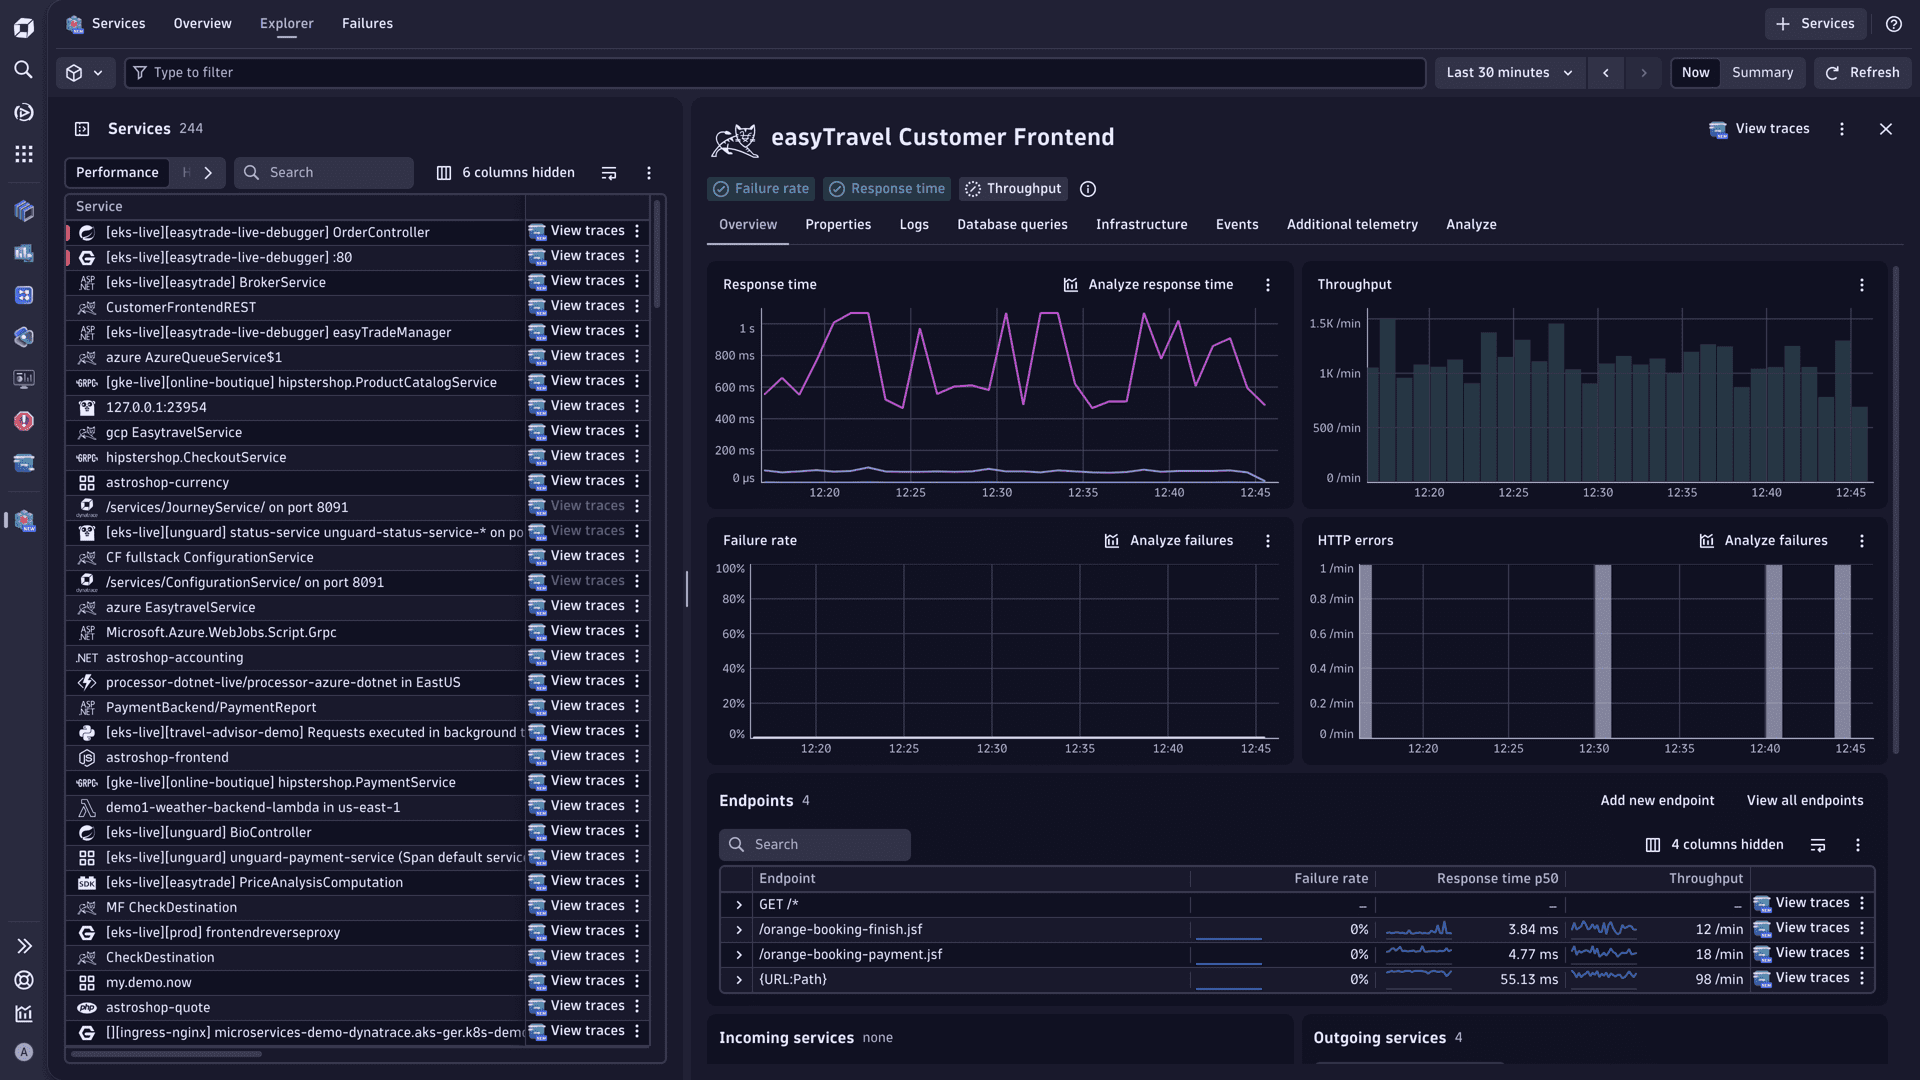
Enhanced endpoints for Service Detection v1
Enhanced endpoints for SDv1 gives every detected endpoint on SDv1 services its own metrics (response time, throughput, failure count)—the same dt.service.request.* metrics already produced by SDv2 and OpenTelemetry services. These metrics are available in  Dashboards,
  Notebooks, SLOs, and alerting. No key request configuration is needed. See Enable endpoint-level metrics for SDv1 services for more details.
- For environments created in Dynatrace version 1.329 and earlier, you need to manually turn on this setting, and we highly recommend doing so.
- For environments created in Dynatrace version 1.330+, this feature is turned on by default. For environments created in Dynatrace version 1.333+, the feature can't be turned off.
Digital Experience | Synthetic
Added support for primary Grail tags and browser monitor execution analysis page in  Synthetic
Synthetic version 1.10.0 introduces the browser monitor execution analysis page, which can help you detect and isolate specific resources in specific executions that compromise overall performance. Additionally, primary Grail tags are now supported in synthetic monitor configurations.
Digital Experience | Synthetic
Changed permissions in the Kubernetes template for the Synthetic Monitoring metric adapter
The Kubernetes template for the Synthetic Monitoring metric adapter has been updated to set the Cluster Role metric permissions to read-only.
Digital Experience | Synthetic
Monitor list redesigned in Synthetic
Synthetic version 1.9.3 introduces a redesigned monitor list with health alerts, more powerful filtering, and support for segments.
Infrastructure Observability
Show Kubernetes Monitoring ActiveGate health state in ") Kubernetes version 1.39.0
Kubernetes version 1.39.0
Starting with Kubernetes version 1.39.0, a monitoring issue alert is now displayed when an ActiveGate that is monitoring a Kubernetes cluster struggles with CPU or memory. On the recommendation page for monitoring issues, Kubernetes clusters with unhealthy ActiveGates are listed. Select one with health information to see recommended actions.
Infrastructure Observability | Clouds
View Smartscape from  Clouds
In Clouds, you can now select >  View topology from all entity pages to open Smartscape for the selected entity.
Infrastructure Observability | Infrastructure & Operations
View Smartscape from  Infrastructure & Operations
In Infrastructure & Operations, you can now select > View topology from the host, process, and container pages to open Smartscape for the selected entity.
Infrastructure Observability | Kubernetes
View Smartscape from Kubernetes
In Kubernetes, you can now select > View topology from all entity pages to open Smartscape for the selected entity.
Infrastructure Observability | Kubernetes
Kubernetes deployment page - DynaKube version update
- The Kubernetes deployment page generates a YAML file for the latest DynaKube version
v1beta6(Dynatrace Operator version 1.8). - Resource requests and limits for ActiveGate Kubernetes monitoring are now set according to the sizing guide.
Infrastructure Observability | Kubernetes
Dynatrace Classic: Helm version is now selectable on Monitor Kubernetes / OpenShift page
In Dynatrace Classic, on the Monitor Kubernetes / OpenShift deployment page, you can now choose between Helm v3 or Helm v4 for the command.
Platform
Alerting events inherit security context from their source entity
We now propagate the dt.security_context attribute from an event’s dt.source_entity onto the alerting events. This enables administrators to reliably define IAM policy rules that use dt.security_context to control alert and problem visibility at the record level (for example, policies such as ALLOW storage:logs:read WHERE storage:dt.security_context = "TeamA"), improving access boundaries based on security context.
Platform | Dynatrace Intelligence
Problems created by custom alerts ( Anomaly Detection) don't merge with existing problems by default
Problems created by custom alerts ( Anomaly Detection) don't merge with existing problems by default when event.type is set to CUSTOM_ALERT. This behavior can be changed with the flag dt.davis.is_merging_allowed (see the Semantic Dictionary). Other event types are not affected by this change.
Platform | OpenPipeline
Pipeline groups are now in general availability
Pipeline groups are a powerful, flexible control layer in OpenPipeline that allow central platform/SRE teams to manage ingest configuration for multiple pipelines at once. They group pipelines into disjoint sets and let you enforce global policies (such as cost allocation, security context, and sensitive data scanning) while delegating service- or app-specific configuration—such as parsing and extraction—to individual teams.
This gives you a single control point for critical ingest logic and permissions, without turning every change into a central bottleneck.
We're releasing pipeline groups as an API-first version. To leverage this feature, see Get started on OpenPipeline pipeline groups for an API-based workflow to manage pipeline groups, and follow the related discussions in Dynatrace Community.
Some examples of where pipeline groups change your game for ingest configuration and collaboration with teams:
Security context and bucket enforcement
Create a “Production logs” group that forces all its member pipelines to assign a specific security context and bucket while at the same time disallows teams to apply any changes in their Permission and Storage stages.
Teams can still fine-tune parsing and processing overall, as well as extraction, but can't accidentally overwrite record-based access or send data to the wrong Grail bucket.
Cost allocation
Create groups per business unit (for example, “BU Marketing”, “BU Retail”) that include handling of cost center and product assignments. Any new pipeline that teams create becomes a member of one of these groups and inherits the already defined cost allocation.
Software Delivery | Site Reliability Guardian
Add contextual links to  Site Reliability Guardian objectives for analyzing failed validations
To simplify the analysis of failed Site Reliability Guardian validations, you can add up to five links to the objective definition. These links are added to the validation results and to the workflow results (if the Site Reliability Guardian validation was started in a workflow), and they're stored in Grail alongside the generic Site Reliability Guardian validation, so they can be queried via DQL.
This functionality allows developers who want to review failed objectives to get more information about the objective's intended purpose and provides guidance on what to do and how to fix a failed validation. This removes the need for manual investigations and shortens the time to respond correctly to a failed objective validation.
Breaking changes
Account Management | Cost Management
Switch to the new notifications endpoint
To receive a unified feed of available notifications (budget, forecast, cost, and BYOK, where supported), switch to the new NotificationsController_listNotifications notifications endpoint. The new endpoint is sourced from Lima Notifications and may return additional notification types and minor schema metadata differences.
The SubscriptionsController_getEvents is deprecated starting with Dynatrace version 1.333. It will continue to work until the announced sunset date, but it will not return the additional notification types available via the new endpoint.
Timing:
- Release of new
NotificationsController_listNotificationsendpoint: Dynatrace version 1.333 - Deprecation headers are planned to go live on February 23, 2026. Responses will include
deprecation: trueandsunset: 2026-04-06. - Sunset date of
SubscriptionsController_getEventsendpoint: April 6, 2026.
Links:
Digital Experience | Synthetic
Reverted changes to metrics dt.synthetic.browser.duration and dt.synthetic.browser.step.duration
Summary
In Dynatrace version 1.333, we have reverted the previous changes to the following metrics:
dt.synthetic.browser.durationdt.synthetic.browser.step.duration
Details
These metrics will now be calculated using the same algorithm that is used to report:
dt.synthetic.browser.classic.total_durationdt.synthetic.browser.step.classic.total_duration
Whether the new Browser Monitors experience is enabled or disabled (ON or OFF) does not affect the reported metric values.
Impact
You should no longer observe significantly shortened durations (metrics keys: dt.synthetic.browser.duration, dt.synthetic.browser.step.duration) for browser monitors (compared to values reported before rolling out Dynatrace version 1.330). However, that means that duration values reported with Dynatrace version 1.333 will, for some monitors, be significantly higher than those reported with Dynatrace version 1.332.
This change preserves data continuity and removes the need to adjust custom dashboards, alerts, or SLOs.
Unchanged metrics
Other synthetic metrics introduced or modified in Dynatrace version 1.330 remain unchanged and continue to be reported as before:
dt.synthetic.browser.user_events.durationdt.synthetic.browser.step.user_events.durationdt.synthetic.browser.user_events.total_durationdt.synthetic.browser.step.user_events.total_durationdt.synthetic.browser.classic.total_durationdt.synthetic.browser.step.classic.total_duration
Infrastructure Observability | Databases
New bucket for the database extension-retrieved logs
Starting with this release, all monitoring logs from database extensions (used by some database app functionalities) are now stored in the default_database_monitoring bucket instead of the default_log bucket.
The existing default policies have been updated accordingly. However, if you created any custom database-related policies or granted specific permissions to your DB app users, you must update those permissions to include read access to the default_database_monitoring bucket.
Fixes and maintenance
Resolved issues in this release (SaaS)
- Fixed problem with Smartscape
CONTAINERruns_on[HOST,K8S_NODE] edge when running Kubernetes monitoring in combination with Full Stack. (INFOBS-7307) - Fixed an edge case where an event start (start of analysis window) is not contained within a maintenance window schedule, but the analysis window end is contained within a maintenance window schedule. This mainly affected anomaly detection events (at the service- or app-level), but also custom anomaly detectors (metric events). (DI-25641)
- Fixed a bug where view information was incorrect on navigation events if combined with user action events. (DEM-21487)
- Fixed an issue where reopening the global timeframe selector caused timezone row duplication. (MGD-9441)
- Fixed an issue resulting in the wrong timeframe being returned when querying a metric expression with more than one metric operand in combination with a default operator with the “always” option and a rollup operator when there is no data for the metric expression. (MGD-9093)
- The use of
dt.event.correlation_tagis no longer allowed for custom alerts ( Anomaly Detection). If you have the field set, please remove it from the event template. (DI-25411) - Metric dimension writing now considers both HTTP and gRPC if available at the same time (previously, only one of them was considered). (APPOBS-31249)