What's new in Dynatrace SaaS version 1.325
- Release notes
- 4-min read
- Rollout start on Oct 07, 2025
This page showcases new features, changes, and bug fixes in Dynatrace SaaS version 1.325. It contains:
Feature updates
Application Observability | Log Analytics
Log query usage and costs ready-made dashboard highlights use case adoption
The Log query usage and costs ready-made dashboard now makes it easier for users to understand and explore how logs are used across Dynatrace.
- Three key use cases are now highlighted: Log Analytics, Logs in Context, and Logs on Dashboards
- Descriptions have been updated to better explain the value of each use case
- Statistical insights are based on the last 4 weeks of usage data
Application Security
Enhanced filtering in Security Posture Management
Two new features are available in  Security Posture Management:
-
An Assessment view filter is now available on the Assessment results page.
- Select Recommended to display only rules with Failed, Manual, and Passed results.
- Select Complete results to display all the rules assessed in the context of selected systems.
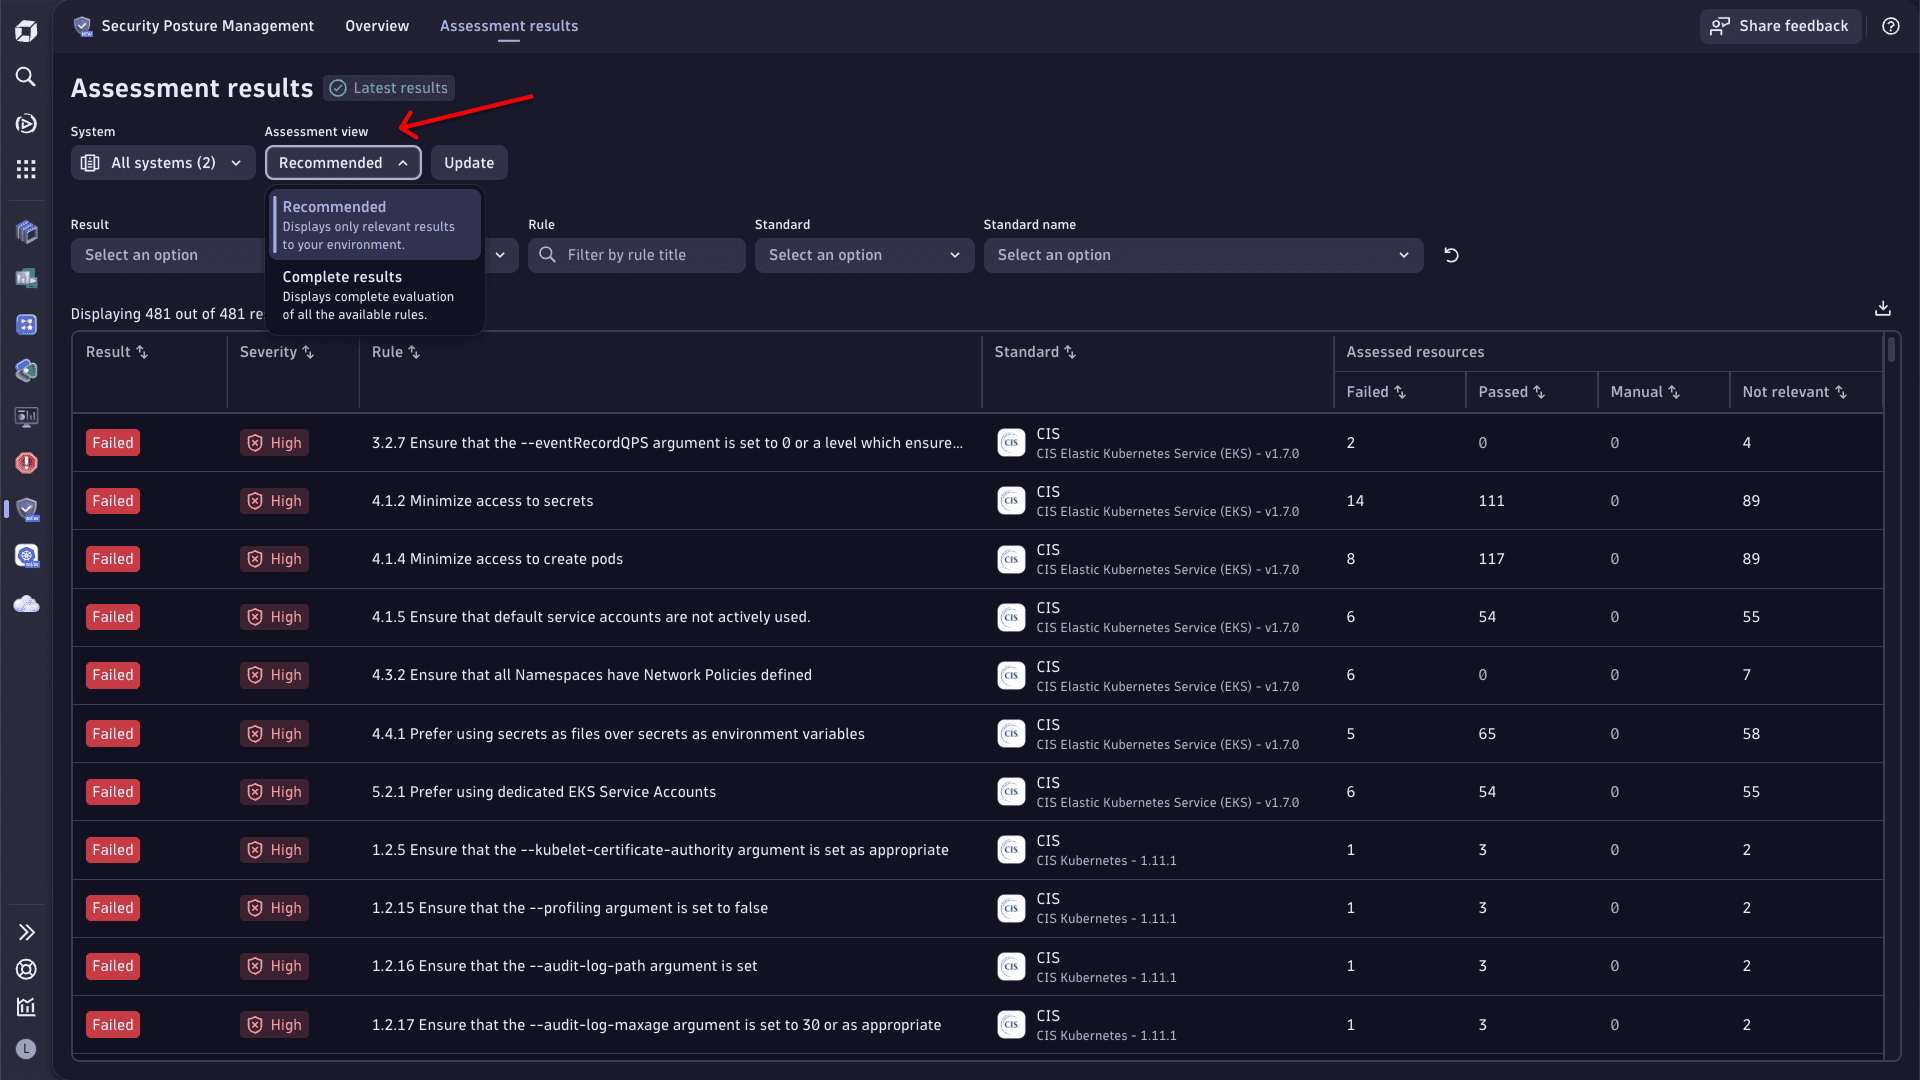 SPM example: Assessment view
 -
The Assessment results table now contains the full name of the compliance standard. This allows you to filter by it and focus on the specific standard.
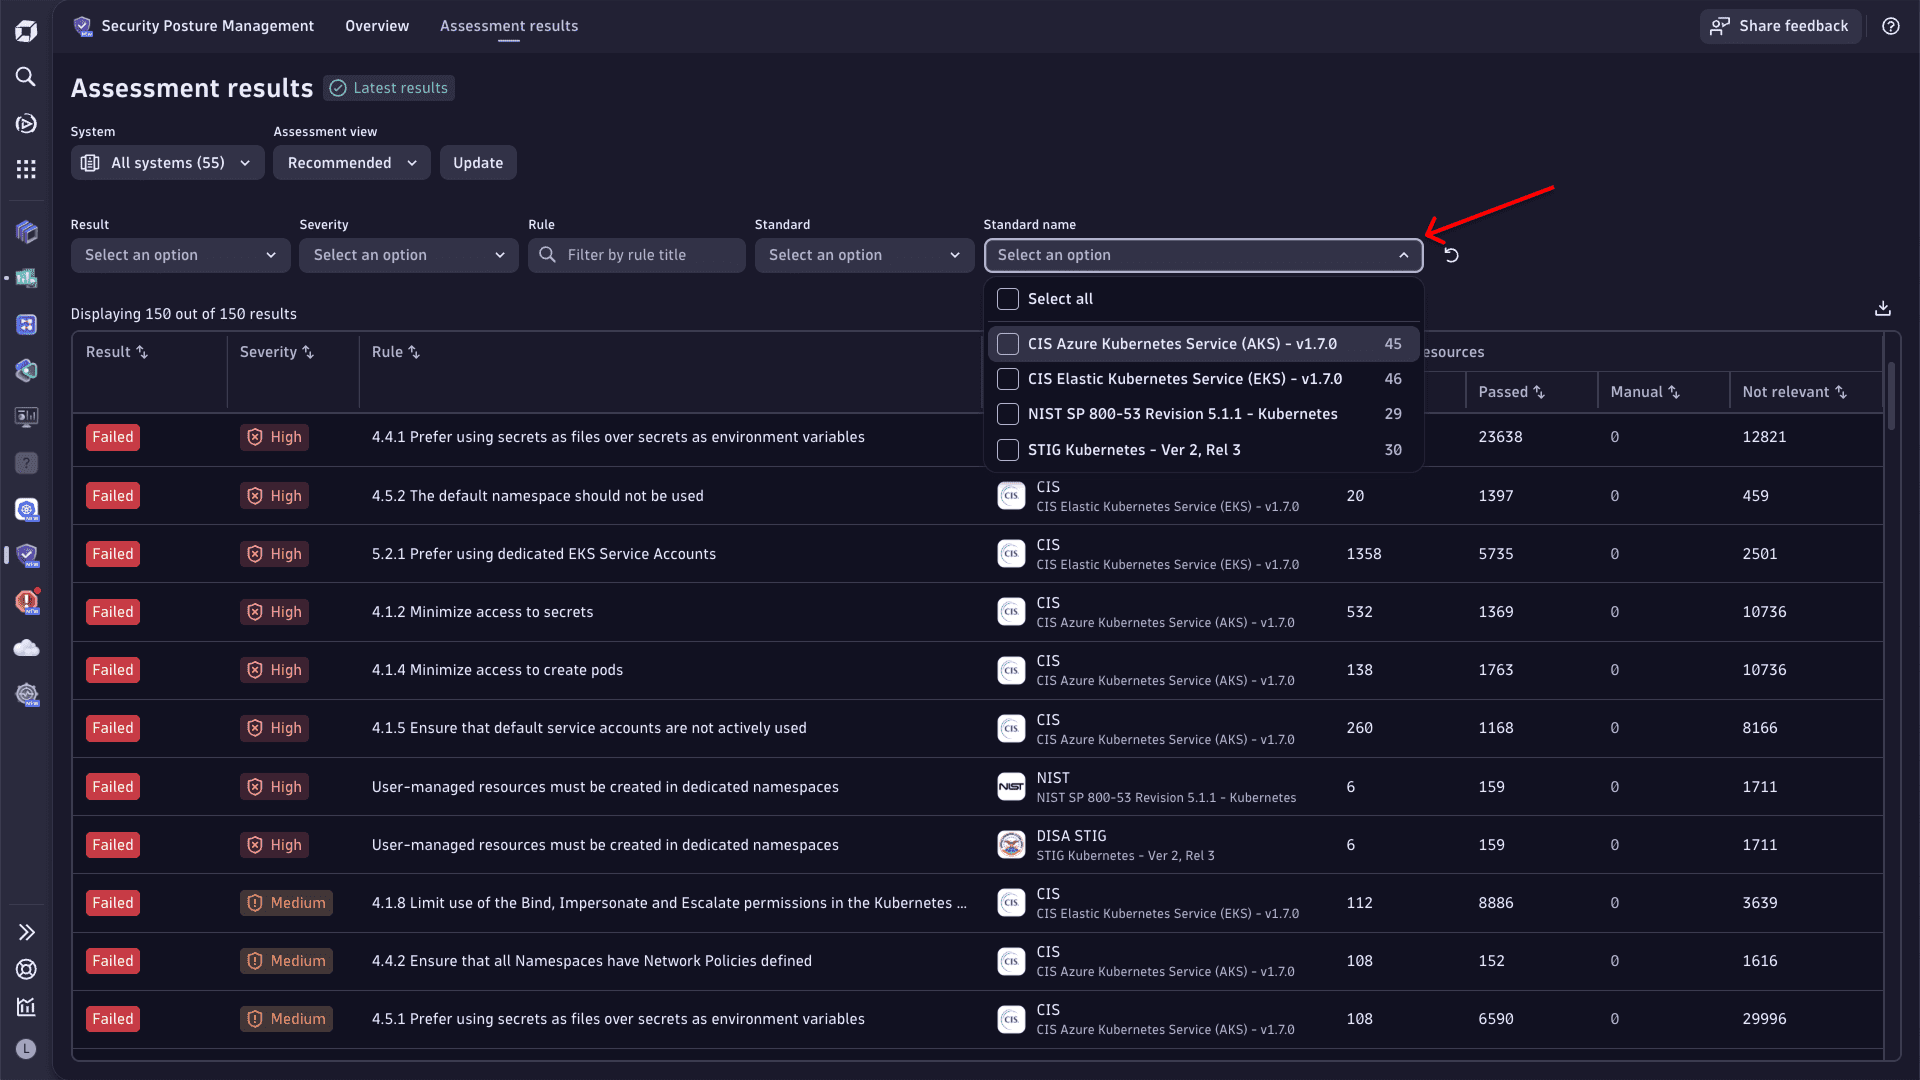 SPM example: Assessment results
Application Security | Vulnerabilities
Expanded event coverage for third-party libraries
Dynatrace is introducing support for two types of security events related to third-party libraries: vulnerability finding events and vulnerability scan events. These events are stored in the security.events table:
VULNERABILITY_FINDING: Represents a single vulnerability identified in a specific process at a given time. For details, see Semantic Dictionary.VULNERABILITY_SCAN: Represents the analysis of detected packages within a specific process at a given time. For details, see Semantic Dictionary.
Prerequisite: Enable third-party vulnerability detection.
Support for these event types is being rolled out gradually across SaaS environments. Not all tenants will have access immediately following the release.
Example DQL query to retrieve vulnerability finding and scan events:dqlfetch security.events| filter in(event.type, array("VULNERABILITY_SCAN", "VULNERABILITY_FINDING"))| filter object.mapping.resource.type == "process"
Infrastructure Observability | Discovery & Coverage
Expanded network coverage onboarding
In  Discovery & Coverage, on the Network coverage page, the Configure scanning button has been replaced by a Configure menu with five options to provide complete network coverage:
- SNMP Autodiscovery - enables automatic discovery of your network devices, including their type and topology.
- Network platforms - enables easy onboarding of thousands of devices via a single connection to a network platforms like Cisco Catalyst Center, ACI, or Meraki.
- SNMP traps - enables an SNMP trap receiver on ActiveGates.
- Syslog - enables a Syslog server on ActiveGates.
- Netflow - enables Netflow ingestion on Dynatrace Collector.
Platform
Scale data ingestion confidently with the expanded capacity of OpenPipeline
OpenPipeline now supports ingesting up to 1 petabyte (PB) of data per day across all signal types, including spans, metrics, logs, and events.
This enhancement ensures that even the most data-intensive environments can rely on OpenPipeline for scalable, high-throughput ingestion and processing. It’s especially beneficial for customers operating large-scale observability pipelines.
Benefits of large-scale ingestion capacity
-
Enterprise-grade ingestion and processing flexibility
The OpenPipeline architecture is built for an enterprise-grade scale. It rapidly routes records to the correct pipelines and determines applicable processors, adapting dynamically to your workload demands. This ensures consistent performance even under massive data loads, helping teams avoid bottlenecks and latency regressions.
-
Self-service configuration with admin control
OpenPipeline empowers teams with self-service configuration to manage their own use cases, including custom alert settings and metric extraction. At the same time, fine-grained admin controls allow central teams to delegate rights and assign buckets, maintaining governance and compliance.
This dual model of flexibility and control allows scalable collaboration across teams, while preserving operational integrity.
Platform | Dashboards and Notebooks
Faster loading of Dashboards and Notebooks
In  Dashboards and
  Notebooks, if a query result contains more than 50 table columns, only the first 50 columns are shown by default, and a message is displayed to let you know about it. To change this setting, select the Modify visibility link in the message.
Platform | Dashboards and Notebooks
Improved Add menu experience for Dashboards and Notebooks
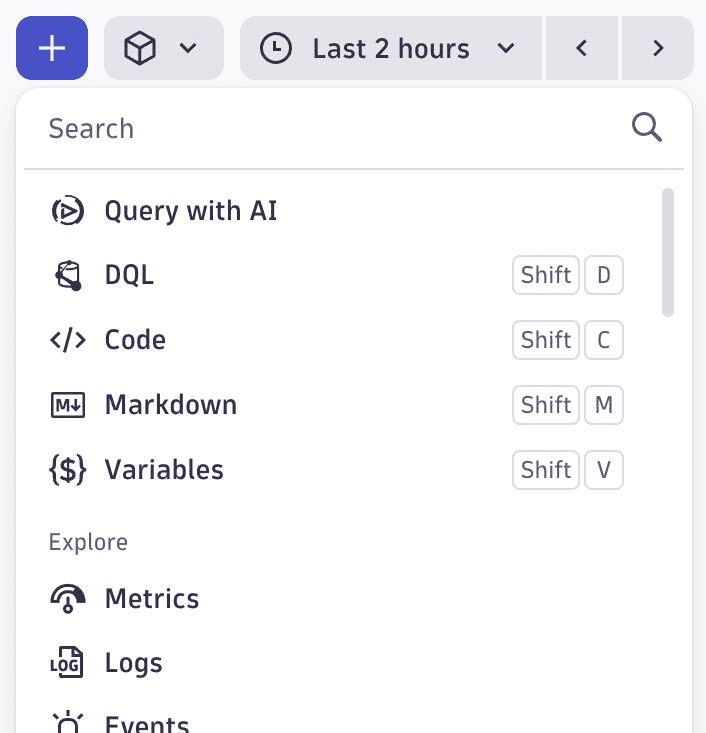
The Add menu in Dashboards and Notebooks is now restructured to always have these core types at the top:
- Query with AI
- DQL
- Code,
- Markdown
- Variables (for Dashboards)
They're followed by the various ways to explore your data and a snippet library.
Platform | Dashboards and Notebooks
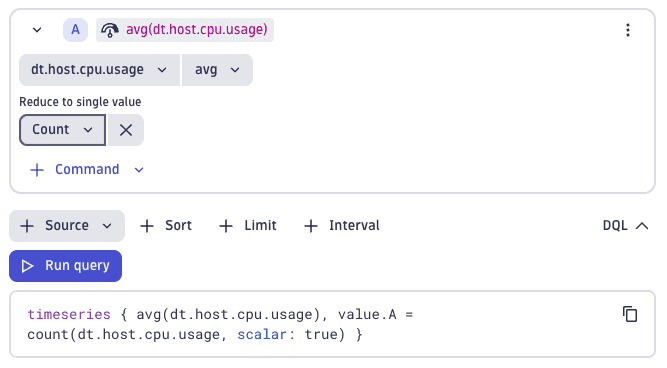
New count aggregation option in Explore metrics when reducing to a single value
The count aggregation function can now be used in Dashboards and Notebooks when adding a Reduce to single value command in an explore metric tile.
Platform | Davis
Davis events enriched with host group ID for service baselining
Davis events in Grail for service baselining now consistently include the dt.host_group.id attribute for improved event context and filtering capabilities.
Platform | Davis
New eventType WARNING for events
You can add a WARNING eventType when ingesting events. It behaves similarly to the CUSTOM_INFO type.
- Warning events are shown like info events in the root cause of problems.
- Warning-level Davis Events never trigger a problem or root-cause analysis.
Platform | Davis
Updated Davis event records
Davis event records in Grail now contain Synthetic in the dt.davis.impact_level field if the dt.source_entity of the event is a synthetic monitoring entity.
Platform | Grail
New permission operator MATCH
You can now use the MATCH operator to simplify your permission statements requiring wildcards. With this new operator, you can write statements like:
ALLOW storage:logs:read WHERE storage:dt.security_context MATCH ("crn-70100-*", "*-tech-*");
For details, see Permissions in Grail.
Software Delivery
SDLC event extraction from logs
OpenPipeline now supports the extraction of SDLC events for logs.
You can now automatically extract SDLC events from pipeline logs in tools like Jenkins, GitHub, and ArgoCD. This allows out-of-the-box pipeline observability by capturing metadata such as application name, pipeline run details, and version, supporting CI/CD analytics, and root cause analysis enriched with lifecycle metadata.
Software Delivery | Ecosystem
Access-controlled AWS schema in AWS Connector for Workflows
AWS Connector for Workflows now supports ACL on AWS connections. It allows you to configure and share AWS connections with fine granularity so that only specific users, groups, or service users can access them.
A second schema has been introduced to enhance security for AWS connections, and the existing one will be deprecated within the next six months.
For details, see AWS Connector.
Fixes and maintenance
Resolved issues in this release
- Resolved an issue with referential integrity checks between settings that prevented saving of settings changes if the settings value contained unchanged secrets as well as a reference to another setting. (PS-36658)
- The Failover buffer fillrate gauge metric has been renamed to ensure it has a unique identifier. (PPX-6874)
- Resolved an issue where a link on the OneAgent deployment status page was not functioning correctly. (DI-22719)
- Fixed an error in the classic problem list UI. When attempting to close multiple problems at the same time with a close message that is blank, for example, whitespaces only, the problems are not closed and an internal server error message is returned in the UI. (DI-22702)
Dynatrace API
To learn about changes to the Dynatrace API in this release, see Dynatrace API changelog version 1.325.