Ingest NetFlow with the OTel Collector
- Latest Dynatrace
- How-to guide
- 1-min read
The following configuration example shows how to configure a Collector instance to accept NetFlow packets and ingest them as OTLP requests into Dynatrace.
Prerequisites
- One of the following Collector distributions with the NetFlow receiver:
- The Dynatrace API endpoint URL to which the data should be exported.
- An API token with the Ingest logs (
logs.ingest) scope. - A NetFlow- or sFlow-capable device that can send NetFlow packets to the OTel Collector instance.
See Collector Deployment and Collector Configuration on how to set up your Collector with the configuration below.
Collector configuration
receivers:netflow:hostname: "0.0.0.0"scheme: netflowport: 2055sockets: 2workers: 4exporters:otlp_http:endpoint: ${env:DT_ENDPOINT}headers:Authorization: "Api-Token ${env:DT_API_TOKEN}"sending_queue:batch:# Use default batching settings for logs.min_size: 1800max_size: 2000flush_timeout: 60sservice:pipelines:logs:receivers: [netflow]processors: [batch]exporters: [otlp_http]
Check the NetFlow receiver documentation for the available configuration options.
We recommend setting the sockets parameter to match the number of CPU cores available on the Collector instance, and the workers parameter to twice the number of sockets. This configuration allows the Collector to process multiple incoming NetFlow packets concurrently, which improves performance.
For extremely large volumes of data, you should parallelize the configuration among multiple Collector instances.
Validate your settings to avoid any configuration issues.
Components
For our configuration, we configure the following components.
Receivers
Under receivers, we specify the netflow receiver as the active receiver component for our Collector instance and configure it to listen on specified ports.
Processors
Under processors, we specify the batch processor, which batches the incoming NetFlow packets before sending them to Dynatrace. This is useful for optimizing performance and reducing the number of requests sent.
Exporters
Under exporters, we specify the default otlp_http exporter and configure it with our Dynatrace API URL and the required authentication token.
For this purpose, we set the following two environment variables and reference them in the configuration values for endpoint and Authorization.
DT_ENDPOINTcontains the base URL of the Dynatrace API endpoint (for example,https://{your-environment-id}.live.dynatrace.com/api/v2/otlp)DT_API_TOKENcontains the API token
Service pipelines
Under service, we assemble our receiver and exporter objects into a logs pipeline, which will listen on the configured address for incoming NetFlow packets and forward them to Dynatrace using the exporter.
Data visualization
The logs records will be available in Dynatrace with fields documented in the receiver documentation.
Example DQL queries
-
Fetch all NetFlow logs and summarize the bytes and packets by source and destination addresses:
fetch logs| filter otel.scope.name == "otelcol/netflowreceiver"| summarize {bytes=sum(toDouble(flow.io.bytes)), packets=sum(toDouble(flow.io.packets))}, by: {source = source.address, destination = destination.address}| fieldsAdd bytes_relative=bytes| fieldsAdd packets_relative=packets| sort bytes desc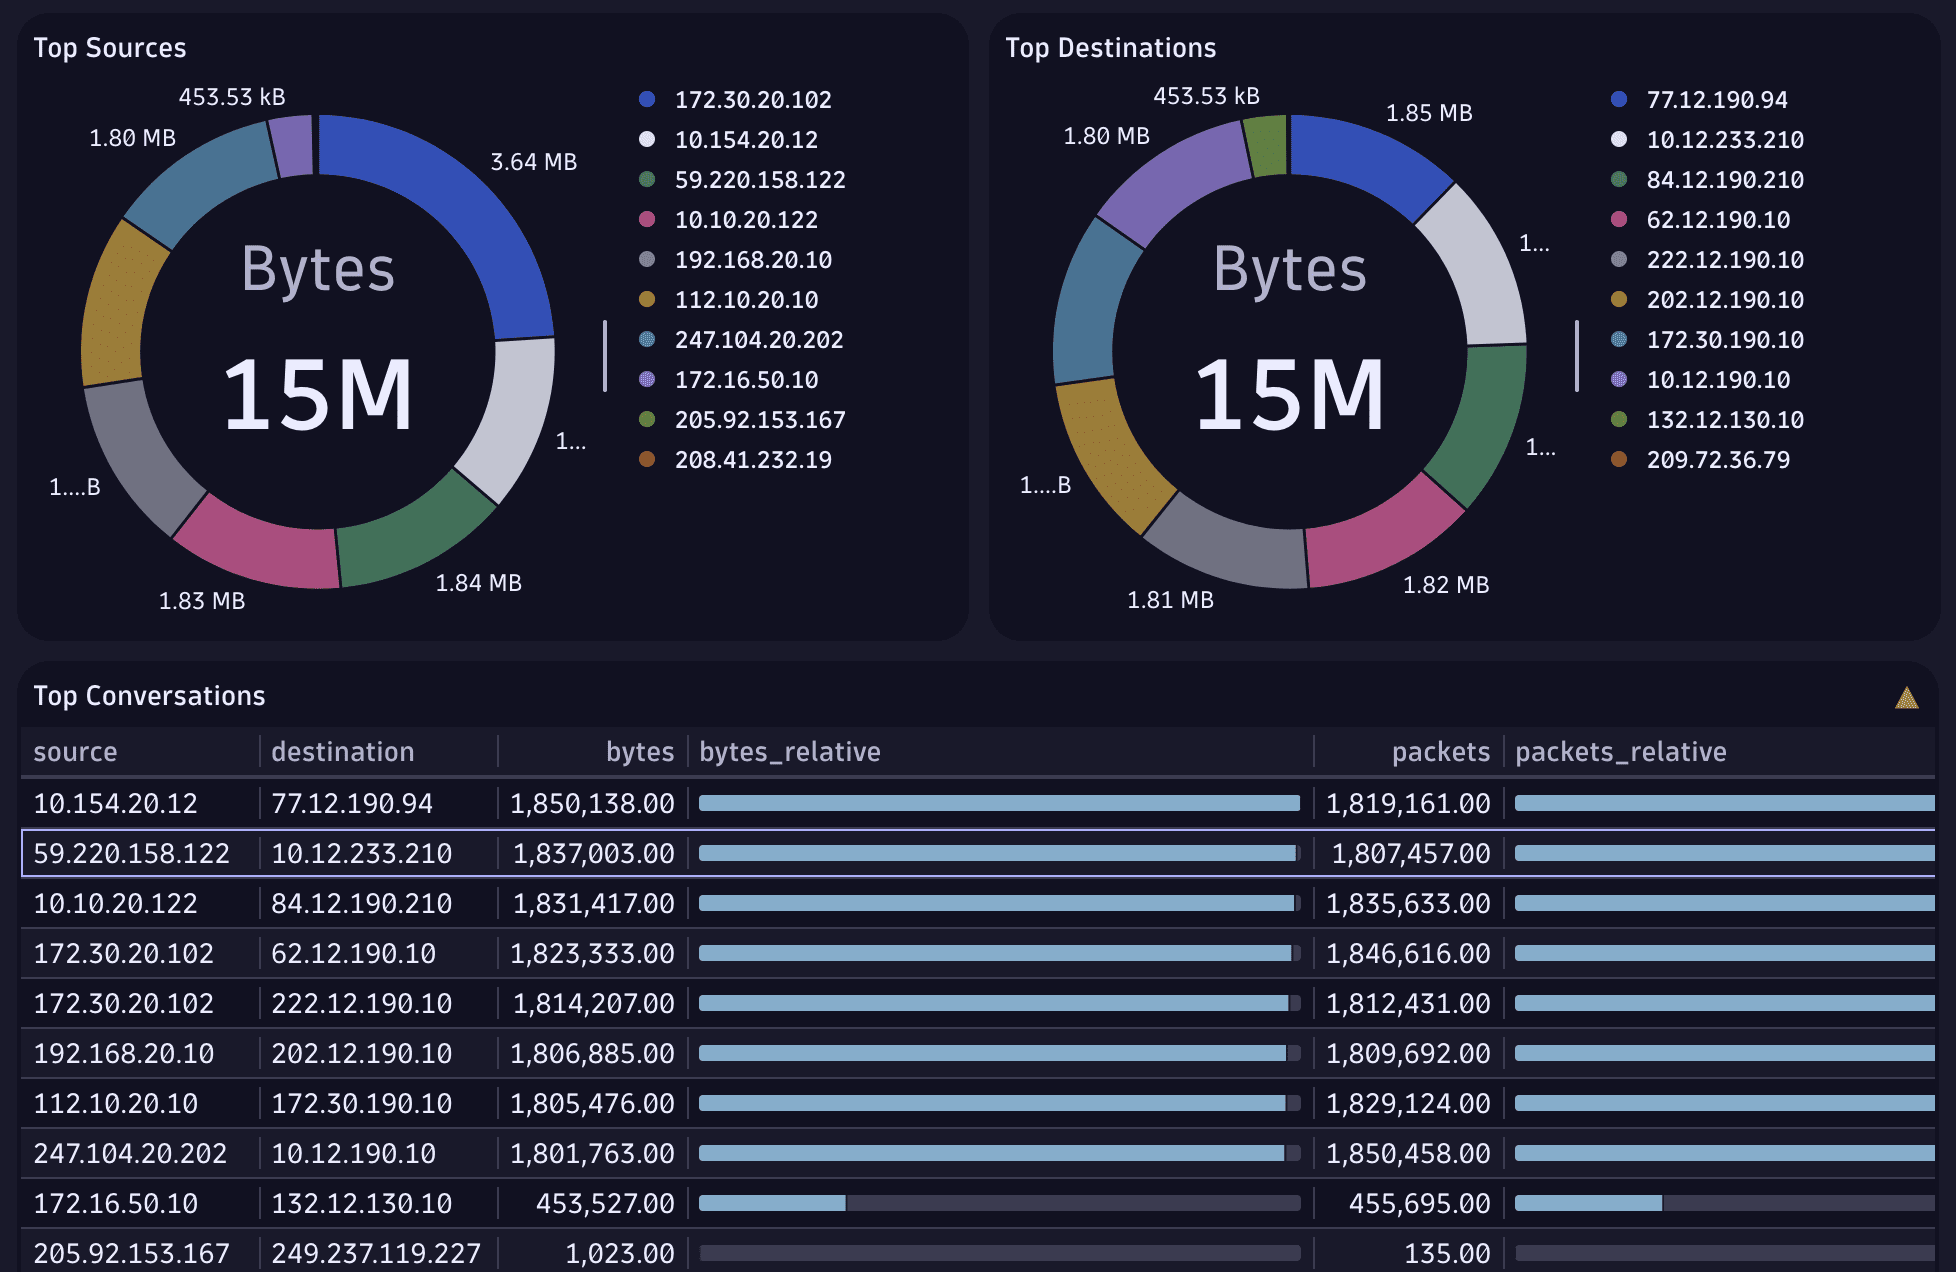 Sample NetFlow charts showing top sources, destination and conversations
 -
Fetch the most used ports:
fetch logs| filter otel.scope.name == "otelcol/netflowreceiver"| summarize {bytes=sum(toDouble(flow.io.bytes))}, by: {port = destination.port}| sort bytes desc| limit 10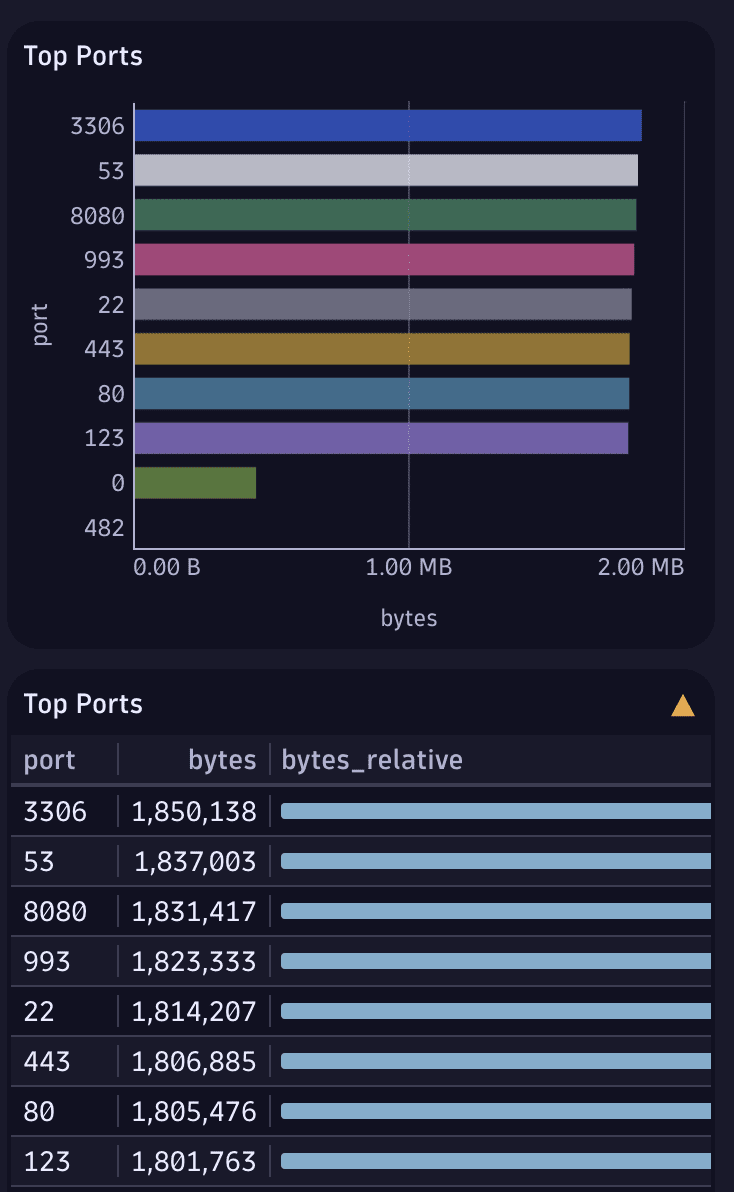 A NetFlow chart showing the top used ports by bytes
Limits and limitations
Logs are ingested using the OpenTelemetry protocol (OTLP) via the Dynatrace OTLP API and are subject to the API's limits and restrictions. For more information, see Ingest OpenTelemetry logs.