What's new in Dynatrace SaaS version 1.317
- Release notes
- 10-min read
- Rollout start on Jun 17, 2025
This page showcases new features, changes, and bug fixes in Dynatrace SaaS version 1.317. It contains:
Application Observability | Log Analytics
Improve cost-control and predictability when analyzing log data
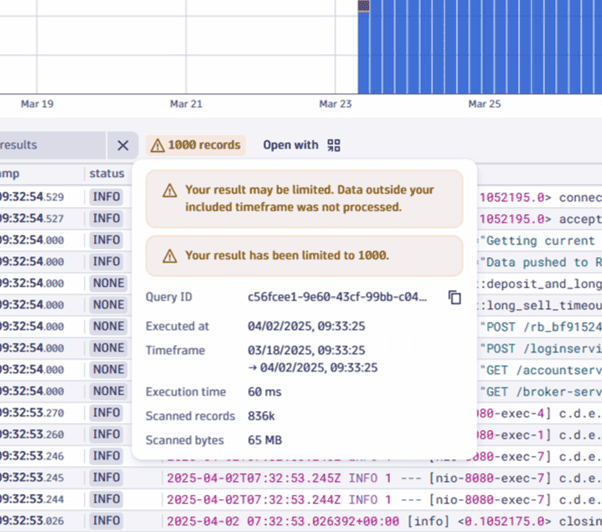
You can now use the Retain with Included Queries model at the bucket level and mix on-demand queries with included queries for selected timeframes. This solution helps to control costs by allowing you to run only included queries and have volume-based pricing based on retention rather than usage-based pricing on scanned data.
For configuration details, see Take control of log query costs using Retain with Included Queries.
With the newly introduced Retain with Included Queries pricing model
- You gain predictable log query costs by shifting from usage-based billing to a retention-based approach—ideal for teams that require upfront cost visibility and budget control.
- Admins can encourage cost-efficient usage by guiding users and groups to run included queries. This will eliminate the need to monitor every query individually.
- Dynatrace simplifies data access and operations by removing the need to reload data from archives or manage multiple storage tiers. Users get instant access to all retained log data for up to 10 years.
- Especially beneficial for central teams supporting multiple business units with strict budget constraints.
The image below shows a warning message when a user (restricted to included queries) attempts to query data outside of the allowed timeframe.
Feature updates
Platform
Smartscape on Grail
We have started rolling out the Grail-native Smartscape storage into production. It comes with new DQL functionality to work with Smartscape nodes and edges. The storage is running in parallel to the existing classic entity storage. We are not making any changes to the topology that is stored in the classic entity storage and you should continue to use it as usual.
Currently, the Smartscape on Grail storage does not contain any data. Over the following months we will kick off preview programs of new functionality that will utilize the new storage.
The new storage comes with new DQL commands that allow you to query nodes and edges and to traverse the topology. For more information, see Smartscape on Grail.
Stay tuned for upcoming preview programs in the area of Cloud monitoring and Kubernetes monitoring in the next months.
Platform
Simplify metric extraction in OpenPipeline
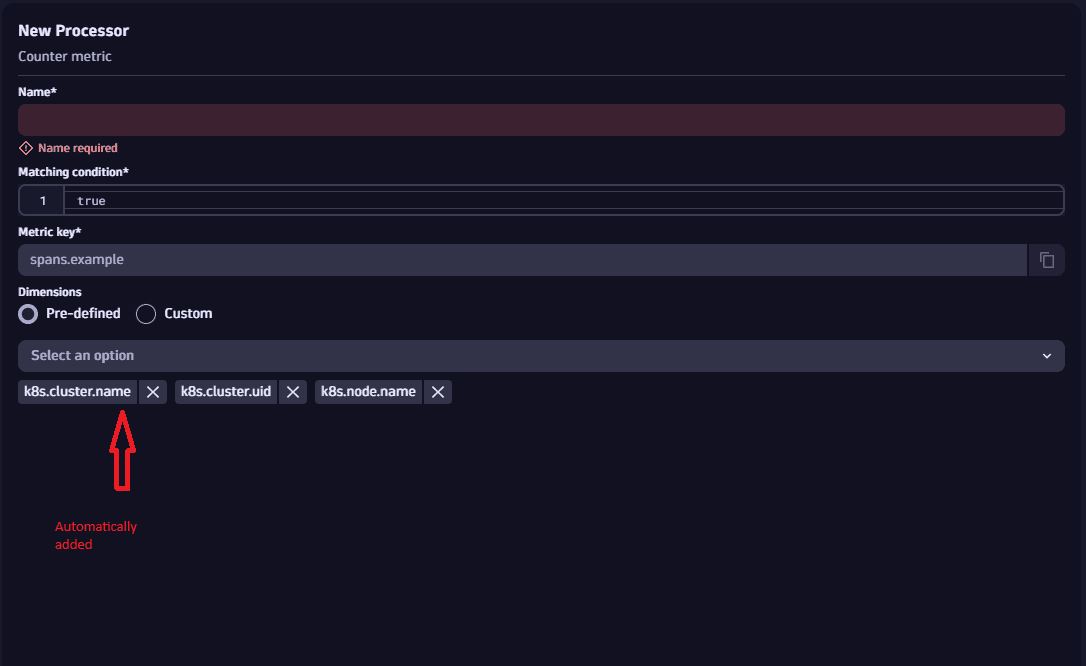
Dynatrace now automatically adds relevant fields for metric extraction. This saves time by applying consistent defaults (for example, k8s.namespace.name, dt.cost.costcenter), thus simplifying setup and reducing repetitive steps.
Platform
Transform and control access to metrics with new processing and security context assignment
You can now transform metrics records in OpenPipeline by renaming fields, adjusting values, adding new attributes and more DQL functions to fit your analytics and cost optimization needs. Assigning a security context enables granular, record-based access control—ideal for restricting visibility of sensitive KPIs or powering real-time dashboards for specific teams. No configuration or action is required to enable this feature.
Platform | Settings
Fixed incorrect placing of buttons when configuring Java service definitions
Fixed an issue where buttons were rendered off-screen when configuring Java service definitions on certain display sizes.
Application Observability | Log Analytics
Unified data exploration experience in Logs app and Distributed Tracing app
We harmonized the data exploration experience in the Logs app and Distributed Tracing app. Both apps share the layout, table experience, and filtering and are optimized for productivity and readability.
Application Observability | Log Analytics
Improved user experience in case of error
Improved empty state messaging to clearly indicate query issues and guide users with relevant suggestions.
Application Observability | Distributed Traces
Unlock log integration and enhanced visibility with the new Distributed Tracing App
-
Explore related logs: Seamlessly navigate between traces and their associated logs in a unified, side-by-side interface. This integrated approach eliminating context switching and accelerating troubleshooting with complete system behavior visibility.
-
Improved waterfall visualization: Experience redesigned trace waterfall with enhanced iconography and descriptions for web requests, queue interactions, and database statements.
-
Full end-to-end trace visibility: Gain complete visibility into complex transaction flows with the ability to see full end-to-end traces, across multiple IBM MQ message queues even when spanning different trace IDs.
-
Major performance improvements: Experience significant performance enhancements.
Application Observability | Distributed Traces
New trace sampling setting for RPC requests
Added a new trace sampling setting for RPC requests, allowing configuration of how OneAgent samples specific Remote Procedure Calls (RPCs). This can be set at the global environment level or scoped to a process group, host group, Kubernetes cluster, or namespace.
Business Observability | Business Observability
Updated redirect to Threats & Exploits
Streamlined triage of potential security incidents with an updated redirect to  Threats & Exploits.
Platform | OneAgent
Collect structured data from Windows event logs via new feature flag
OneAgent version 1.317+
Introduced a new feature flag on the Log Agent Feature Flag configurations page for enabling structured Event Data parsing. This flag is disabled by default.
When enabled, structured data is collected from Windows event logs—first from the User Data branch, or if unavailable, from the Event Data branch and its sub-branches. The collected data is transmitted as attributes alongside the recorded content.
Attribute names are derived from available information such as tag names, the value of the name field, or, when tag names are repeated and the name field is empty, a sequential number is appended to the tag name.
Sub-branches without values and tags labeled as Binary are omitted.
Application Observability | Log Analytics
Enhanced filtering possibilities within context menu
Logs app now provides more filtering options through the context menu in both the table and details panel:
- Filtering by
starts withoperator for values longer than 100 characters - Filtering by
greater thanandless thanoperators for numerical values - Option to remove applied filters
- Support for filtering values that are not present in a record
Application Observability | Log Analytics
Added extended records limit in table
You can now retrieve up to 50,000 log records using the limit command in advanced DQL mode. This enhancement provides better flexibility and visibility when analyzing large volumes of log data.
Digital Experience | RUM Mobile
Custom control label for action name
Added a new case to the withCustomInstrumentationConfig view modifier that allows to specify the action name. Use .useControlName(customName) to define the action name.
Digital Experience | Synthetic
Updated Synthetic installer to use JRE 17.0.14
The JRE has been updated to version 17.0.14 to benefit from performance improvements, enhanced security vulnerability protection, and bug fixes.
Platform | DQL
New DQL functions: smartscapeId(), toSmartscapeId(), asSmartscapeId()
New DQL functions are now available: smartscapeId(), toSmartscapeId(), asSmartscapeId()
-
SmartscapeId("HOST", 0xA)andSmartscapeId("HOST", 10)– Constructs a["HOST, 0xA]Smartscape ID, that is equivalent to String"HOST-000000000000000A" -
toSmartscapeId("HOST-0000000000000123")– generates a Smartscape ID["HOST", 0x123] -
asSmartscapeId(...)– returns the Smartscape ID if the argument is one,nullotherwiseSmartscapeId("HOST-0000000000000123")
Platform | DQL
New DQL functions: getNodeName(), getNodeField()
New DQL functions are now available: getNodeName(), getNodeField()
-
getNodeName()andgetNodeField()are similar to_entityName_and_entityAttr_functions functionality-wise. Only the name is different and the lookup source is not entity model on Latest Dynatrace, but the new Smartscape store. -
getNodeName(expr)– acts as a shorthand alias for thesmartscapeAttrfunction specifically for retrieving the entity’s name -
getNodeField(expr, name)– retrieves a specific attribute for a smartscape node
Platform | DPL
New SMARTSCAPEID pattern matcher
A new DPL matcher, SMARTSCAPEID, has been added to support parsing Smartscape entity IDs. This matcher recognizes strings in the format {NodeType}-{HEX16}, where:
-
NodeType: String of[A-Za-z_:0-9], up to 255 characters. -
HEX16: Exactly 16 uppercase hexadecimal digits ([A-F0-9]{16}).
Examples:
-
HOST-FFFFFFFFFFFFFFFF -
PROCESS_GROUP-0000000000000000 -
HOST-8BF6596F7D07B054
Platform | DQL
New function: arrayCumulativeSum()
The arrayCumulativeSum() function is now available.
It accumulates numeric arrays.
- Default behavior for numeric values: each element of the result is the sum of current and all previous values as double.
- If there are non-numeric elements, the whole array will be null.
- Leading nulls remain null.
- Null elements that had preceding numeric values result in the unchanged accumulated sum.
arrayCumulativeSum(array)
Parameter
| Name | Type | Mandatory | Default | Constraints | Description | |
|---|---|---|---|---|---|---|
| array | array | `<LONG | DOUBLE>` | yes | If it contains at least one non-numeric element, the function will return null | The input array |
Infrastructure Observability | Kubernetes
Bearer token authentication for Prometheus scraping in Kubernetes
Add support for bearer token authentication when scraping Prometheus metrics via ActiveGate Kubernetes monitoring.
For details, go to Monitor Prometheus metrics.
Platform | Settings
Fixed incorrect placing of buttons when configuring Java service definitions
Fixed an issue where buttons were rendered off-screen when configuring Java service definitions on certain display sizes.
All | Distributed Traces
Improved attribute visualisation for individual trace view
All available horizontal screen space is now utilized by attributes until either the space is fully occupied or all attributes have been displayed.

Application Observability | Distributed Traces
Initial release of DB2 monitoring on z/OS
Initial release of the DB2 monitoring on z/OS. This includes the collection of the following key metrics:
DB2 Metrics collected:
-
CPU metrics
- CPU time for DB2 subsystem
- CPU time for DB2 MSTR
- CPU time for DBM1 address space
-
Connection metrics
- Total number of active connections
- Number of outbound connections from DB2 to remote site
- Number of inbound connections to DB2 from remote site
- Number of failed connections
-
zIIP time
-
Number of EDM pool requests
-
Number of cache hits
Application Observability | Distributed Traces
Spring Reactive Kafka Binder support
To support distributed tracing in Spring Reactive Kafka Binder a new opt-in feature Spring Kafka Stream Binder support was added. It supports non-reactive auto commit scenario with a bean signature public Consumer<Flux<Message<T>> consume() {}.
It is not compatible with Java Kafka - discover listeners automatically if Reactor Kafka is used.
Platform | OneAgent
Capture Kafka message headers on consumer operations
OneAgent version 317 introduces support for capturing Kafka message headers during message consumption operations. Based on configuration, the specified headers will be captured as strings.
Infrastructure Observability | Hosts
Improved Tomcat process detection
Improved Tomcat technology detection for Tomcat server running as a service.
Application Observability | Distributed Traces
PHP Redis cluster support in OneAgent
This is a new feature for PHP OneAgent. We've introduced a sensor that detects and displays RedisCluster calls made via the phpredis extension in Distributed Traces. When possible, Redis cluster method calls in traces will indicate the specific cluster node where the command was executed.
This feature can be disabled using the debugPhpDisableRedisClusterSensor flag.
We support phpredis versions from 3.1.6 to 6.2.0.
Software Delivery | Site Reliability Guardian
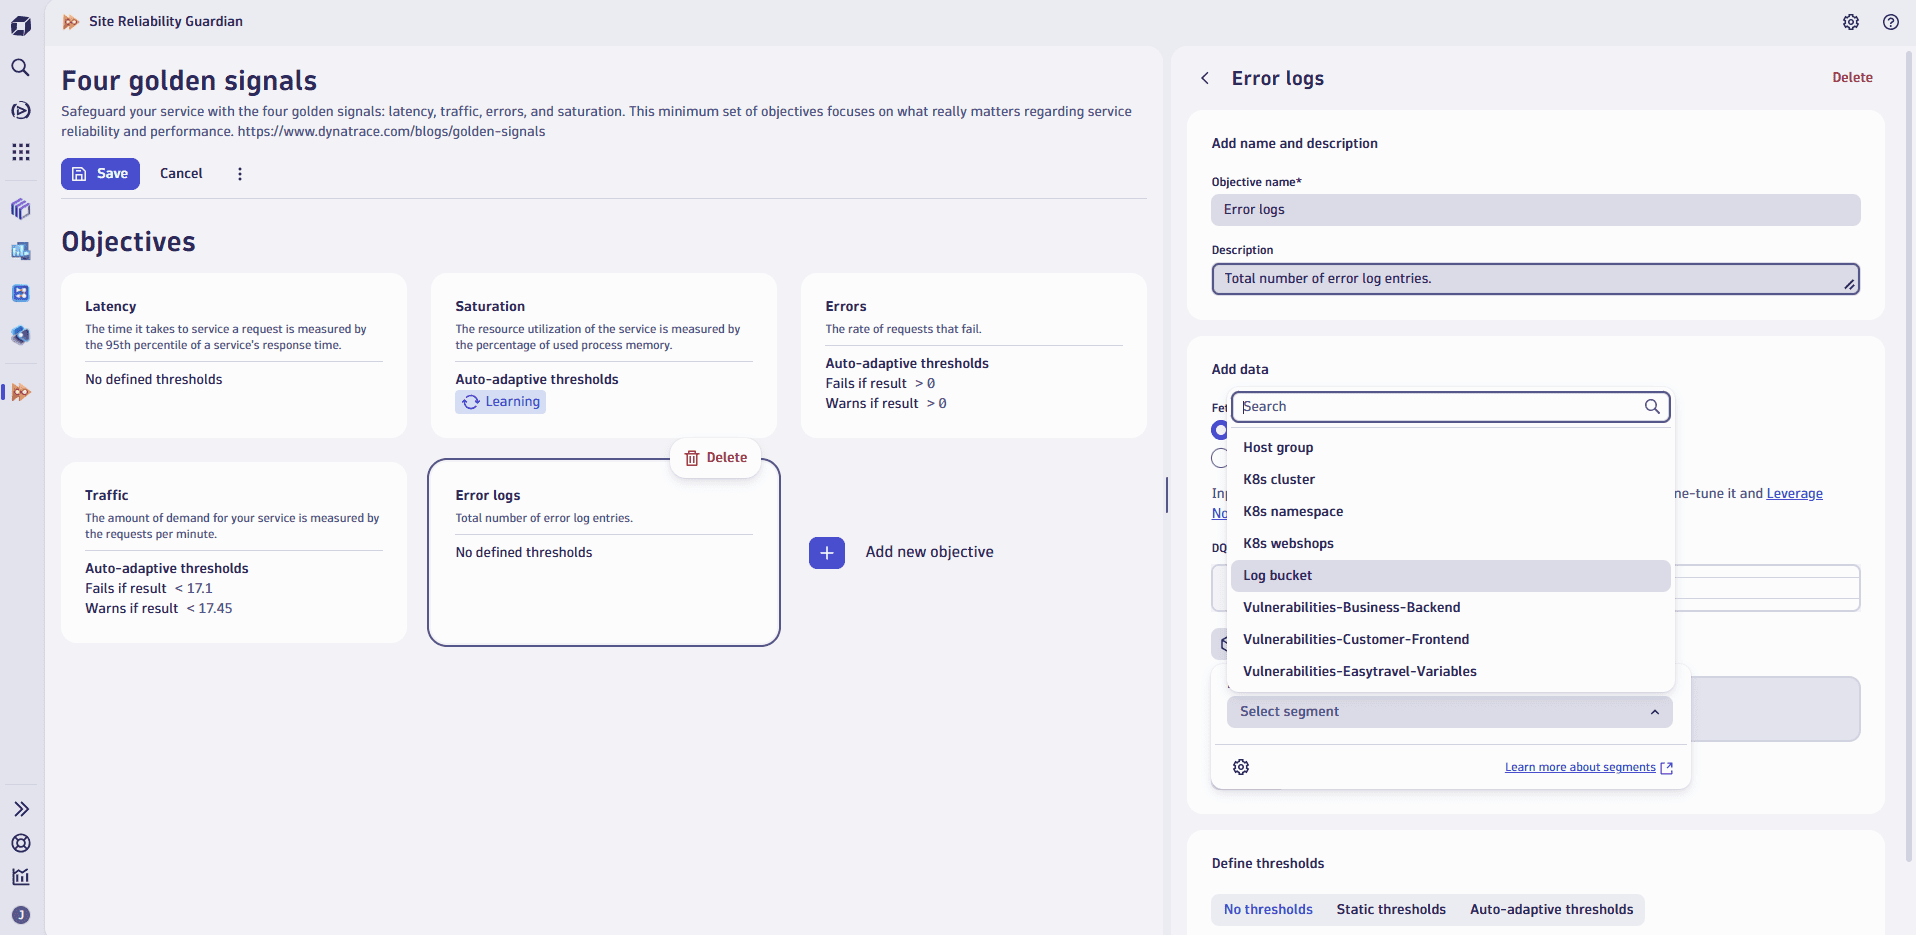
Filter out the noise by leveraging Segments in Site Reliability Guardian
You can now define objectives in Site Reliability Guardian using segments, offering a more streamlined and consistent way to scope relevant data.
This enhancement aligns objectives with the segmented data views already used across the platform, ensuring they reflect your existing data structures. By leveraging segments, such as logs from a specific environment, you can precisely target the data that matters most. This speeds up setup and ensures consistency across workflows.
Software Delivery | Site Reliability Guardian
Enhanced data table experience
This release introduces several user experience enhancements to data tables across Site Reliability Guardian, making data exploration, analysis, and decision-making faster and more intuitive.
Breaking changes
Platform | OneAgent
Declarative process grouping rules now work for deep monitored processes in application-only deployments
Declarative process grouping (DPG) rules now apply to deep monitored processes in application-only deployments. If a DPG rule was previously created that matches these processes, the Process Group (PG) and Process Group Instance (PGI) IDs may change accordingly.
This change only affects Code Modules deployed as application-only.
Application Security | Security events
New dedicated table for security events in OpenPipeline
You can now manage security data more effectively with a dedicated security.events table in OpenPipeline. This gives you full control over how security-related events are ingested, processed, and stored without interfering with other event types.
What you'll be able to do with security.events
-
Targeted alerting for critical security threats: Set up custom alerts for specific incidents like unauthorized access attempts or unusual login patterns. Instead of sifting through all events, you can now monitor just security signals that matter the most to your organization.
-
Smarter storage with separate retention policies: Apply longer retention to critical security events, without bloating your main storage or affecting performance. Keep what you need, for as long as you need it.
-
This is just the beginning: Use the
security.eventstable to build custom detection logic or optimize investigations, and create focused views and workflows that align with your organization’s unique security needs. Explore how this space fits best into your security strategy.
Heads-up: Migration deadline for security events table is December 2025
Built-in security events are currently available in both the generic events table and the new security.events table. This duplication will continue until the migration is complete, after which events will appear only in the new table.
To ensure a smooth transition and avoid disruptions to your workflows, please complete the migration by end of December 2025.
Get started by activating the security.events table in OpenPipeline and adapting your security workflows accordingly.
For a full overview of what's changing and step-by-step guidance on how to migrate, follow the instructions in the Grail security table migration guide.
Infrastructure Observability | Hosts
Improved splitting Oracle Net Listener processes by listener name
Fixed the issue where Oracle Net Listener processes were not correctly separated by name when OS services were not collected on Windows. Additionally, the correct listener name is now used instead of the Oracle home name.
All | Services
OpenTelemetry services only
Service Detection v2 for OpenTelemetry
Service Detection v2 (SDv2) introduces a major enhancement by making previously hardcoded OpenTelemetry service detection rules configurable directly through the Dynatrace web UI.
 These changes may affect existing service and endpoint configurations.
- Service entry spans: Endpoints are no longer created for client operation spans.
- Istio gateways, webservers, and FaaS:
Catch-all/endpointsremoved; endpoints now named afterhttp.routeorspan.name. - Adobe Experience Manager: Special
/system/probes/healthto "Health Check" mapping removed. - Generic services: There are no fallbacks to class/method names. Fallbacks are now always
span.name. - Configurable rules: Default OpenTelemetry service detection rules are now exposed and can be toggled on/off.
- Custom rules: Create service detection rules based on resource attributes with conditional logic.
- Service name templates: Define service names using attributes (for example,
{application.name}-{application.id}). - Service splitting: Split services by resource attributes (up to 10 attributes per rule).
- Reverted: Endpoint detection. This reverted change is planned to be restored in a forthcoming release (currently planned for Sep 2025). For details and discussion, see Service Detection V2 (SDv2) Overview and Important Endpoint Detection Update.
- Failure detection: Customize failure detection beyond default HTTP/gRPC codes and span status.
For more details, go to Service Detection v2.
Fixes and maintenance
Resolved issues in this release
- Significantly improved performance of IAM policy binding endpoints. (PS-33375)
- Fixed a rare case where problems could lose some root cause evidence information with further problem updates. (DI-20644)
- Removed timeframe from Honeycomb visualization in classic dashboards, now aligning with all non-timeseries-based visualizations that don’t have a timeframe. (PAPA-25301)
- Fixed an issue with Davis event reports not considering the
dt.queryfield. (DI-20795) - Session Replay: Resolved issue in which sessions with long views under some conditions stopped working every 5 minutes. (DEM-10704)
- OneAgent: Fixed an issue with configs not being updated when migrating from one tenant to another. New configs used to be provided by the server only if a newer revision was available. Now configs are provided when revisions differ. (OA-34023)
Dynatrace API
To learn about changes to the Dynatrace API in this release, see Dynatrace API changelog version 1.317.