Dynatrace SaaS release notes version 1.296
- Latest Dynatrace
- Release notes
Rollout start: Jul 15, 2024
Product news
- Dynatrace Opportunity Insights uses AI prediction and real-user data to optimize business outcomes
Performance and error optimization is complicated, and the approach to driving improvement has long relied on static recommendations disconnected from a site’s end users and their experiences. While traditional methods can help you understand when your users face poor performance or errors, understanding if and how much these problems impact your business remains largely guesswork. […]
- Automate digital excellence with Dynatrace Synthetic Monitoring and Workflows
Managing IT infrastructure in a rapidly evolving digital environment can feel like playing a Jenga game. Dynatrace® Synthetic Monitoring integrated with visual workflows offers a robust solution for maintaining stability and growth. Dynatrace now combines automation and synthetic monitoring to respond to events, execute monitors, and assess impacts on user experience. This integration supports use cases like automatic release validation, digital infrastructure change validation, and custom synthetic scheduling, ensuring that all modifications meet performance and functional criteria.
- Dynatrace extends Synthetic Monitoring capabilities with Network Availability Monitors to validate the availability of infrastructure and services
Dynatrace® extends Synthetic monitoring scope towards the network and transport layers of your tech stack with the introduction of new synthetic test types: ICMP Ping, TCP port check, and DNS—all under the umbrella of Network Availability Monitoring (NAM). Your teams get 24/7 insight into the health and availability of your infrastructure and network. Synthetic Monitoring also now provides basic information about the health of network services that aren’t based on HTTP(s) and, thus, were not targeted for synthetic testing in the past.
Breaking changes
Change in monitoring rules criteria for code-level vulnerabilities
Breaking change Application Security | Vulnerabilities
Starting with Dynatrace version 1.298, the monitoring rules criteria for code-level vulnerabilities (for both Runtime Vulnerability Analytics and Runtime Application Protection functionalities) will allow matching based on resource attributes instead of the process group ID.
The process group ID field will be removed and automatically migrated to an equivalent rule based on resource attributes. Removing the process group is also done in Settings - Objects API for the schemas:
builtin:appsec.code-level-vulnerability-rule-settingsbuiltin:appsec.attack-protection-advanced-config
To continue using the process group in these APIs, you must explicitly state the schemaVersion, and Dynatrace will automatically convert these rules to use resource attributes instead.
Validation of deployment-api query parameter (instead of fallback to default value)
Previously, the deployment API endpoints performed a fallback to the default value in case the given value was invalid. With this change, the request will be rejected due to constraint violations.
New features and enhancements
Custom attribute case sensitivity for logs
Infrastructure Observability | Logs
Custom attribute keys for logs now accept uppercase letters, but two custom attributes differing only in letter case aren't accepted. For example, Myattribute and myAttribute are treated as the same attribute key, so you can enter only one of them.
In Logs Classic:
-
Attributes of ingested log events are not lowercased. Instead, they are matched to any attribute that is equal when case is ignored (for example,
MyattributematchesmyAttribute). -
Attribute
dt.ingest.warning, with valueattr_key_case_mismatch, is added to the log event. -
Optional Attribute
dt.ingest.debug_messages, with details about attributes that were modified in that way, can be added to log events. To enable this, go to the new Settings > Log Monitoring > Debug settings page and turn on Enable log ingest debug information.
Searches are not case-sensitive for attribute names or values, but queries containing attribute names with an invalid case will result in a warning in the web UI or in API responses.
Retirement of Office 365 connectors within Microsoft Teams
Due to the retirement of Office 365 connectors within Microsoft Teams, Microsoft Teams integration for Dynatrace notifications has been deprecated and it won't be possible to create new connectors after August 15th, 2024. Existing connectors will work until December 31, 2024.
Follow the Microsoft transition instructions to switch from Office 365 connectors to Microsoft Workflows.
New type of synthetic tests – Network Availability Monitoring
Digital Experience | Synthetic Monitoring
We extended the scope of synthetic monitoring with a new type of synthetic test - Network Availability Monitoring (NAM), which consists of the following types ICMP, TCP and DNS. With this improvement, you can have 24/7 insight into the health of infrastructure and the network providing access to it.
Synthetic for Workflows
Automations | Workflows
You can now enhance your automation capabilities with Synthetic Monitoring. Synthetic for Workflows allows you to execute synthetic monitors on demand at selected locations within your workflows.
Unified ingest of vulnerability findings
Platform | OpenPipeline Application Security | Vulnerabilities
You can now ingest external security events from multiple third-party products into Grail with Dynatrace OpenPipeline and operationalize your data on the Dynatrace platform.
A seamless integration is now possible for AWS Elastic Container Registry (ECR) vulnerability findings, but you can ingest custom security events from any third-party system via API.
To help you visualize data and automatize notifications, we provide sample dashboards, workflows for Jira tickets, and workflows for Slack notifications that you can upload in your Dynatrace environment and use for your ingested security events.
For more details on the topic, see Security events ingest.
Grail limits per notebook section or dashboard tile
Latest Dynatrace Platform | Dashboards Platform | Notebooks
You can now check and adjust the Grail  query limits per section/tile in Notebooks
  and Dashboards
  . Just edit your dashboard tile or notebook section and expand Query limits in the configuration panel.
- These settings determine the maximum limits when fetching data. Exceeding any limit will generate a warning.
- Your existing tiles/sections are not directly affected by these changes and will return the same results as before.
Settings
-
Read data limit (GB): The limit in gigabytes for the amount of data that will be scanned during a read.
-
Record limit: The maximum number of result records that this query will return. Default: 1,000 records. To see more records, you need to increase the value of Record limit.
-
If your query has no
limit, such asfetch logsthe value of Record limit is applied. By default, you will see up to 1,000 records.
-
If your query also includes a
limit, such asfetch logs| limit 2000the lower of the two values (either
limitin your query, or Record limit in the web UI) is applied.In the example above, you would still see only 1,000 records unless you increased the value of Record limit.
-
-
Result size limit: The maximum number of result bytes that this query will return. For better performance with typical queries and smaller documents, the default is set to 1 MB.
-
Sampling (Logs and Spans only): Results in the selection of a subset of Log or Span records.
New honeycomb visualization in Dashboards and Notebooks
Latest Dynatrace Platform | Dashboards Platform | Notebooks
The new honeycomb visualization in Dashboards and Notebooks offers a compact, high-density view of metrics across numerous entities, ideal for infrastructure monitoring. Use it to identify hotspots, group clusters, and drill down into your data.
For example, this query combined with the honeycomb visualization shows the CPU usage of many hosts at a glance.
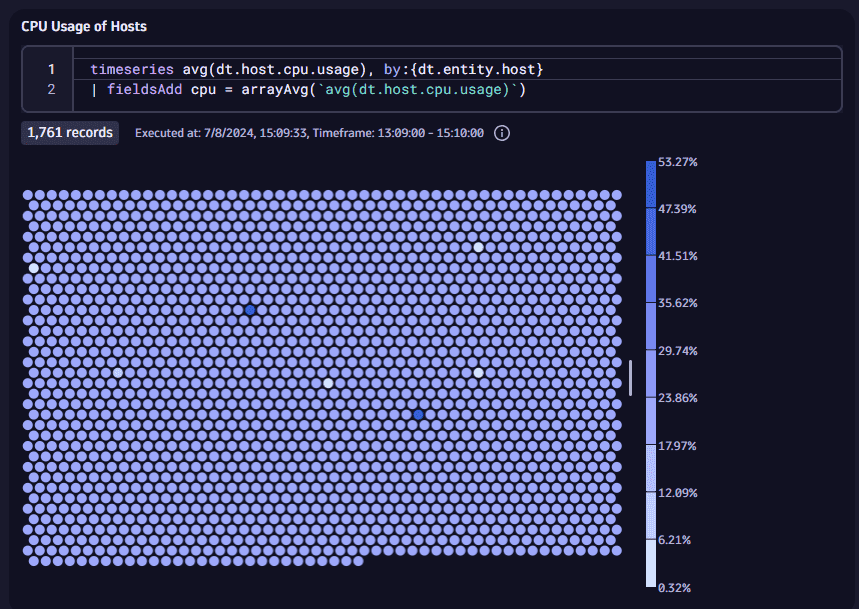
- Hover over a cell to see details
- Select a cell to open a menu of cell-specific options

For details, see Honeycomb visualization.
Tile status indicator
Latest Dynatrace Platform | Dashboards
Dashboards tiles display a warning symbol ![]() in the upper-right corner indicating the tile status. Hover over the warning icon to learn improvement suggestions for the respective query.
in the upper-right corner indicating the tile status. Hover over the warning icon to learn improvement suggestions for the respective query.
We recommend reviewing the queries for affected tiles. Alternatively, you can reach out to a Dynatrace product expert via live chat within your Dynatrace environment for assistance.
Notebook version management
Latest Dynatrace Platform | Notebooks
In Notebooks , you can now view and manage notebook versions.
-
Display your notebook.
-
In the upper-right corner of your notebook, select
 History.
This displays a menu of the most recent versions of the current notebook.
- Date
- Time
- Name of person who created that version
-
From any version entry in the History menu, you can select version-specific actions.
 Preview displays a preview of the selected version.
- Restore switches your notebook to the selected version.
- Make a copy creates a new notebook from the selected version. The original notebook remains unchanged.
- Download saves a JSON file of the selected version of the notebook to your local machine.
- Preview in new tab displays a preview of the selected version on a new browser tab.
- Delete this version deletes the selected version.
-
To list and manage all versions of the selected notebook in a separate window, go to the bottom of the History menu and select Show all.
Declarative technology is displayed as a main technology
Infrastructure Observability | Hosts
A declarative technology is now shown as the main technology on Dynatrace pages.
Warning for declaratively grouped deep-monitored processes
Infrastructure Observability | Hosts
A warning message will be displayed for deep monitored processes that fall into declarative grouping, which makes some data unavailable.
Container type dimension is renamed
Infrastructure Observability | Kubernetes
In the Grail-based CPU and memory request and limit metrics, the dt.kubernetes.container.type dimension has been renamed to k8s.container.type.
Alerting about a broken AWS monitoring configuration
Infrastructure Observability | AWS
A new alert is created if any of the AWS or Azure monitoring configurations stops working.
Self-monitoring metric for management zones
Cross Solutions | Self-monitoring
Added a self-monitoring metric (dsfm:server.management_zones.queries_counter) to count the number of queried management zones.
Added the ability to enable/disable AWS credentials monitoring
Infrastructure Observability | AWS
Added the ability to enable/disable AWS credentials monitoring. This is available for both existing and new AWS connections. By default, all AWS credentials are monitored. Disabled credentials don't actively collect metrics, entities, and tags from your monitored AWS account.
Dynatrace API
To learn about changes to the Dynatrace API in this release, see Dynatrace API changelog version 1.296.
Dynatrace SaaS resolved issues
General Availability (Build 1.296.45)
The 1.296 GA release doesn't contain any user-facing resolved issues.
Update 49 (Build 1.296.49)
This cumulative update contains 6 resolved issues and all previously released updates for the 1.296 release.
Dynatrace Cluster
- The metrics in the ‘Quotas’ section on the Kubernetes namespace details page are now split by the individual resource quota instance. (K8S-10296)
- Failure Analysis log filter is updated to handle undefined service ID in addition to improving filter creation for service ID. (TI-13106)
- If your OneAgents can connect to the target environment only via Environment ActiveGate (for example, they are in a restricted network), then they can't use Remote Configuration Manager to modify their connection. (DMX-7911)
- Fixed an issue in which, for premium high availability Managed clusters, after a data center failover, problems created during the failover period were not manually closeable. (DI-15087)
- Fixed retrieval of RDS and TransitGateway infrastructure and metrics for customers with large amounts of instances. (PCLOUDS-4416)
- Implements optional SHA-1 validation for ingest messages, in order to reliably detect corrupted data & trigger retries on the caller side. (GRAIL-30014)