Dynatrace SaaS release notes version 1.250
- Latest Dynatrace
- Release notes
- Published Aug 26, 2022
Product news
- Automate prioritization of quality improvements with Dynatrace SLO violation prediction and problem analysis
Does either of the following situations sound familiar to you? You have plans to enjoy an upcoming vacation, but production problems in your area of responsibility prevent you from taking time away. Or, you’ve been asked to ensure the customer experience of a production system that you have no familiarity with—you’re now responsible for a […]
New features and enhancements
Vulnerability analysis for Go
Application Security | Vulnerabilities
Dynatrace now detects third-party vulnerabilities in Go applications. Go is a key technology powering cloud-native applications and its adoption is increasing rapidly. Go vulnerability analysis is available starting with Dynatrace version 1.250 and OneAgent version 1.245.
To activate Go vulnerability analysis, enable the Go Software Component Reporting OneAgent feature. Vulnerability analysis for your Go application begins after application restart.
New default host page for AIX hosts
Infrastructure Monitoring | Hosts
The new host page is now the default for AIX hosts.
New filters in Kubernetes pods page
Infrastructure Monitoring | Kubernetes
You can now filter the Kubernetes pod list by:
- Kubernetes service
- Kubernetes service name
- Kubernetes service type
Private Synthetic location creation
Digital Experience Monitoring | Synthetic Monitoring
You can now create a private Synthetic location (via the UI or API) by specifying only a name and geolocation; a Synthetic-enabled ActiveGate can be assigned to the location later. Such private locations are noted as "No ActiveGate assigned" until associated with an ActiveGate. This change makes location management more flexible and helps even further with automation.
Data Explorer layout, workflow, and data export are improved
Cross solutions | Data Explorer and dashboards
-
Save changes to dashboard, Pin to dashboard, and More (…) menu items Share link and Export to CSV are now displayed in the upper-right corner of the Result section, under the Run query button, after you run a query.

-
An eye icon in a metric row indicates and toggles whether a metric is selected as part of the query.

-
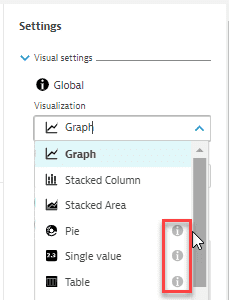
An information icon and hover text are displayed in the visualization selection list:

This is to notify you that some visualization settings are visualization-specific.
- If you select a visualization and make some visual settings, and then you switch to a different visualization, some of your visual settings for the first visualization may be ignored because they do not apply to the newly selected visualization. An information icon in the list of visualizations will alert you to the possibility.
- If you then switch back to the original visualization, you may need to reconfigure some visual settings that were lost when you made the first switch.
- Values exported to a CSV file reflect the formatting specified with the Unit and Format settings.
Sign in to Dynatrace with your corporate Microsoft account
Platform Delivery | SSO
We're all suffering from password fatigue—that feeling you get when you have too many software tools, each demanding its own password—so we hope this change makes life a little easier for you.
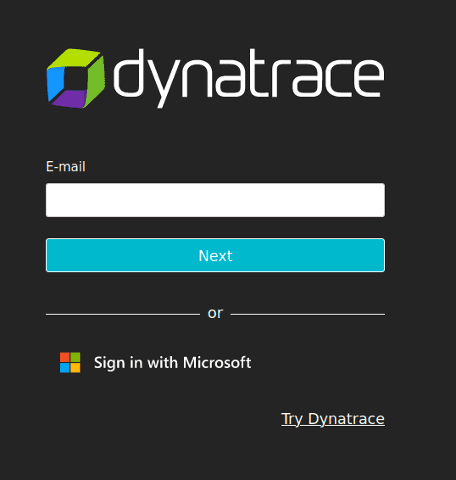
If you have a corporate Microsoft account, you can now use it to sign in to Dynatrace. You don't need to configure anything. Just go to the sign-in page and select Sign in with Microsoft.

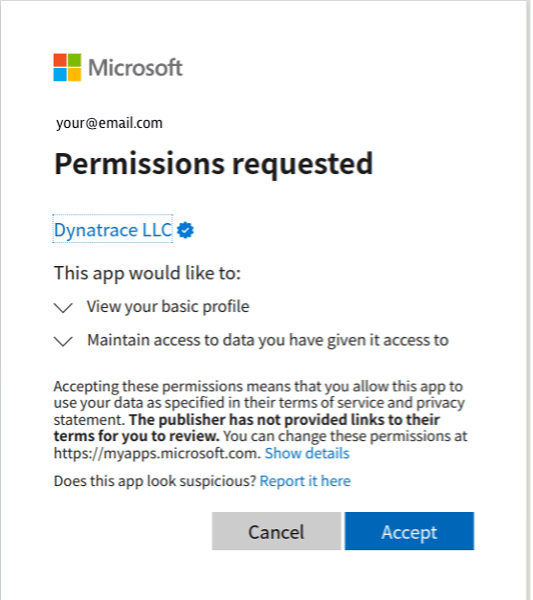
The first time you do this, you'll see a Permission requested message on the Microsoft side, where you need to allow Dynatrace to process your name and email address before you can proceed.

When you select Accept, you're redirected to the Microsoft sign-in screen, where you can easily authenticate with the credentials to your corporate Microsoft account. Then you can continue working with Dynatrace as usual.
Signing in with Microsoft can also accelerate your authentication process with Azure when your email domain is already SAML federated in Dynatrace. Selecting Sign in with Microsoft will take you into the Dynatrace environment in the same way as when you enter your email address in the Dynatrace sign-in form. Dynatrace detects domain configurations behind the scenes and seamlessly redirects to the proper sign-in flow without any configuration effort needed on the Azure side.
Dynatrace API
To learn about changes to the Dynatrace API in this release, see Dynatrace API changelog version 1.250.
Resolved issues
General Availability (Build 1.250.119)
The 1.250 GA release contains 13 resolved issues.
| Component | Resolved issues |
|---|---|
| Cluster | 11 |
| Application Security | 1 |
| Cloud Automation | 1 |
Cluster
- Column order from Advanced Mode query is now reflected in the table. (APM-380504)
- Fixed frequent issue detection for disk and AWS alerts. (APM-386093)
- Fixed a calculation issue with observed user count shown on problems. (APM-383425)
- Fixed an issue with Managed users who didn't use the old mobile app in the last 180 days, but installed the new mobile app 3.0, who then didn't receive mobile push notifications. (DAVIS-2153)
- Key requests section is now visible in service details for background activity services. (TI-2926)
- Sorting the pods column in the Kubernetes workloads page now works properly. (K8S-3315)
- Modification of a failure detection parameter rule that is already in use no longer returns a `Custom validation failed` error message. (TI-3007)
- Kubernetes overview page properly displays memory units in the Japanese locale. (K8S-3198)
- Management zone and timeframe are now preserved when using "Preview upgraded chart" from a custom chart tile. (APM-384498)
- Events section on host, service, and synthetic pages now correctly lists all events. (APM-384256)
- Fixed issue that sometimes caused unified analysis page charts to not show a red bar in problem mode, if the metric selectors on the problem reference the same data as the charts, but the selectors are different. (DAVIS-2089)
Application Security
- The "Third-party vulnerabilities" page now correctly displays "Nodes" instead of "Process groups" for "Affected entities". (CASP-17153)
Cloud Automation
- Aggregation is now correct in displayed results for "Service performance" SLOs in the table visualization. (APM-381277)