Dynatrace SaaS release notes version 1.244
- Latest Dynatrace
- Release notes
- Published Jun 03, 2022
Announcements
Classic user sessions page end-of-life
We are deprecating the classic User sessions page soon and replacing it with a more powerful page for session segmentation. To stay tuned, keep an eye on our release notes.
New features and enhancements
Application Security
Attack Protection
Application Security now offers a new capability: Attack Protection. Dynatrace Attack Protection leverages code-level insights and transaction analysis to detect and block attacks on your applications automatically and in real time. For details, see our product blog.
Security problem indicator
The new security problems indicator on the Dynatrace top bar displays the number of critical or high-security problems in your environment. Select it to navigate to the Third-party vulnerabilities page.
Synthetic Monitoring
-
On-demand synthetic monitor executions: For CI/CD pipeline integration and spot testing of synthetic monitors, you can trigger on-demand executions of browser monitors and HTTP monitors via the Dynatrace web UI or the Dynatrace API from assigned public or private Synthetic locations. For such executions, you can opt to disable problem detection or exclude them from synthetic monitoring results altogether. This feature requires ActiveGate version 1.233+ on private locations. For more information, see On-demand synthetic monitor executions for CI/CD.
-
External vault integration for token credentials: In addition to username-password credential pairs, you may now synchronize token credentials with external vaults—Azure Key Vault and HashiCorp Vault.
Service-level objectives
A new SLO indicator called Service performance is available when you create an SLO.
Data Explorer and dashboards
- In Dynatrace, Explore data has been renamed Data Explorer to align with the feature name.
- Export to CSV file format from Data Explorer is now also available for table visualizations.
- The new Unit visualization setting in Data Explorer enables you to specify the display unit per metric.
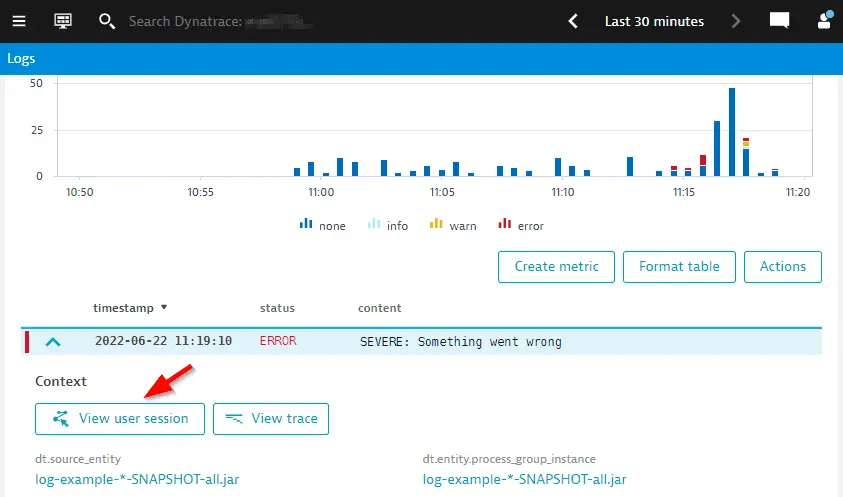
Connect your log data to user sessions and Session Replays
A new button, View user session, is available next to the View trace button in the log viewer. This button allows you to navigate from a log entry to the user session and Session Replay in the scope the log was triggered.
This immediately provides frontend context and allows you to optimize and troubleshoot your applications much quicker.
To use this feature, you need to connect your log data to traces and have Real User Monitoring, and optionally Session Replay enabled.

Web UI requirements
We have updated Dynatrace web UI requirements for supported browsers. The Dynatrace web UI will no longer be accessible on Microsoft Edge 16, Microsoft Edge 17, or Safari 11.
We encourage you to update to the latest browser versions according to our requirements.
Span attributes masking
You can now mask sensitive data in the OpenTelemetry span attribute values. You can Mask entire value, Mask only confidential data, or Do not mask the attribute value.
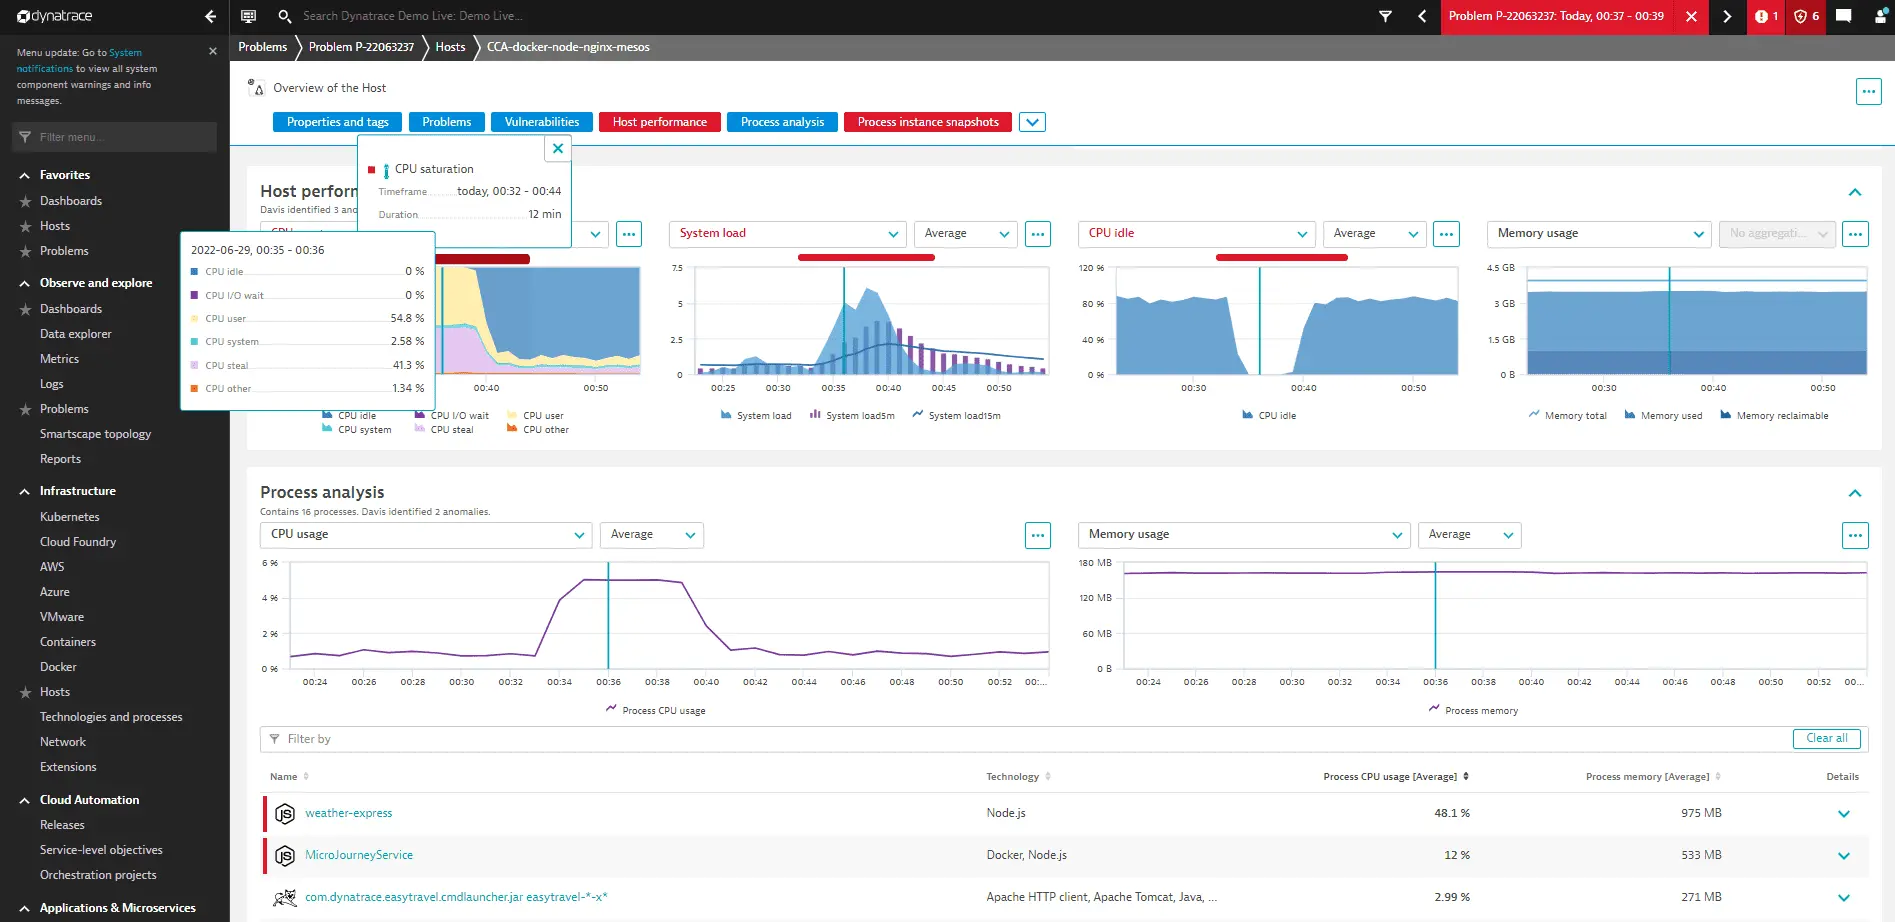
Problem analysis on host, Kubernetes, Queues, and domain-specific unified analysis pages
Unified analysis pages now support you during problem analysis with visual highlights of problem events and detected metric anomalies. Opening a unified analysis page such as the host overview pages, Kubernetes pages, queue pages, and domain-specific unified analysis pages within the context of a problem will now give you visual highlights and navigational hints about the violating metrics or the detected issues on the focused component. The image below shows the host entity page with a navigational hint to review the CPU metric.

For more information on root cause analysis, see Root cause analysis concepts.
Services
With OneAgent version 1.237 and Dynatrace version 1.244, out-of-memory and out-of-thread handling is supported for Cloud-native full-stack injection and application-only deployments.
Real User Monitoring JavaScript API
These two endpoints:
behaved differently when RUM was disabled. This behavior has been changed so that these endpoints behave the same even when RUM is disabled.
Settings 2.0
Settings history
Many settings pages now allow reviewing the configuration changes that happened on this page. Select Show history and then select a timeframe. This is available for users with at least settings:objects:read permissions for the respective schema ID.
Settings API
The /settings/effectiveValues Settings API endpoint now allows you to retrieve the settings that are in effect for any scope, such as an entity like a host.
Dynatrace API
To learn about changes to the Dynatrace API in this release, see Dynatrace API changelog version 1.244.
Resolved issues
General Availability (Build 1.244.128)
The 1.244 GA release contains 26 resolved issues.
| Component | Resolved issues |
|---|---|
| Cluster | 21 |
| ActiveGate | 1 |
| Infrastructure Monitoring | 1 |
| User interface | 3 |
Cluster
- Fixed an issue in which the problem evolution sometimes was empty. (DAVIS-1613)
- Fixed problem with AWS monitoring on Dynatrace SaaS. (APM-375757)
- Fixed a potential problem in Queue Analyzer in case a service instance is missing the service entity, which should happen very rarely. (APM-372833)
- Removed the throttling for the writing of the GLOBAL_HOOKING_STATUS attribute. (APM-373501)
- ActiveGates not assigned to a private location now correctly display synthetic details on the CMC deployment status page. (APM-372489)
- Fixed possible backup stuck in pending state when a node was removed. (APM-375115)
- Resolved an issue with the data shown in the top errors card on the application and user action overview. (RUM-6529)
- Fixed issue that delayed rollout of new "Disk options" settings page for some environments. (APM-374499)
- Prevent evaluating root cause entity management zones and tags in problems which in some cases led to spam alerts. (DAVIS-1795)
- Service Detection API - Improperly structured condition property now returns a constraint violation message. (APM-374082)
- The "visibility" and "modifiers" fields are added to the payload as optional. (APM-375320)
- Fixed page crash in custom events for alerting caused by entity filter. (DAVIS-1735)
- Validation for multiple value filtering for numeric and text base request attributes are fixed in addition to proper state when in edit mode. (APM-371740)
- Windows system tile is now visible on the Technology Overview page. (APM-373933)
- The "Utilization and Resources" charts on the pod page now display the sum of container CPU/memory usage instead of the average. (K8S-2375)
- Only unique IP addresses are now provided on Deployment screens in the "Strict firewall policy?" section, which should be allowed for outgoing connections. (APM-373146)
- Categories and side tabs now use the same percentages. (RUM-5886)
- Fixed an issue in which editing request naming rules of services was not possible for users who only have permission to change monitoring settings for specific management zones. (APM-375360)
- Adapted alerting profiles settings: now, the tag list can't be empty if the mode is set to match any or all. (DAVIS-1666)
- Fixed an issue in offline installations when "read-only access for Dynatrace employees" was ignored for support tooling pages. (APM-372430)
- Resolved an issue in which some pages could display higher values for the last 10 minutes of data. (APM-372258)
ActiveGate
- Removed an extra dot and repositioned dots in Angular view. (APM-372639)
Infrastructure Monitoring
- Fixed inconsistent metric values between infographic and summary table for AWS supporting services that were occurring for some global timeframe selections. (APM-372089)
User interface
- Fixed various issues with DQL input field: * Auto-format on paste * Do not show autosuggestion: ** On metakeys (arrows, backspace & enter) ** On click * Escape to exit code editor (blur) (if no autosuggestion, otherwise it would close the autosuggestion modal). (APM-368575)
- Fixed permission check to host settings on the new Host page. (APM-373585)
- Logs table now uses full width when extra space is available. (APM-370078)