Manage results
- Latest Dynatrace
- How-to guide
See below how you can grasp information from the DQL query response in a structured and viable way.
Wrap lines
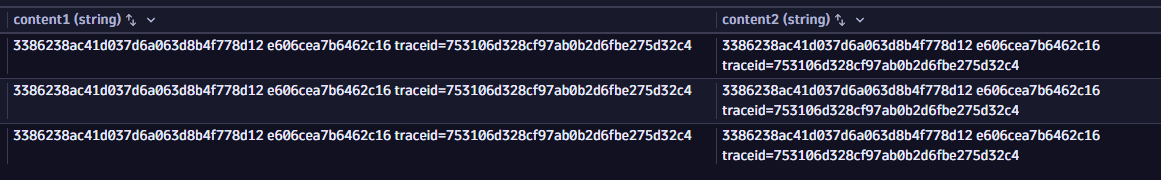
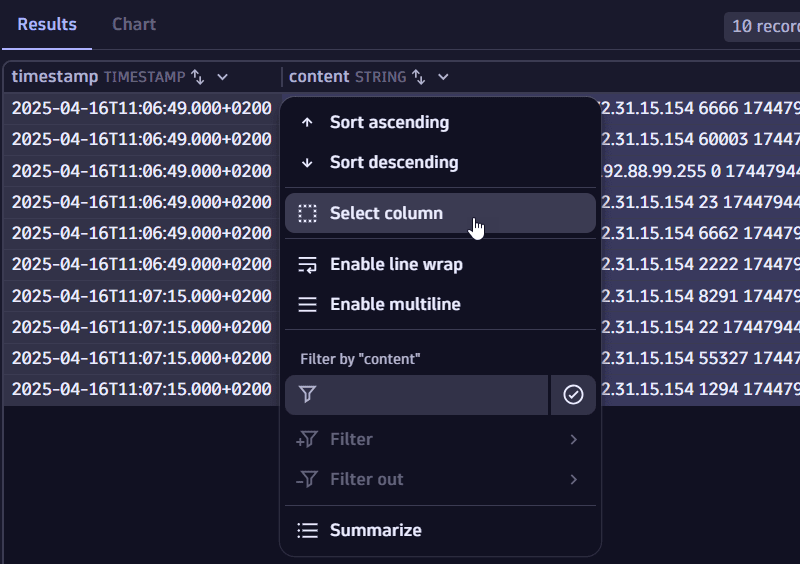
You can view longer log lines without horizontal scrolling with the Enable line wrap option. You can perform this action from the query results table menu without executing a query.
Example view when line wrapping is disabled (content1) and enabled (content2):
-
In the query results table menu, select the column header for the field you are interested in.
-
Select
 Enable line wrap.
To reverse this action, select
Disable line wrap.
View multiline logs
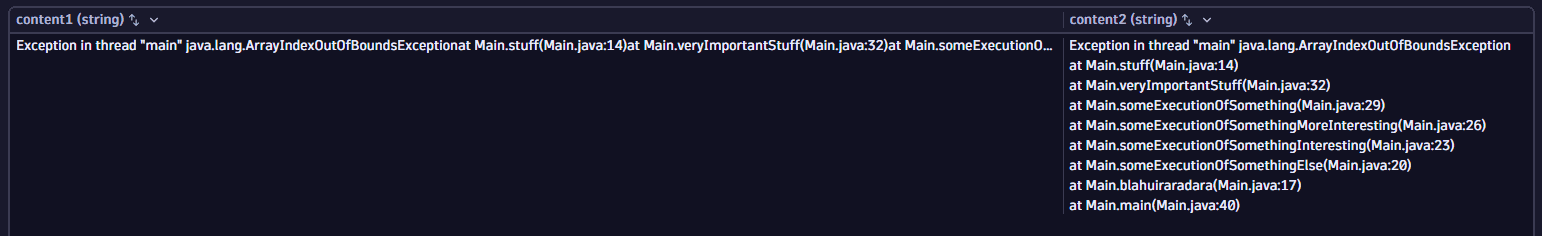
For a better understanding of data, you can view the multiline logs like stack traces with their line breaks and tabulation in their original form with the Enable multiline option. You can perform this action from the query results table without executing a query.
Example view when multiline is disabled (content1) and enabled (content2):
-
In the query results table menu, select the column header for the field you are interested in.
-
Select
 Enable multiline.
To reverse this action, select
Disable multiline.
View query metadata
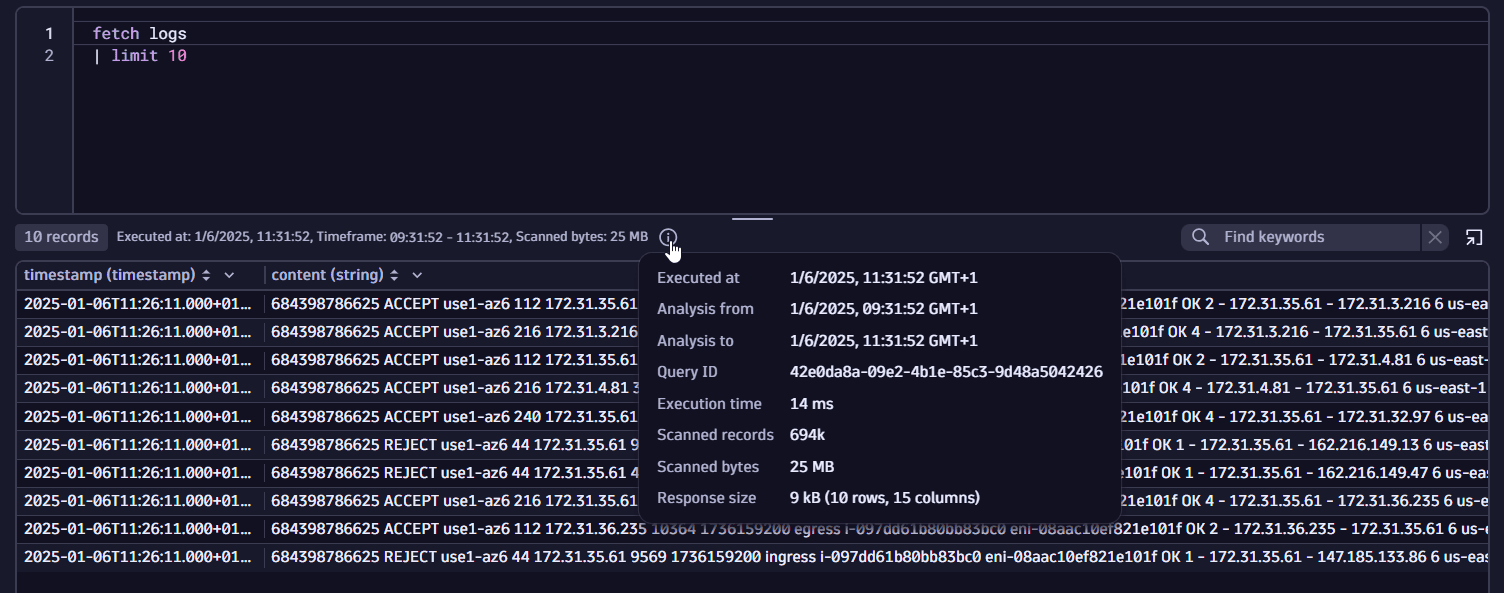
Once you execute a query, you can view the query metadata when you select the information icon below the query input.
Enhance queries
You can group and aggregate records with the same value for a given field with the Summarize option, available from the query results header menu or from the record details window. Selecting this option modifies the current query and adds the summarize command to the query input.
Explore data in the original format
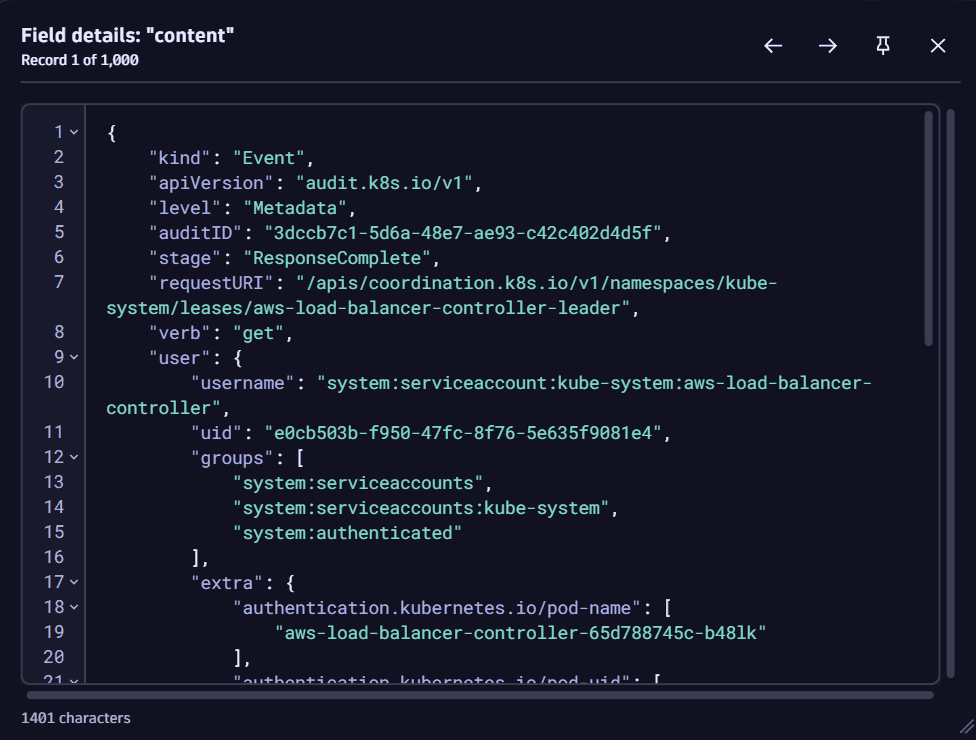
- With the View field details option, you can examine the data in its original format, regardless of the content, and without horizontal scrolling, even if it contains non-printables like tabs, multiple spaces, or line breaks.
 Investigations recognizes and formats popular data structures like JSON, making it easier to read in the field details view.
 - With the View record details option, you can display a single selected record in a pivoted way. All fields are displayed vertically, thus saving you time from horizontal scrolling and enabling faster access to the data.
Example field view
-
Data in a field:
 Field before inspecting
 -
Data in a field upon viewing details:
 field upon inspecting
Example record view
-
Data in a record:
 record before inspecting
 -
Data in a record upon viewing details:
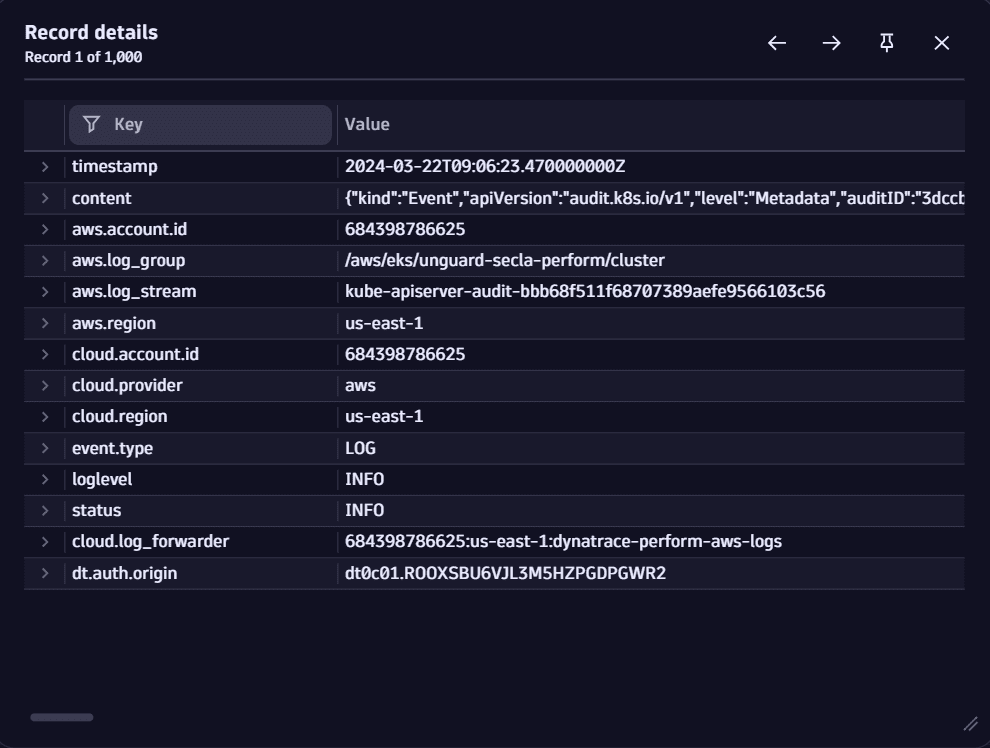 record upon inspecting
How to view details
In the query results table, right-click on a field and select View field details or View record details.
- To view record details, you can also double-click on any record in the query results table.
- You can use keyboard arrows (or arrows in the record details window) to navigate between records: you don't have to close the window to open the next record; just use your keyboard.
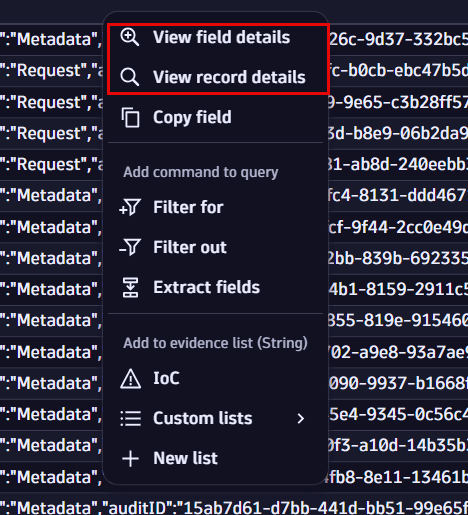
Selecting one of these options opens the field or record details window. From there, your investigation is supported with further options such as filter, extract fields, open in other apps, add evidence, and add fields.
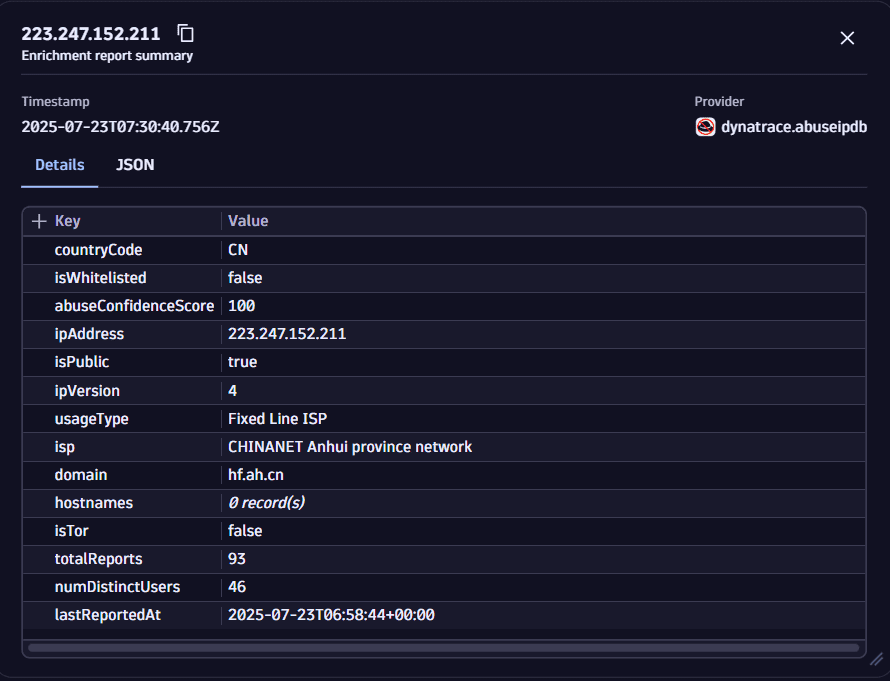
Enrich IP addresses
To accelerate threat hunting and incident response, Investigations enables you to enrich IP addresses with external reputation data from trusted third-party threat intelligence sources.
Example IP address after enrichment:
Before you begin, configure an enrichment connection (for example, AbuseIPDB, VirusTotal, or any custom HTTP‑based threat‑intelligence API).
Once configured, you can:
Manual enrichment
You can manually enrich IP addresses directly from your investigation results.
-
Right-click any IP address in the results table.
-
Select Enrich IP.
-
Choose your configured enrichment source (for example, AbuseIPDB or VirusTotal).
Saving an enriched IP to the evidence list preserves its enrichment data for consistent access throughout your investigation. To revisit the details, select the details icon next to the enriched IP address.
Manual enrichment is ideal when reviewing specific indicators of compromise (IoCs) or validating suspicious activity.
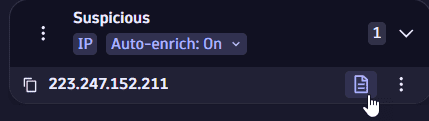
Automatic enrichment
To streamline your workflow, you can enable automatic enrichment for your evidence lists.
-
In Evidence lists, toggle Automatic enrichment to On for any item in your target list.
-
Choose the enrichment connection you want to apply.
This configuration applies to the entire evidence list. Every IP address you add will be automatically enriched using the selected source.
Need help managing your evidence list? See Manage evidence for step-by-step guidance.
New IP addresses added to the evidence list are enriched automatically using your selected source. Each enriched IP includes a details icon for quick access to its reputation data—no tool-switching required.
Automatically enriched IP addresses are tagged and stored with your investigation, allowing for faster triage and correlation.
Looking for more advanced investigation tools?
See Accelerate root cause analysis for a full overview.
Create and use lookup tables
You can define lookup tables from query results or by uploading files. Lookup tables are stored in Grail and can be reused across investigations to enrich queries with contextual data.
Define from query results
To save investigation results as a lookup table
-
In your DQL results, right-click the relevant records and select Create lookup table from the context menu.
-
In the wizard that opens:
- Select the columns to include in the lookup table
- Define the lookup field and table path
- Optional Add a display name and description to help identify the table
-
Select Create to save the table in Grail.
Define by uploading a file
To upload external reference data
-
In the left-hand panel of an opened investigation, go to the Grail storage tab and select New lookup table.
-
In the wizard that opens:
- Select a file from your disk
- Define a DPL pattern to create columns for the lookup table
- Specify a lookup field and table path
- Optional Add a display name and description to help identify the table
-
Select Create to save the table in Grail.
Use and manage lookup tables
Once saved, lookup tables appear in the Grail storage tab in the left-hand panel of Investigations.
To use or manage a table
-
Select the table.
-
Select an action from the menu:
- Load: open the table in a new query node using the
loadcommand. - Append: append the table to your current query.
- Lookup: add a
lookupcommand to your current query. - Join: add a
joincommand to your current query. - Delete: remove the table from Grail.
- Load: open the table in a new query node using the
For more about how lookup data works in Grail, see Lookup data in Grail.
Pivot results
With the query pivoting function, you can instantly navigate through and analyze interconnected data from any record based on the available dimensions. This allows you to save time from manual query creation and speed up your investigation.
For example, you start with a query to view errors from several cloud applications and pivot to a specific pod from where the specific error originated to get more context. This approach provides insights into relationships between events and helps uncover hidden patterns and anomalies that could indicate performance issues, operational irregularities, or security threats.
To start pivoting
-
In the query results table, right-click on a record.
-
Go to Pivot results by and select one of the available dimensions.
This creates a query node that fetches logs for the specific entity within a +/- five-minute range of the original log record.
The node from where pivoting was triggered remains unchanged.
-
Optional To change the pivoting time range, in the Pivot results by menu, select Customize > Pivot time range.
You can modify the pivoting time range at any time during your investigation from the settings menu in the upper-right corner of the page.
-
Optional To add custom dimensions to pivoting, in the Pivot results by menu, select Customize > Pivot custom dimensions.
Available dimensions are fetched from Grail. You can select a maximum of eight dimensions.
Looking for more advanced investigation tools?
See Accelerate root cause analysis for a full overview.
Select the whole column
To select all values in a column
- In the query results table menu, select the column header for the field you are interested in.
- Select Select column.
Copy results in various formats
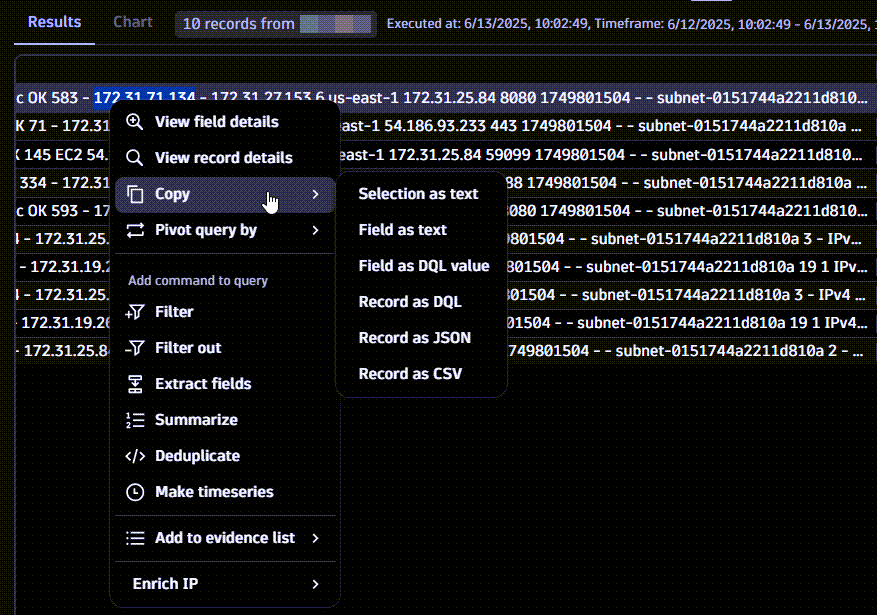
For faster access to data in the results, the Copy option in the query results table menu allows you to copy selected results in different formats, according to your needs.
-
In the query results table, select what you want to copy (partial or full value of a field, multiple fields, or columns).
-
Select Copy, then select one of the available format options.
Hover over the available options to display a preview of the output before making a selection.
 copying options
Correlate logs with performance metrics
To assess incident impact faster and uncover root causes with greater precision, you can seamlessly correlate log records with performance metrics. This enables faster troubleshooting, enhanced visibility, and more proactive resolution.
To view and correlate performance metrics with your log data
-
Right-click any log record in your results table to access available metric keys based on metadata.
-
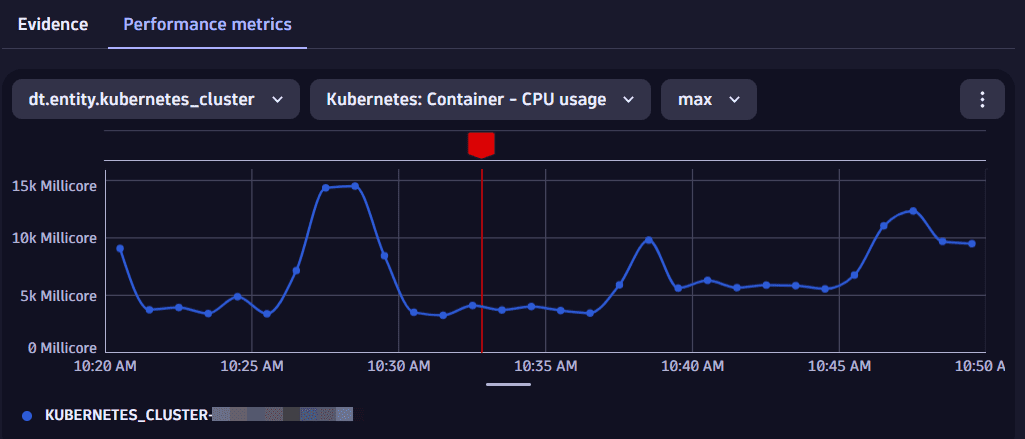
Select View performance metrics, then select the desired metric (for example, CPU or memory utilization).
This displays a metric chart in the right pane, next to Evidence.
 performance metrics
Chart behavior and context awareness
-
A red vertical line marks the timestamp of the selected log record, helping you correlate metric fluctuations with specific events. The red line won't be shown if the selected timestamp falls outside the chart's timeframe.
-
As you navigate other log records or query nodes, the chart updates dynamically to maintain context across your investigation.
-
The chart remains visible and consistent throughout your investigation—even when switching between query nodes—as long as the selected log record contains a timestamp within the defined timeframe.
Timeframe logic
- The chart displays metric data within a +/- 15-minute window around the log record's timestamp.
- If no timestamp is available in the log record, the query's analysis timeframe is used to generate the metric chart.
- You can manually redefine the timeframe to suit your investigation.
Entity dimensions and metric types
-
The default metric dimension is
dt.source_entity. If it's missing, other entity fields, such ascontainer,pod, andhost, are used. -
If no entity is available, the Performance metrics menu is disabled.
-
You can select from available dimensions in the dropdown menus and switch between metrics such as CPU, memory, network, or load.
Looking for more advanced investigation tools?
See Accelerate root cause analysis for a full overview.
Visualize with charts
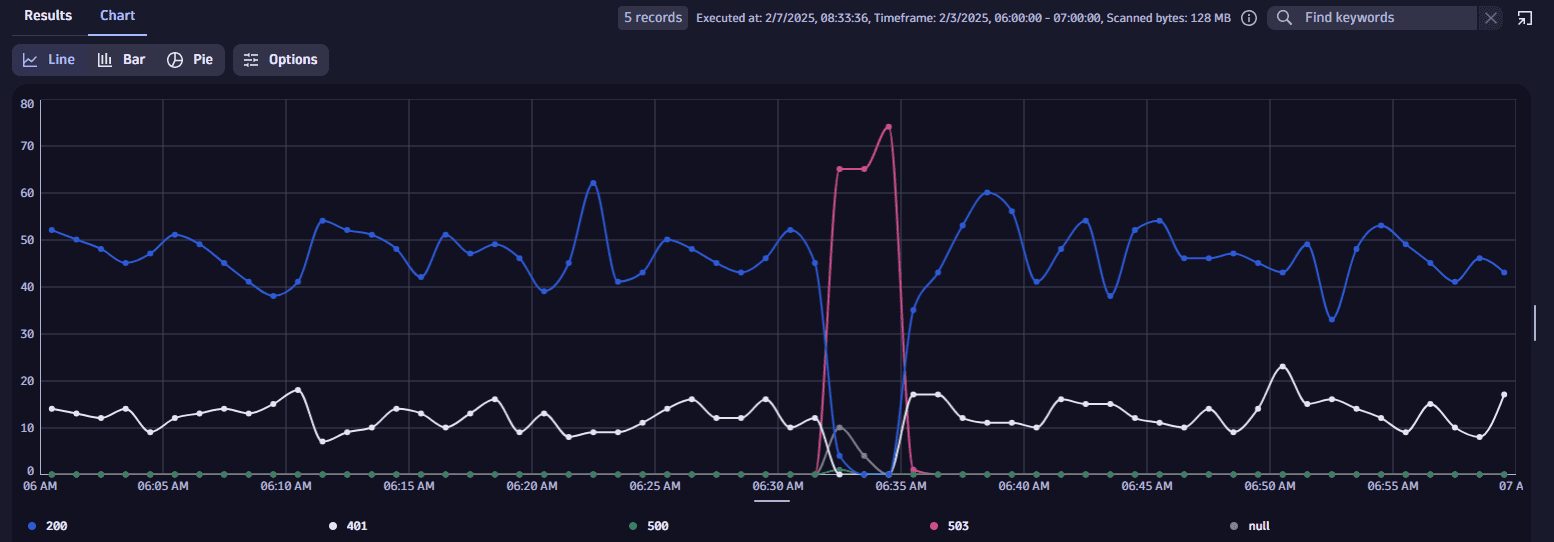
Once you execute a query, if the results can be visualized as a chart, the Chart option becomes available next to Results.
Example charts:
-
Line charts
 line chart
Running a
timeseriesor usingmakeTimeseriescommand instantly displays a line chart with the resulting data. -
Bar charts
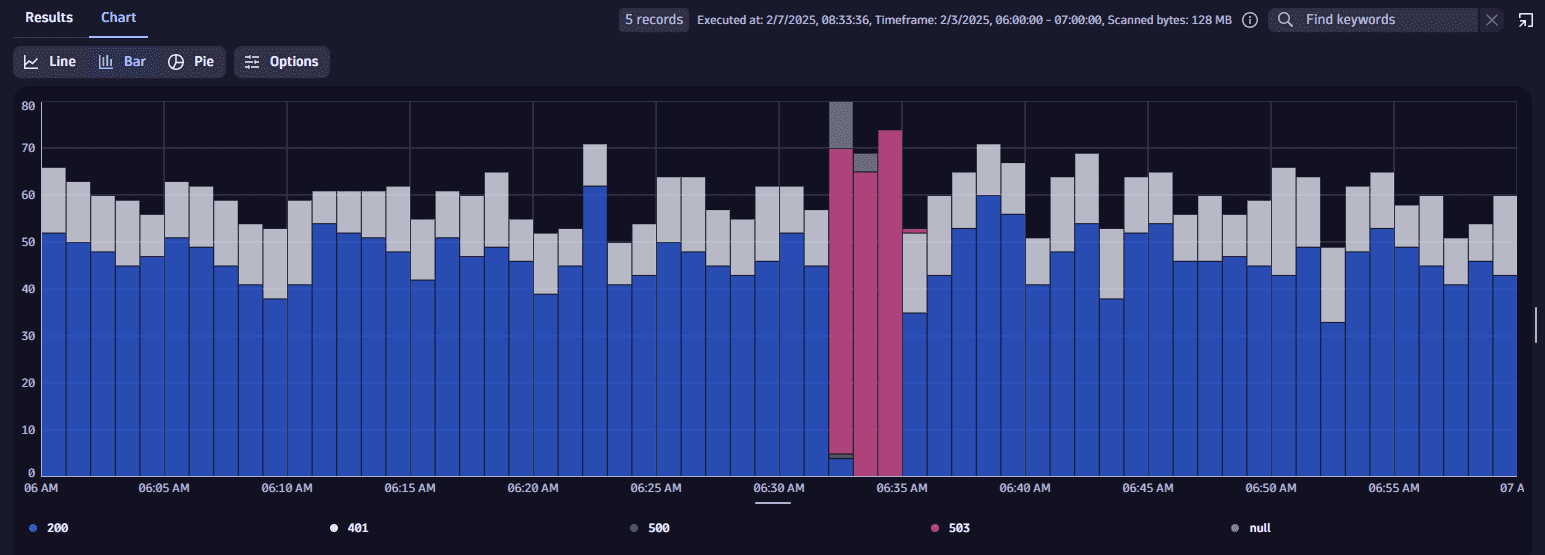 bar chart
 -
Pie charts
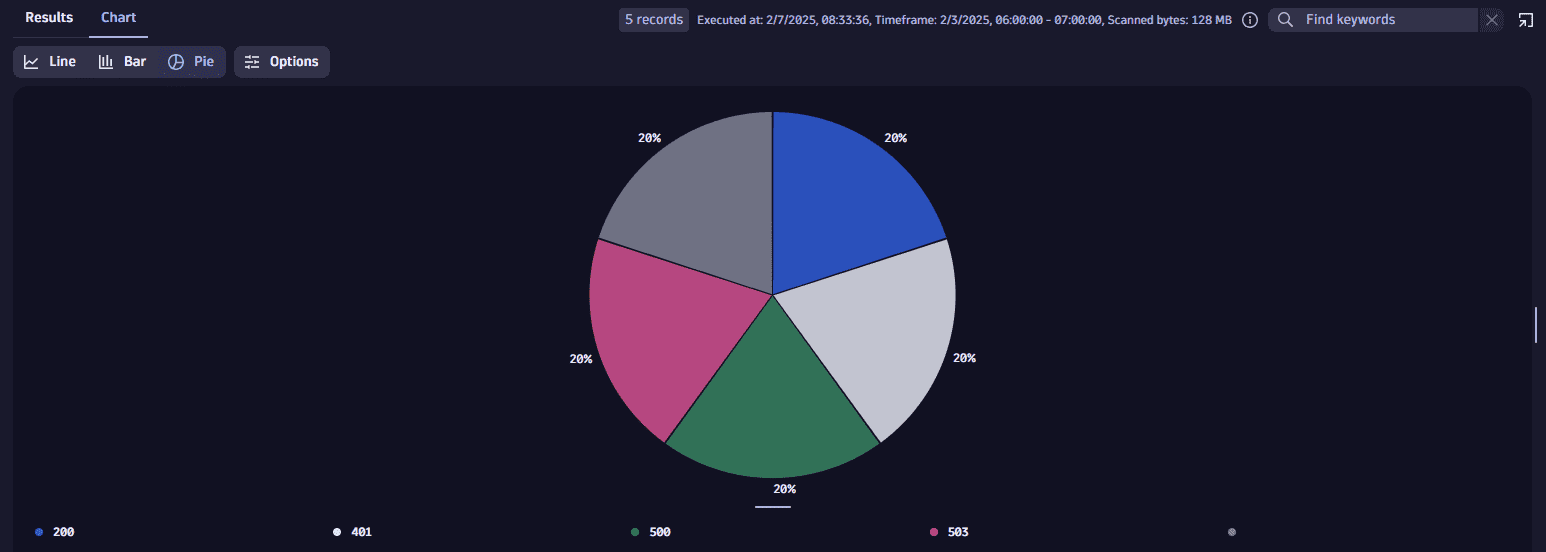 pie chart
You can configure the charts display in Chart > Options.