Services app
- Latest Dynatrace
- App
- 4-min read
Message Processing and Database Query Performance Analysis are projected to become available in Dynatrace SaaS version 1.330.
 Services delivers comprehensive visibility into your distributed services, enabling teams to quickly identify, investigate, and resolve issues across complex microservice architectures. This unified interface consolidates critical health signals and performance metrics to accelerate troubleshooting and optimize service reliability.
Prerequisites
- Your users should have the necessary permission to use
 Services.
  Services is installed in your environment.
- Dynatrace collects data on your services through OneAgent or OpenTelemetry.
Get started
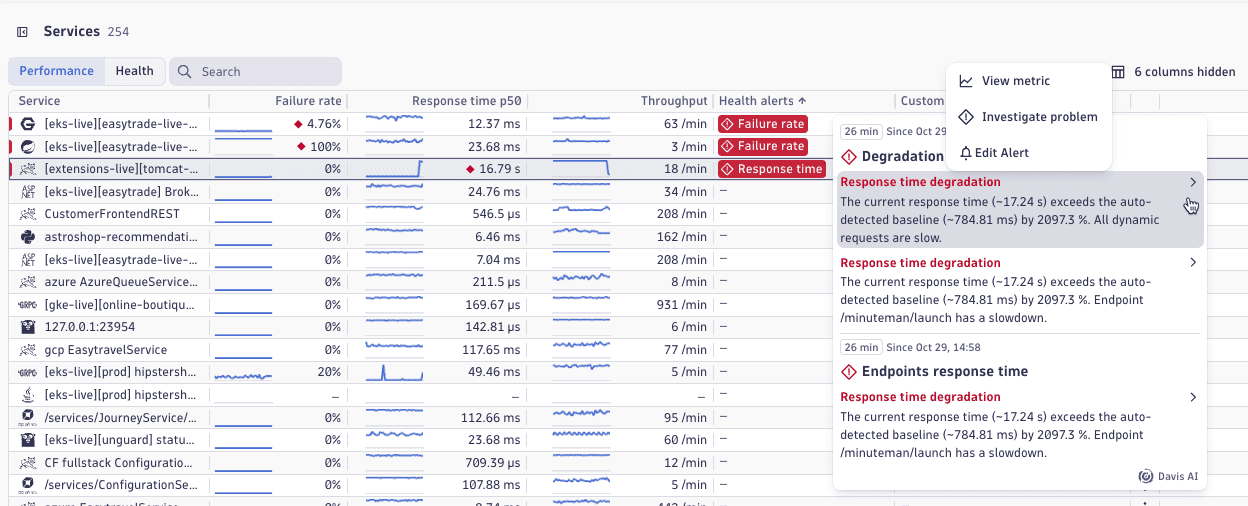
Service health overview
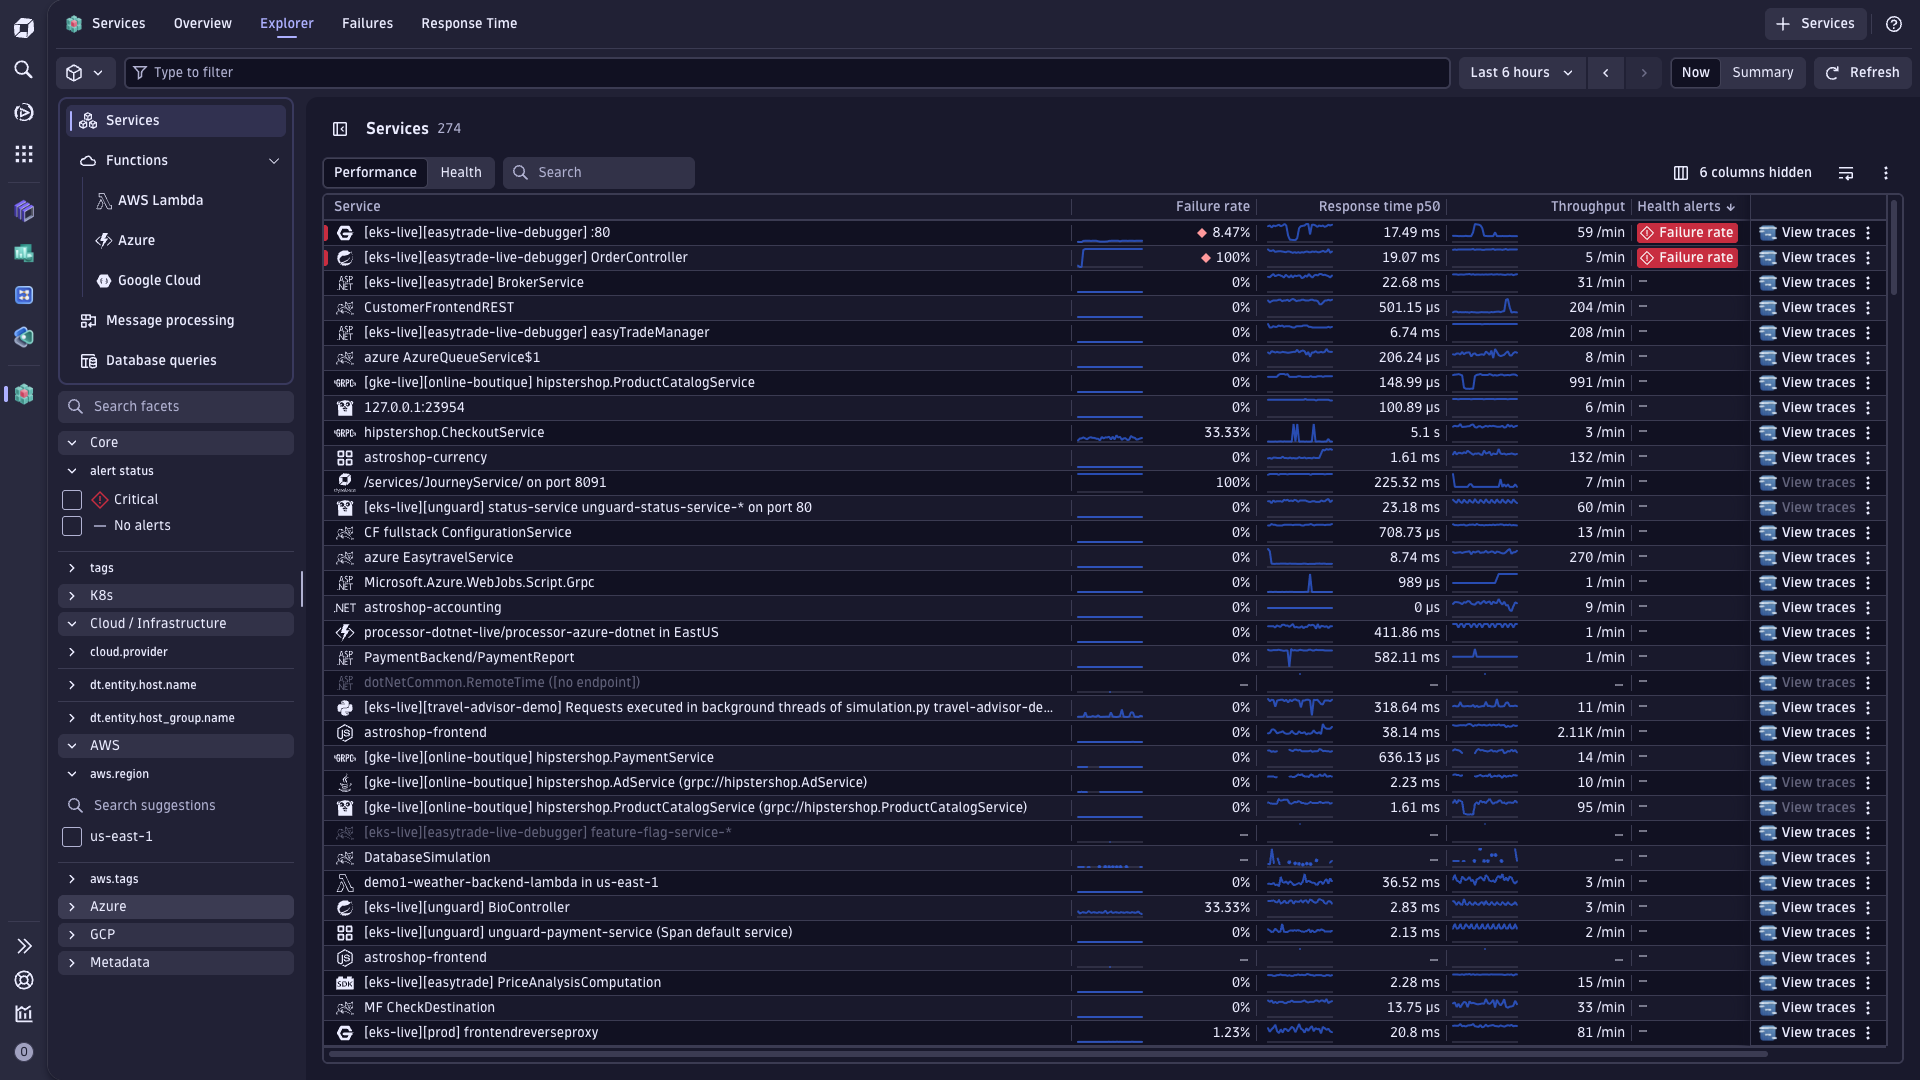
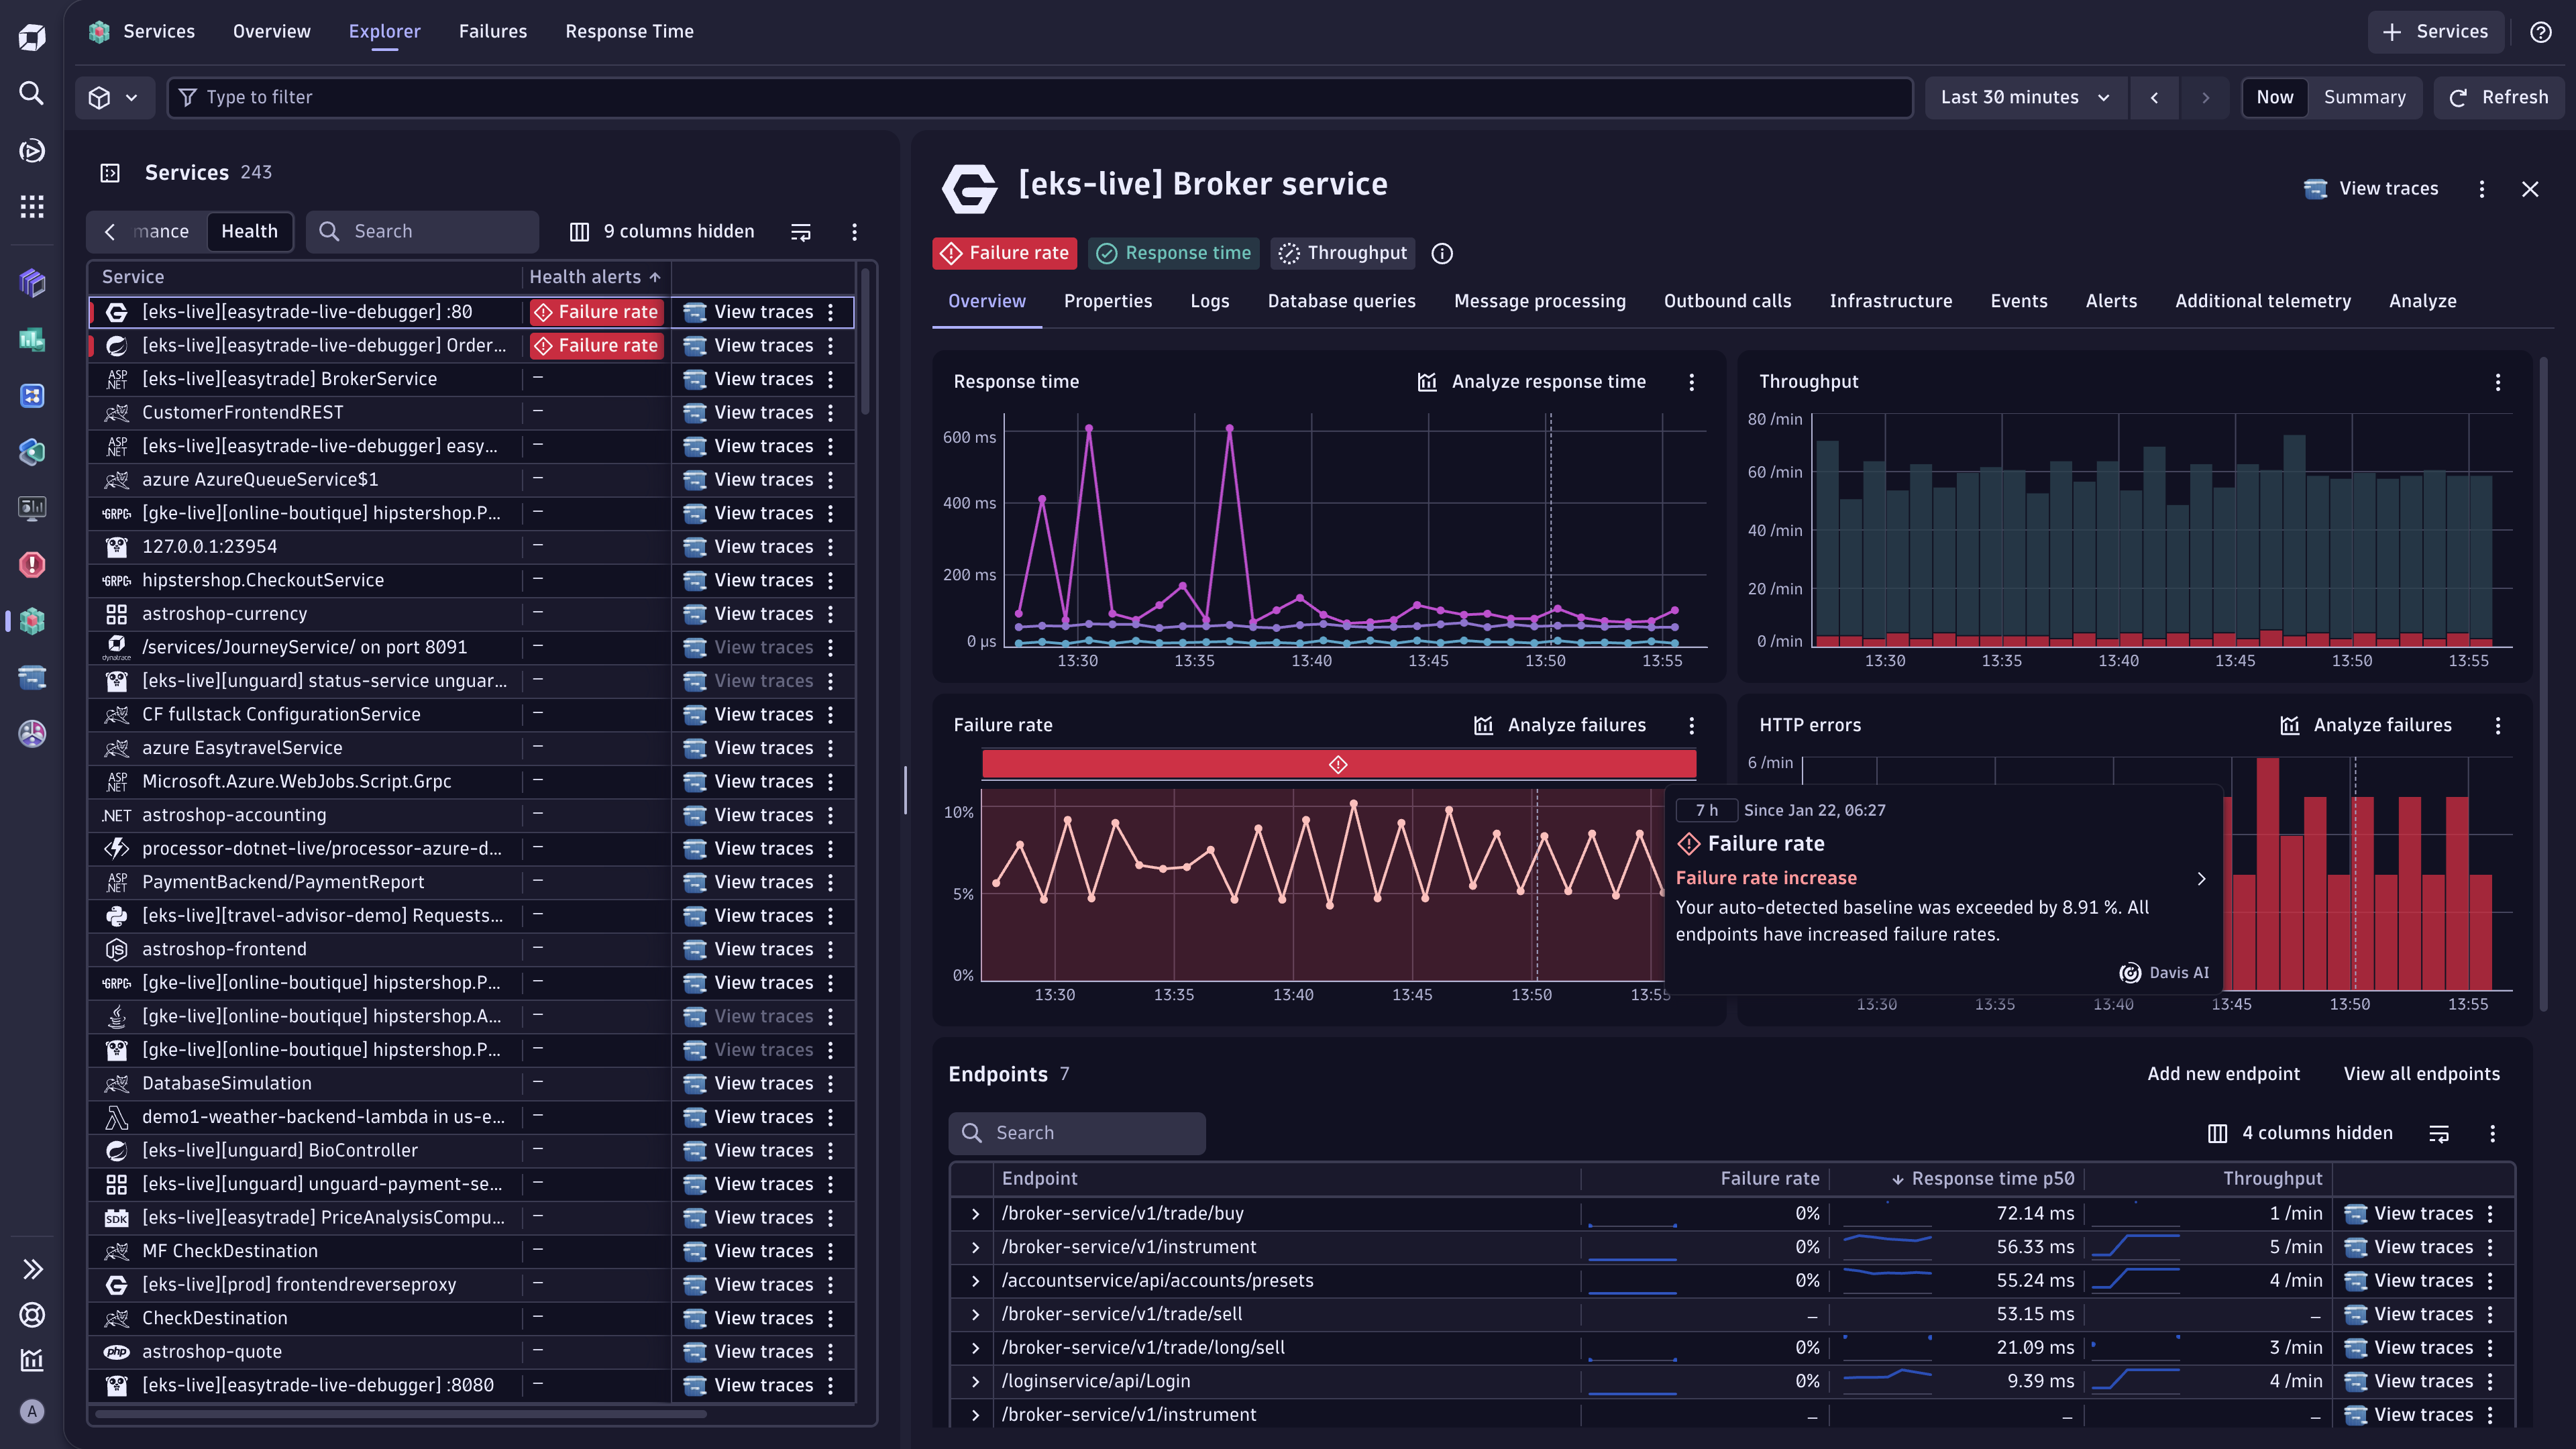
 Services provides an intelligent health dashboard that surfaces issues demanding immediate attention. You can filter alerts by severity and drill into specific services experiencing degradation. When a service enters a critical state, the app highlights failure rates and provides context around what triggered the alert—whether it's increased errors, latency spikes, or infrastructure problems.
Database queries
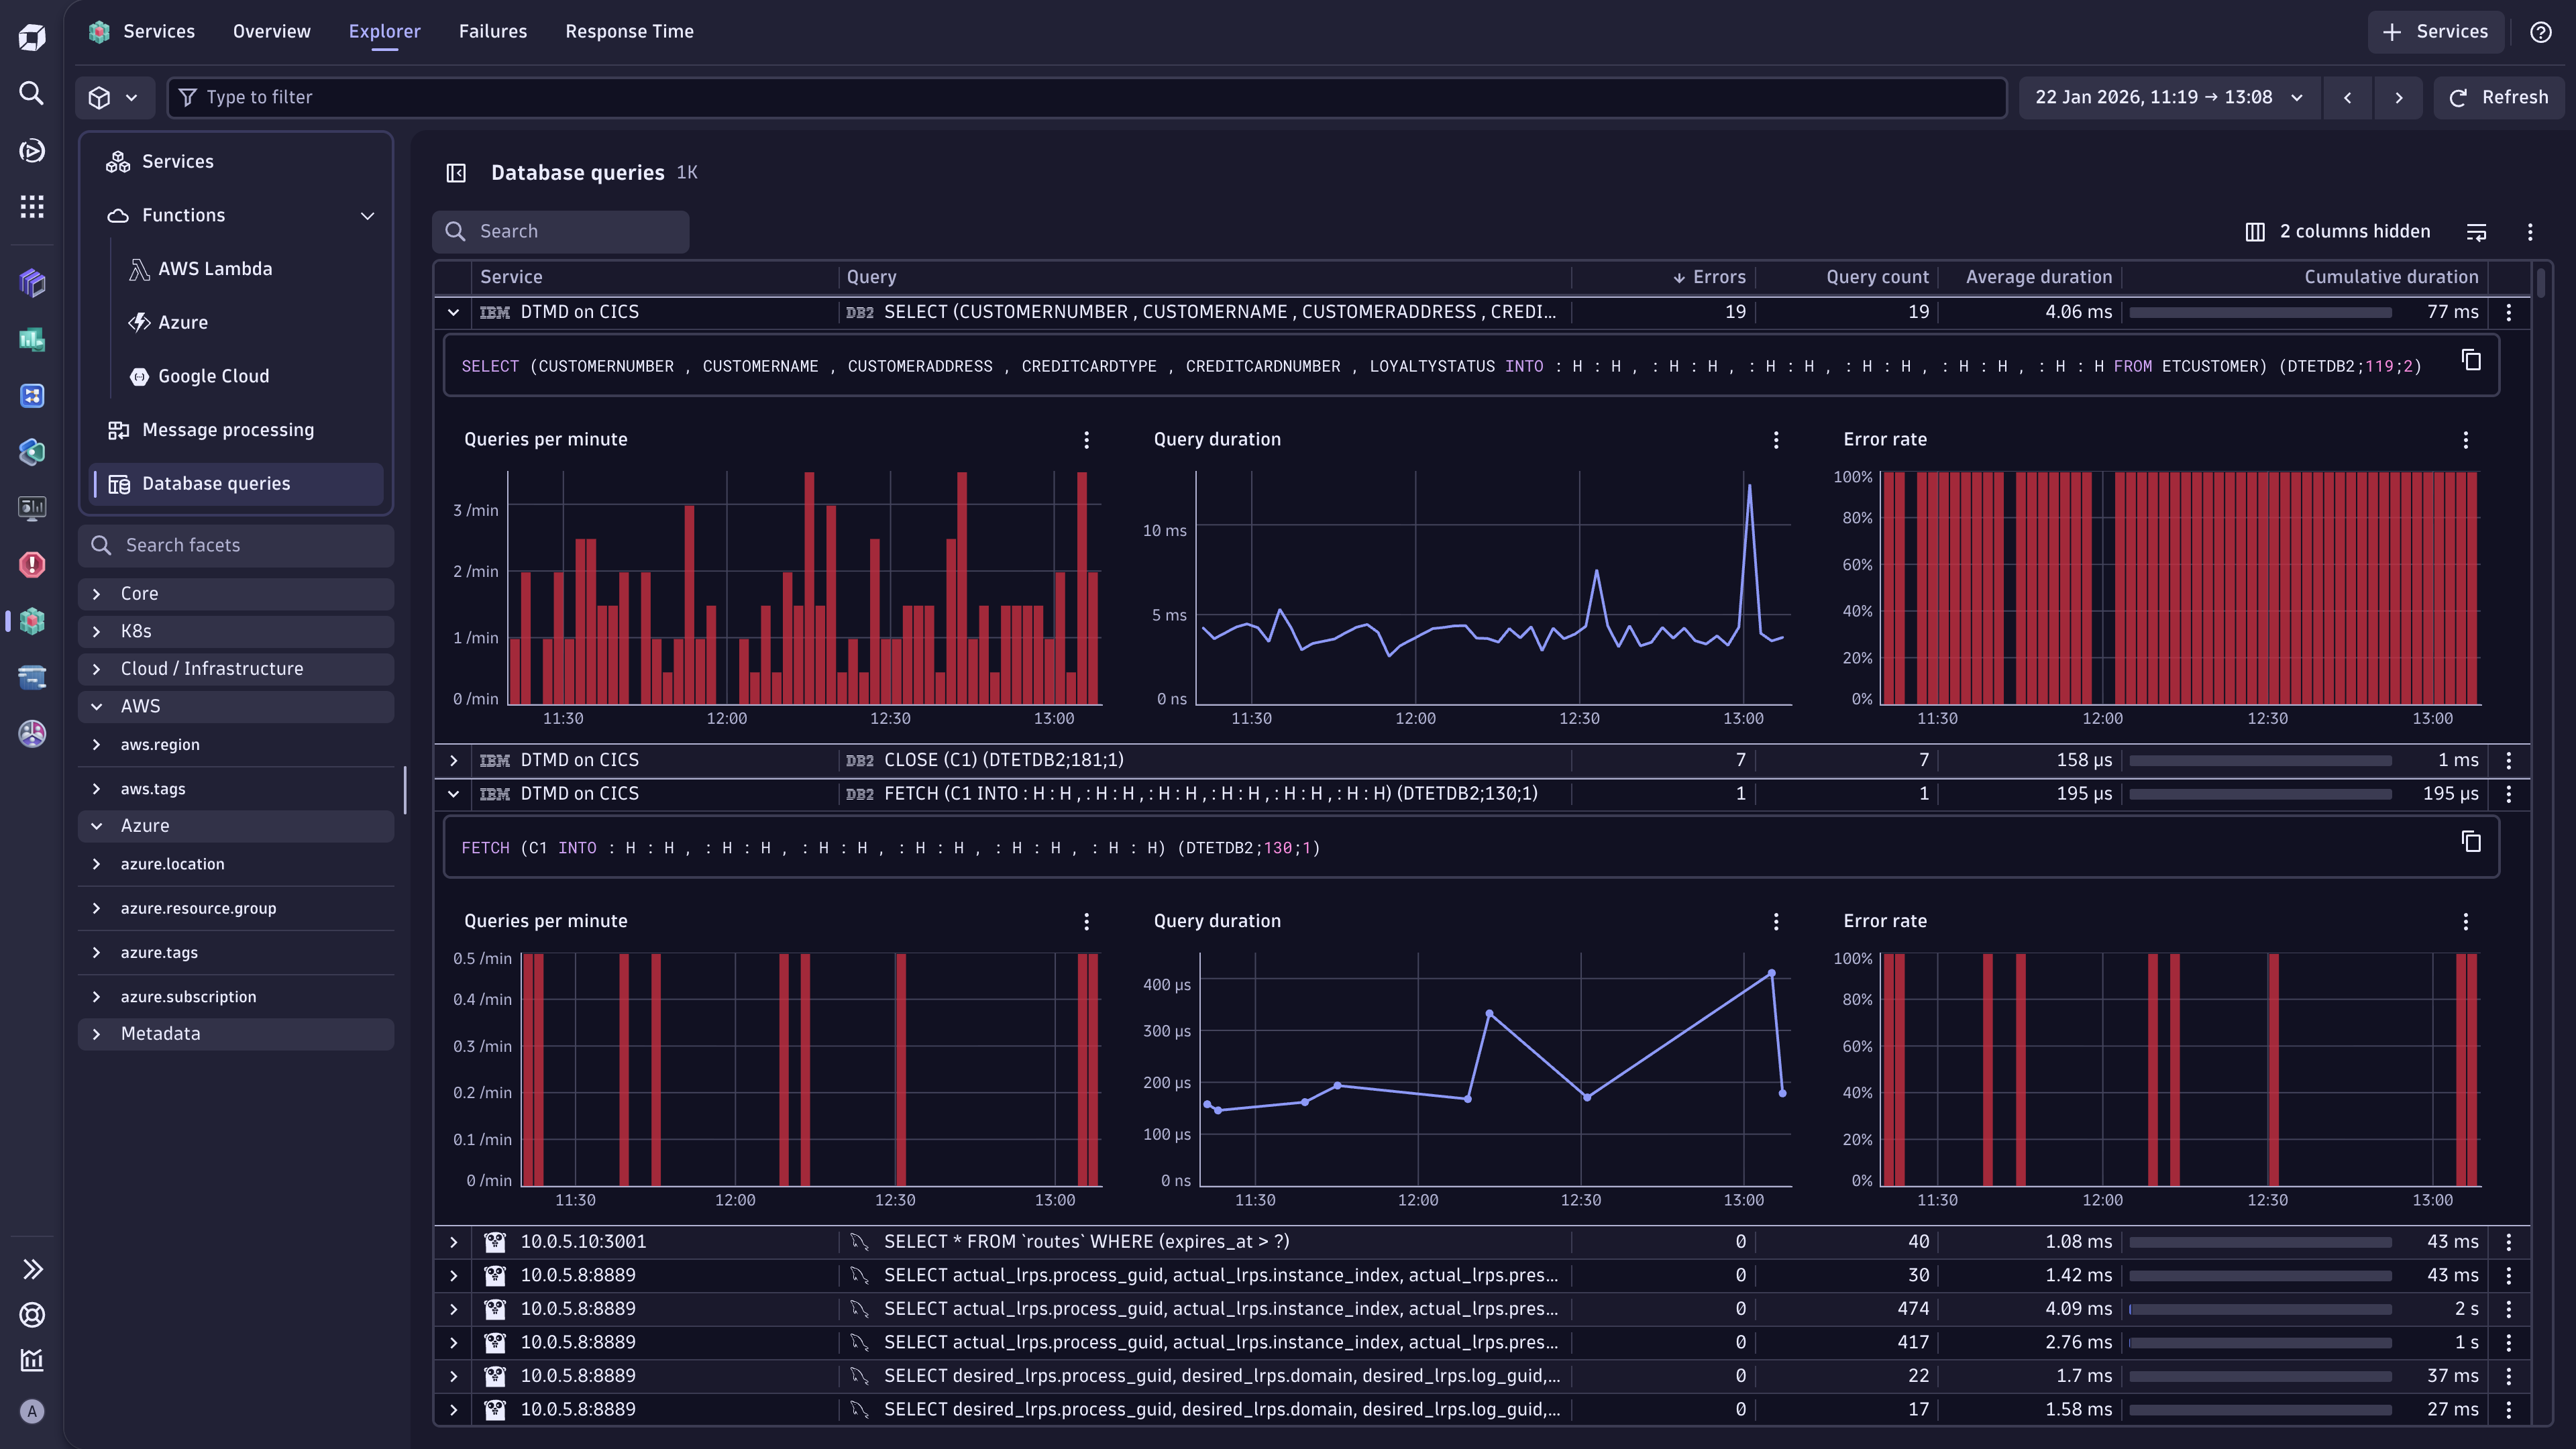
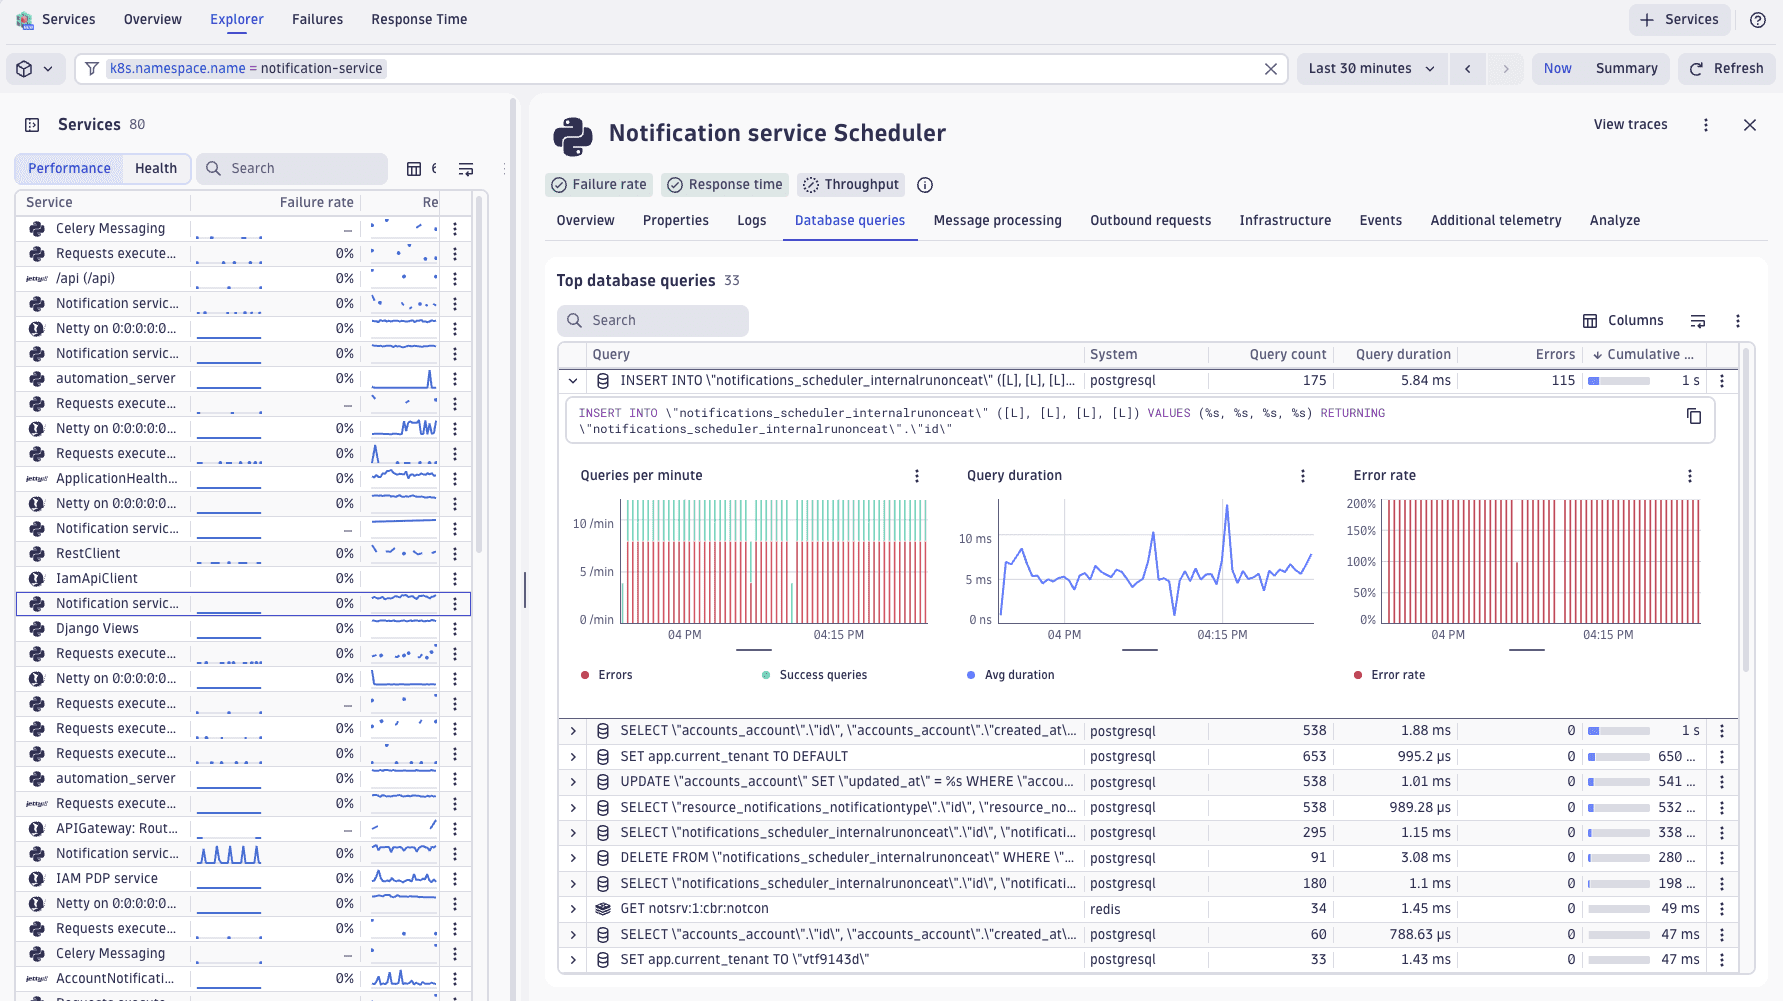
 Services captures and analyzes database queries executed by your services, presenting the slowest queries ranked by execution time and frequency.
To see what queries your service is executing and the response time, failure rate, and throughput of those queries
- In the Services table, select the service to go to the service details page.
- Switch to the Database queries tab.
- Discover which operations consume the most resources and where indexing or caching could improve performance.
- Eliminate blind spots by integrating infrastructure-layer database observability with service-level metrics.
Failure analysis and time-based comparisons
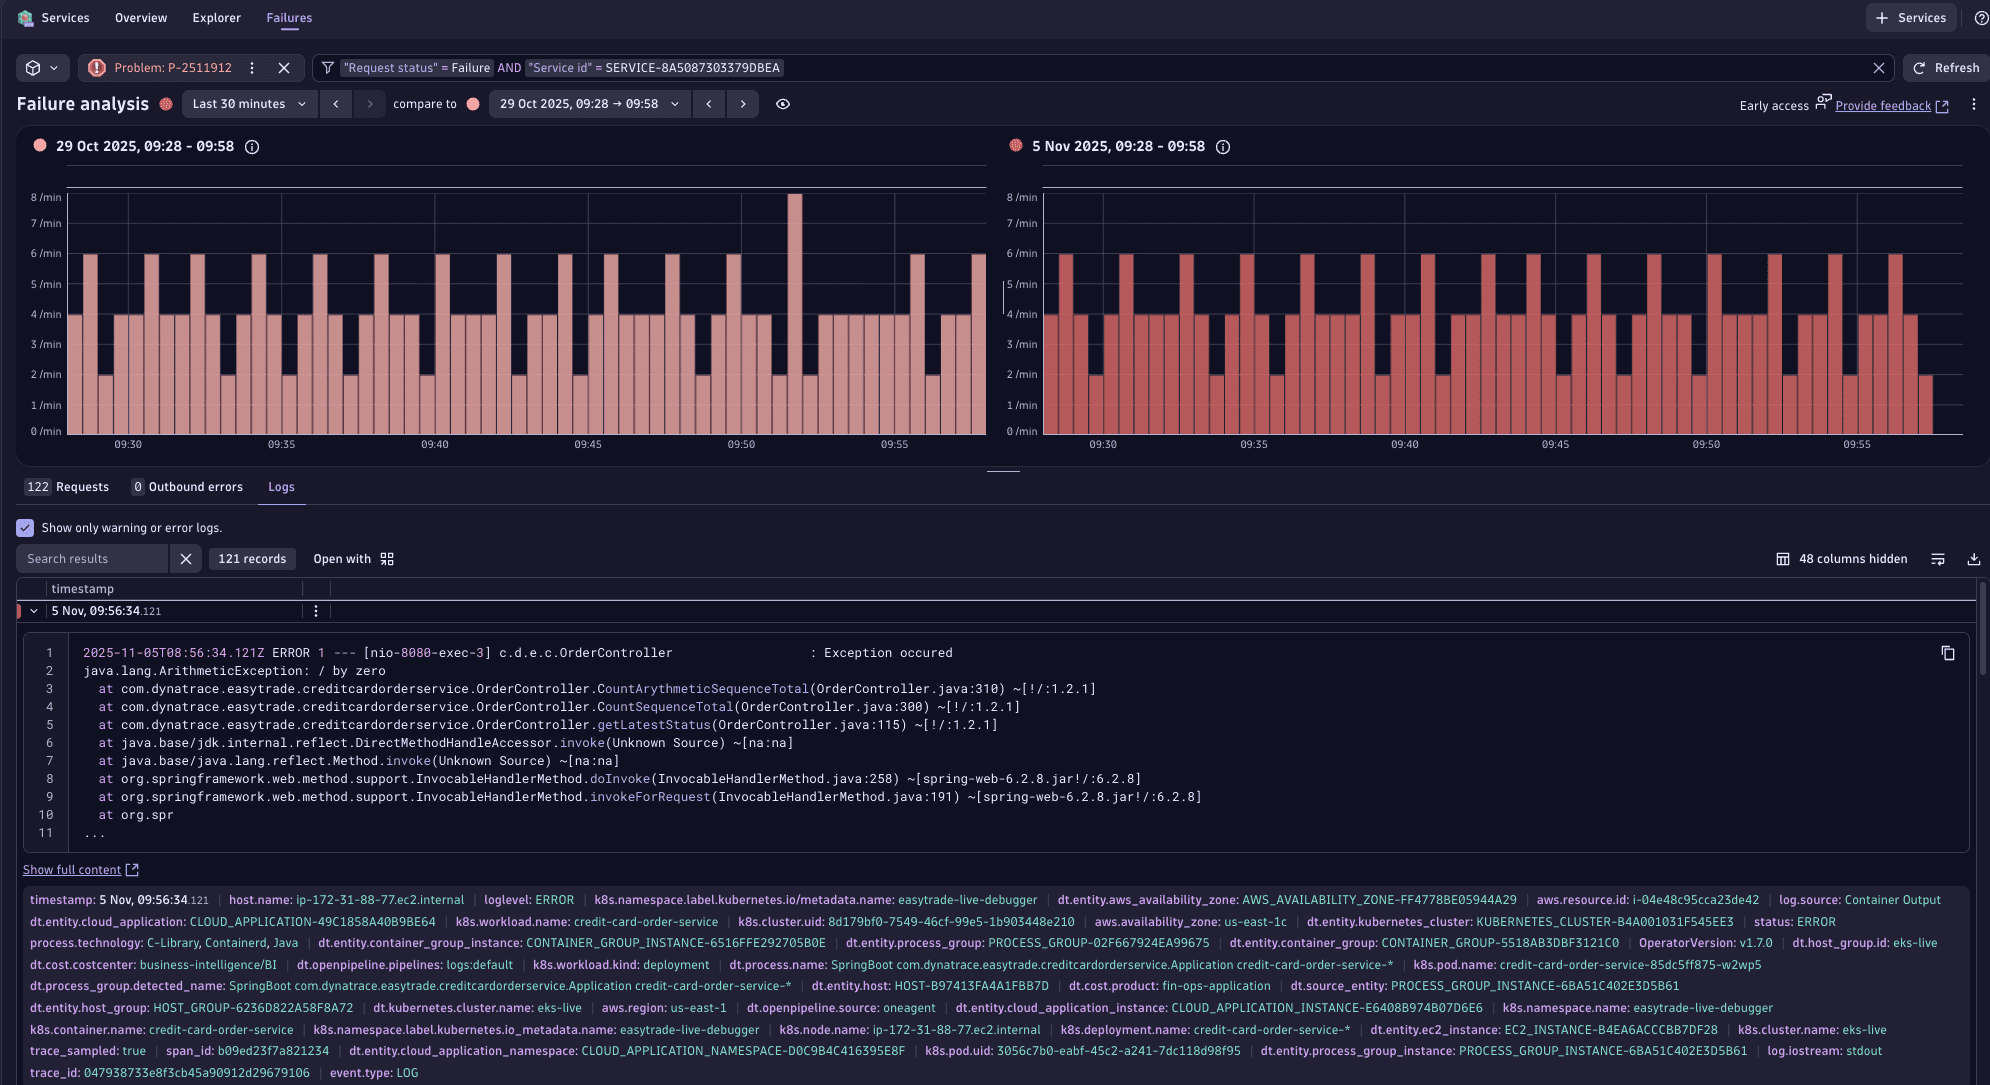
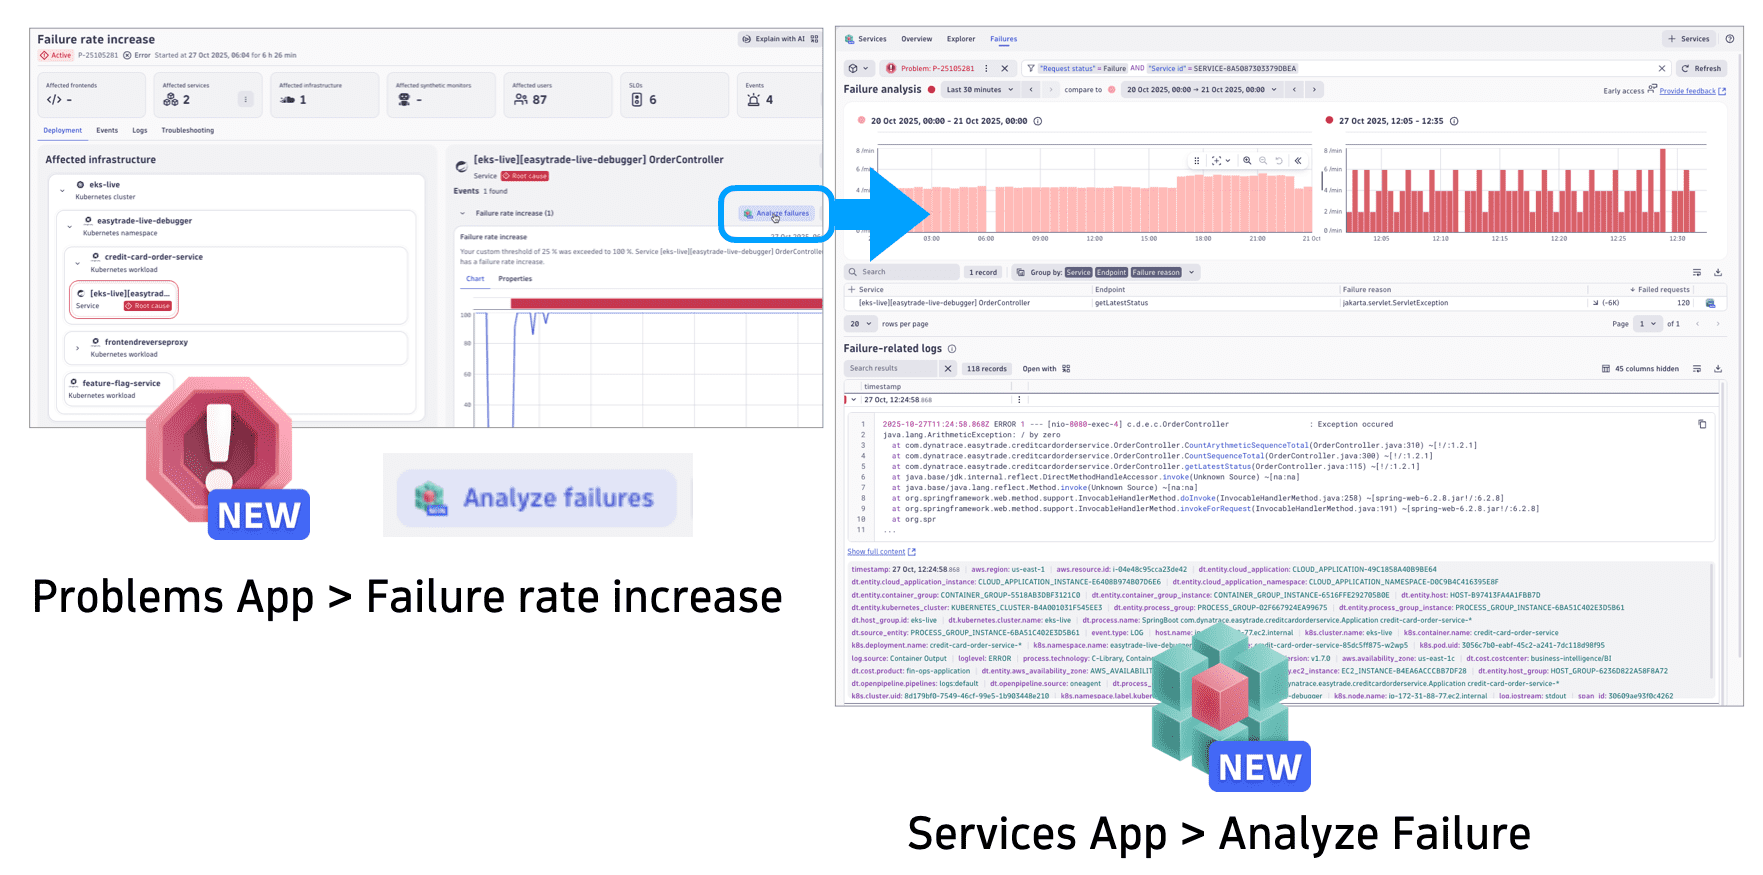
Overlay current failure patterns against baseline periods to immediately identify regressions. The visualization distinguishes between different failure types and severities, helping teams prioritize based on user impact.
Also, refer to the Failure Analysis use case.

 Problems maps the entire impact chain from an initial failure through dependent services, infrastructure, and affected users.
Navigating from  Problems to
  Services Failure Analysis takes a single click, allowing for seamless investigation from high-level problem detection to granular service-specific error details, including timeframe comparisons and logs.
Advanced filtering and release analysis
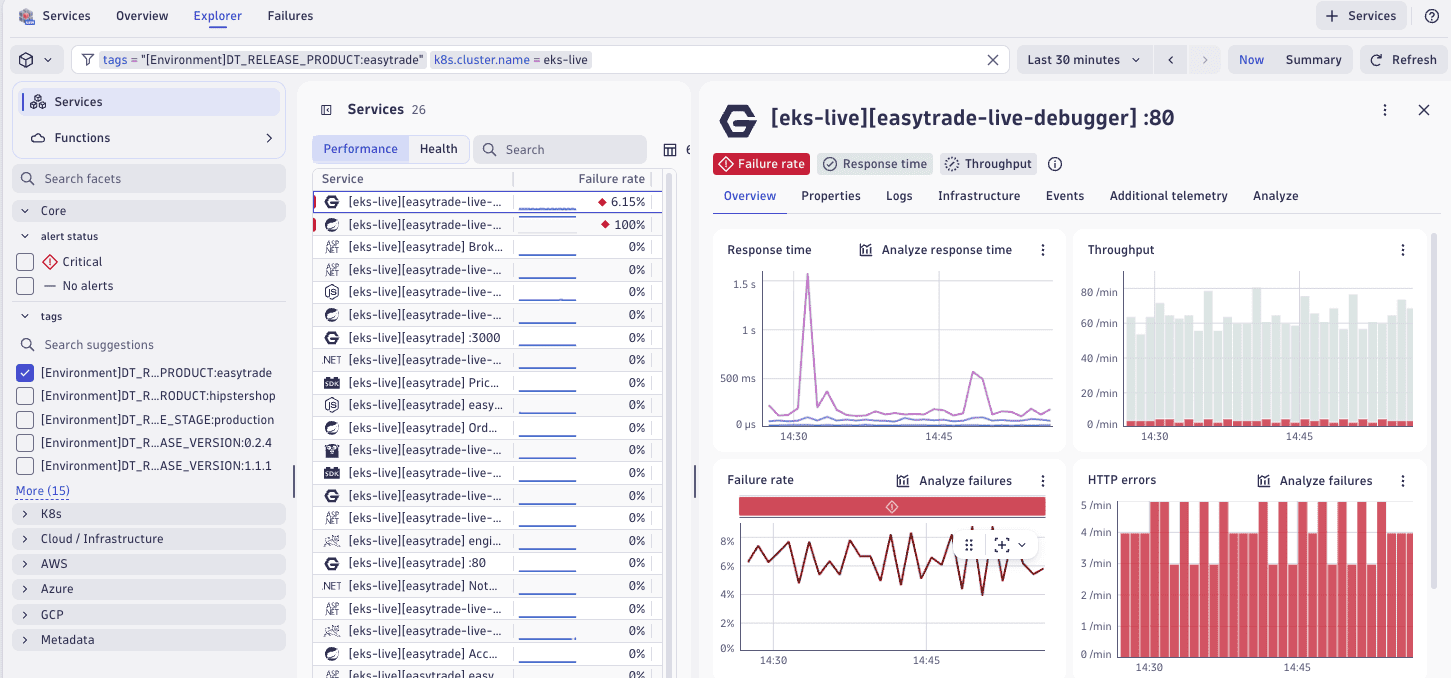
Filter service views across releases and dozens of facets, including Kubernetes namespaces and deployment dimensions. Compare behavior across staging and production to identify configuration drift or isolate environment-specific issues.
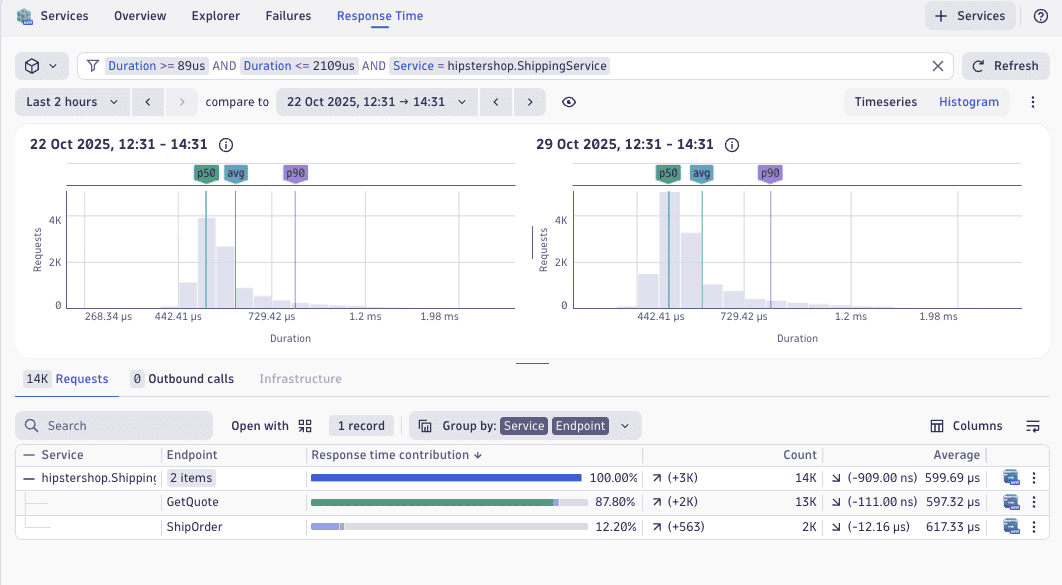
Response time analysis and comparison
Track response time to understand typical behavior versus worst-case scenarios. Analyze performance trends across different periods to identify exactly when a degradation began and what was the reason for it. Correlate latency changes with deployment events or traffic pattern shifts to quickly pinpoint the cause of performance regressions.
For details, see Response time analysis.
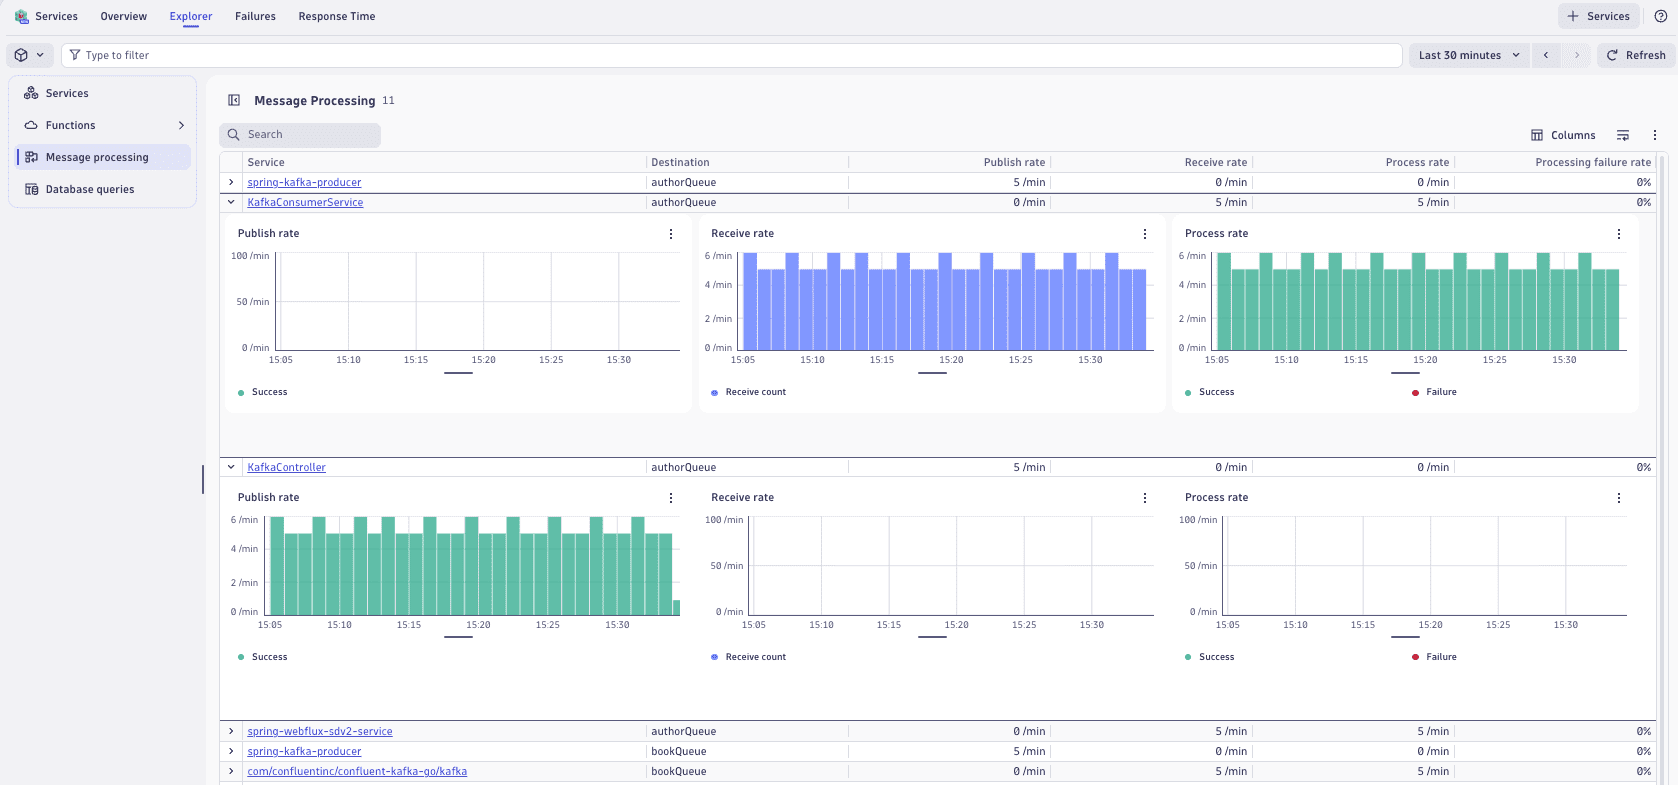
Message processing
Track message publish rates, receive rates, and processing throughput across your service topology. Identify bottlenecks in asynchronous workflows that traditional request-response monitoring misses.
Visualize processing failure rates to pinpoint services struggling with message consumption or transformation logic. Maintain visibility into batch jobs, event processors, and queue-based integrations operating outside critical user-facing paths.
Database query performance analysis
 Services captures and analyzes database queries executed by your services, presenting the slowest queries ranked by execution time and frequency. Discover which operations consume the most resources and where indexing or caching could improve performance. Eliminate blind spots by integrating infrastructure-layer database observability with service-level metrics.

Concepts
Service-related concepts, including distributed traces and spans, are central concepts in Dynatrace observability. Understanding these concepts enables effective monitoring and analysis of distributed systems. See Service-related concepts.
Tutorials

Explore in Dynatrace Hub
Maintain centralized control over service health, performance, and resources.

Try in Dynatrace Playground
Get a hands-on experience with  Services in our public sandbox environment, interacting with sample data without installing software.
Related topics
 Services