AI Observability for generative AI and LLM models with Dynatrace
- Latest Dynatrace
- Overview
- 4-min read
AI observability is the practice of collecting, analyzing, and correlating telemetry across your tech stack to understand how AI systems, agents, and LLMs behave in all environments including production. It enables real-time visibility into LLMs, AI agents, orchestration layers, and their downstream impact on your application and infrastructure.
AI observability delivers actionable insights that enable developers, SREs, and platform teams to debug, optimize, and improve AI-powered services, ensuring they stay reliable, performant, cost-efficient, and meet quality standards.
Full-stack observability for AI apps is especially critical when working with AI platforms like OpenAI, Anthropic, Gemini (Google Cloud), Amazon Bedrock, Azure AI Foundry, and Vertex AI, where model execution happens externally and opaquely, yet directly affects business-critical workflows.
Dynatrace end-to-end AI observability
Dynatrace unifies metrics, logs, traces, problem analytics, and root cause information in dashboards and notebooks, providing a single operational view of your AI-powered cloud applications end-to-end.
For OpenTelemetry-based ingestion, use OpenInference. You can also use OpenTelemetry with GenAI semantic conventions for direct instrumentation.
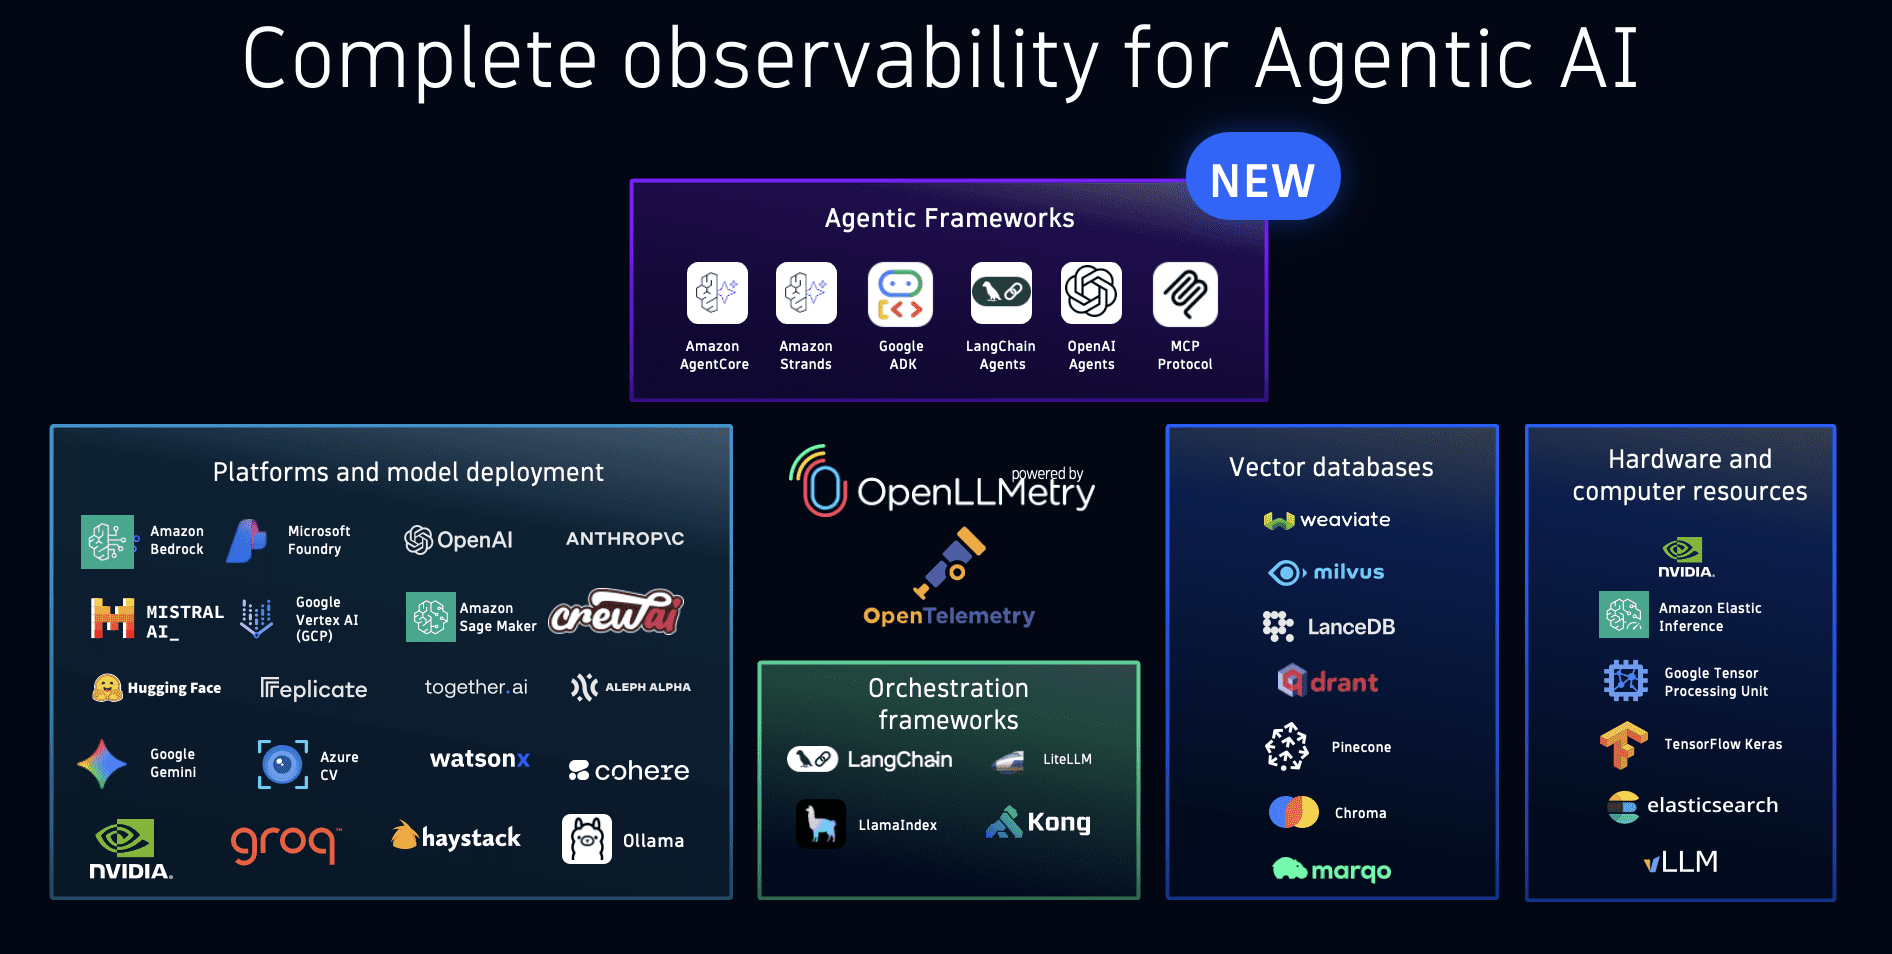
This approach covers the complete AI stack, from foundational models and vector databases to RAG orchestration frameworks, ensuring visibility across every layer of modern AI applications.
Key metrics for AI observability
- Stability: Frequency of successful model responses vs. failures.
- Latency: Time taken by models or services to return results.
- Load: Volume of requests handled; identify abnormal load spikes or drops.
- Model drift: Changes in model accuracy due to shifting input data.
- Data drift: Monitoring input data stationarity to anticipate model drift.
- Cost: Token usage, service fees, or overall resource consumption.
Observing AI models is inherently domain-driven: model owners must expose critical logs, metrics, and data to enable effective monitoring.
Dynatrace Platform capabilities
- Monitoring: Continuous collection and analysis of model metrics, events, logs.
- Logging: Captures relevant events and errors for debugging and post-mortem analysis.
- Metrics & Performance Analysis: Dashboards and notebooks for performance trends.
- Visualization: Domain-specific dashboards to quickly identify patterns and issues.
- Anomaly Detection: Automated alerts for deviations from normal patterns.
- Explainability & Interpretability: Techniques to illuminate a model's decision-making process.
Key use cases for AI observability
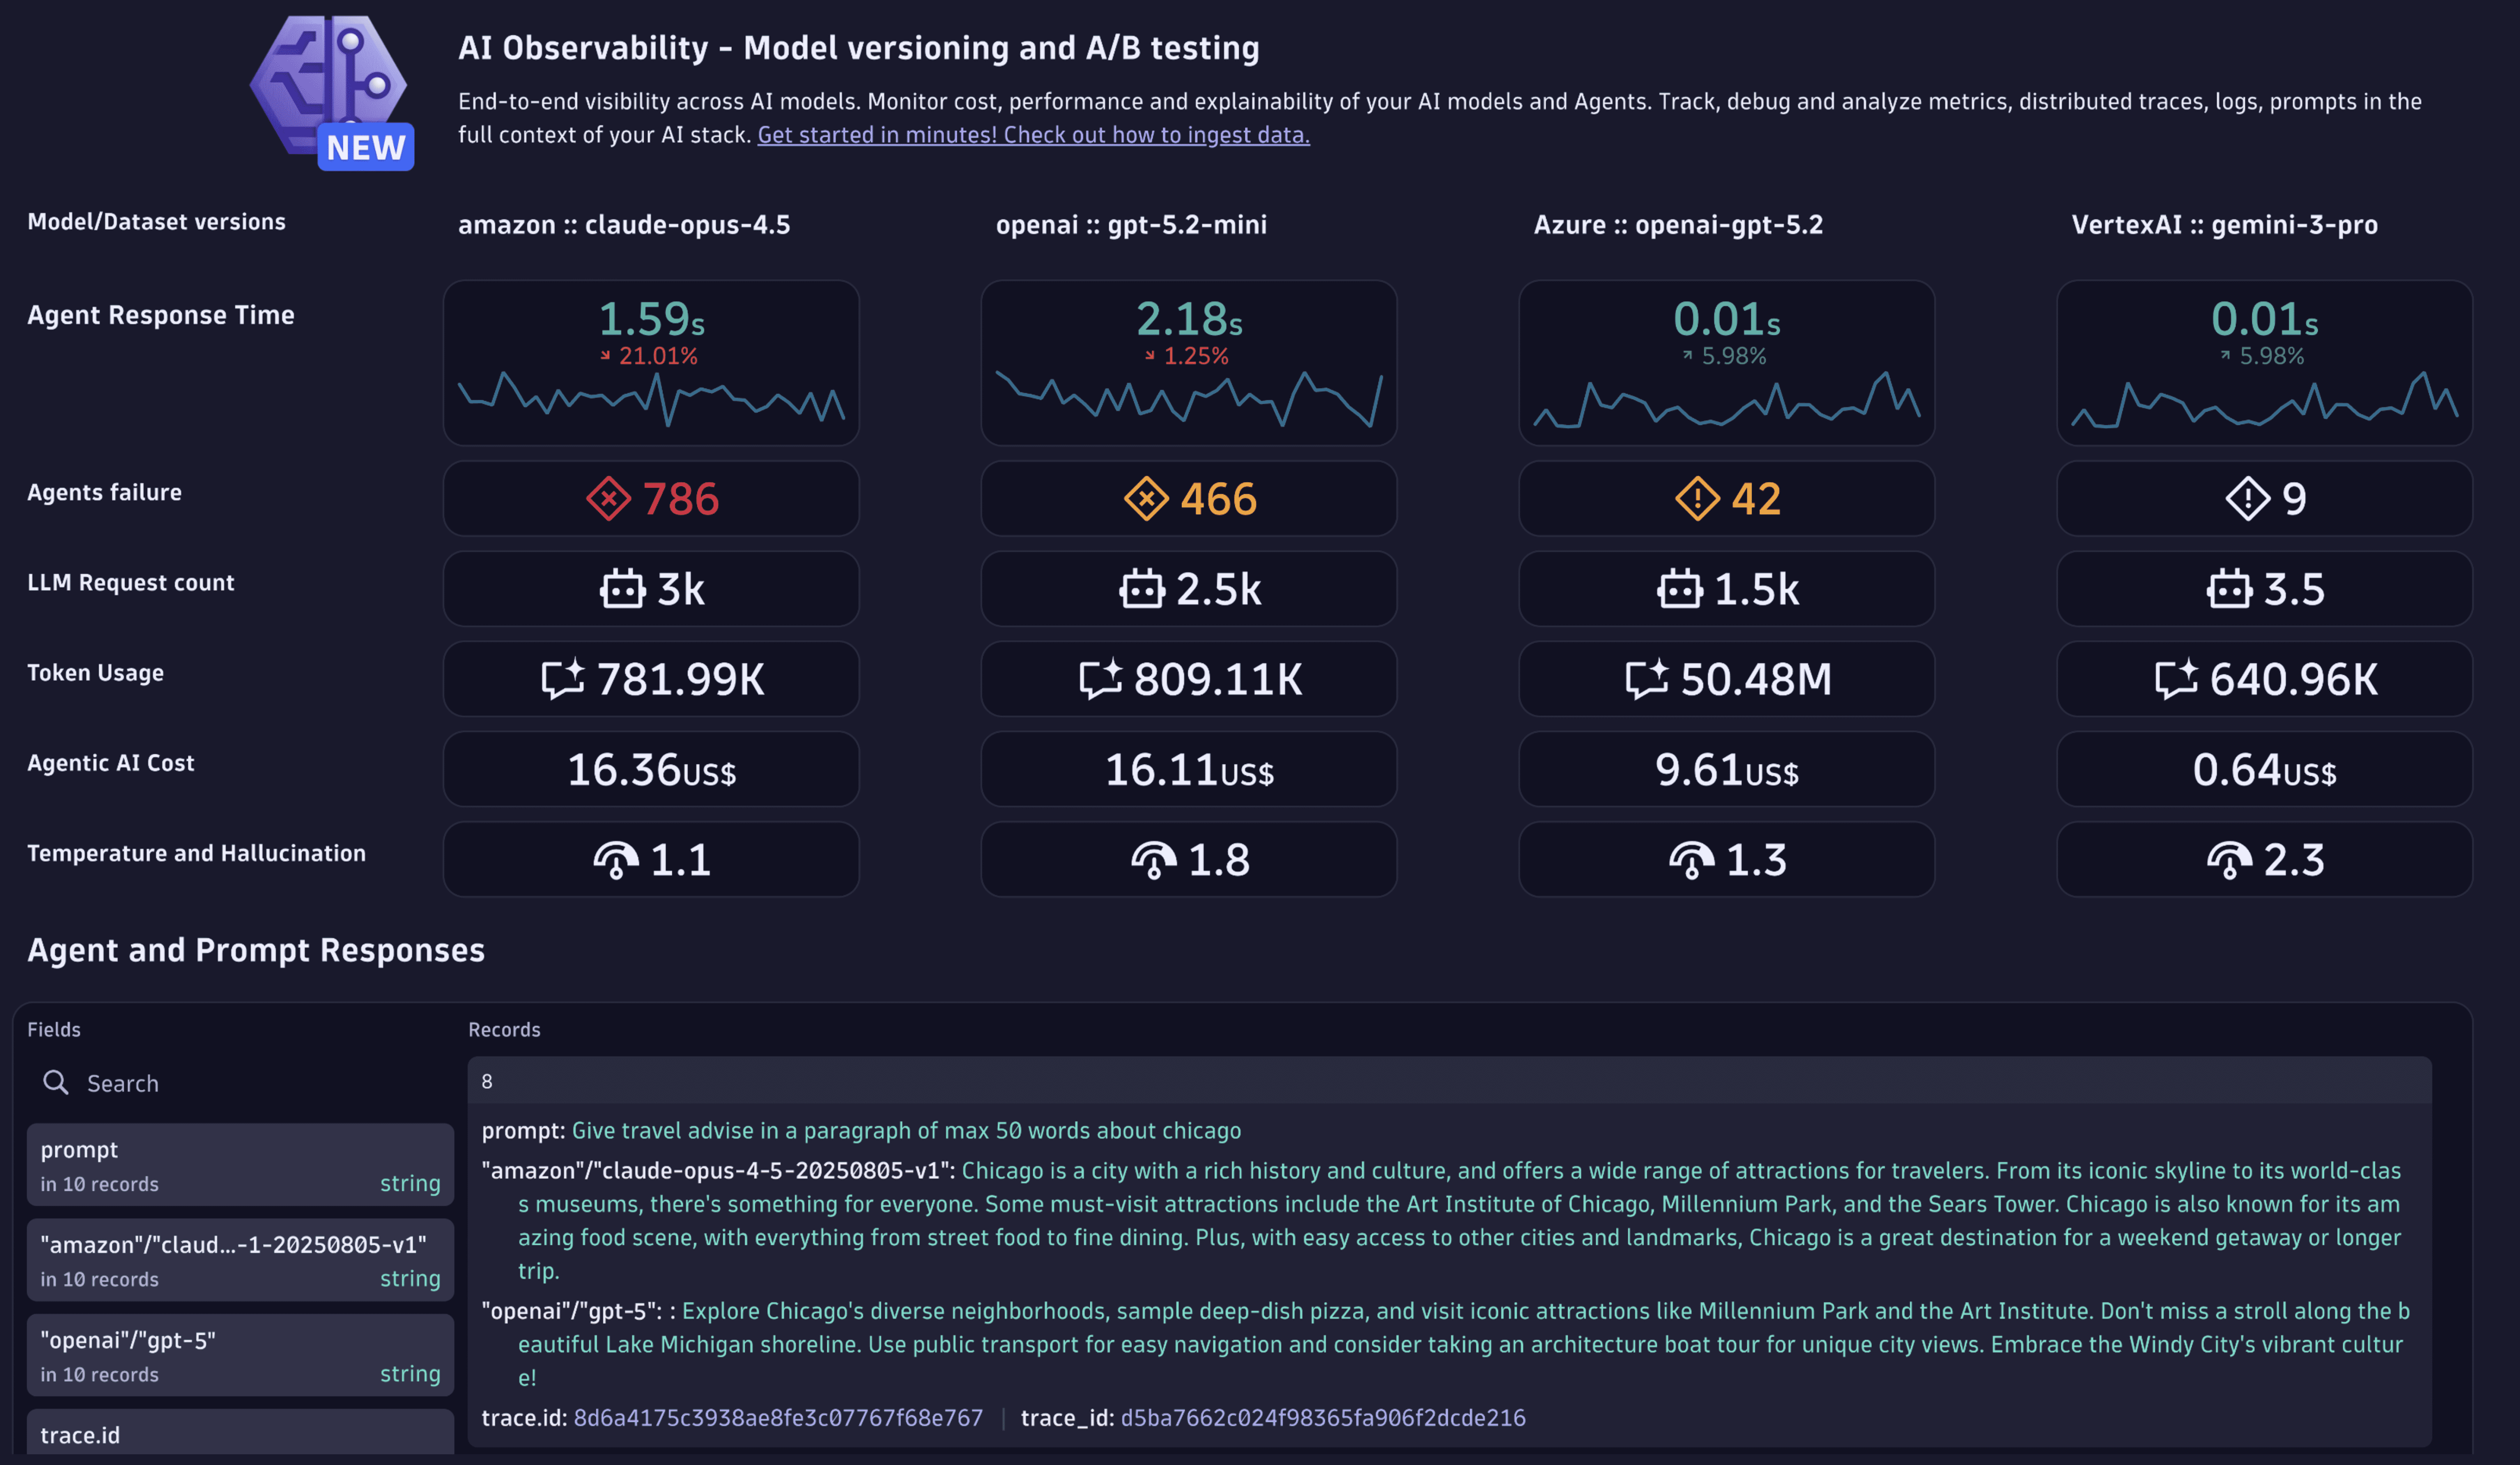
- Monitor service health and performance: Track real-time metrics (request counts, durations, and error rates). Stay aligned with SLOs.
- Monitor service quality and cost: Implement error budgets for performance and cost control. Validate model consumption and response times. Prevent quality degradation by monitoring models and usage patterns in real time.
- Evaluate response quality: Score the quality, safety, and relevance of GenAI and agent responses with online LLM-as-a-judge evaluations. Catch regressions on live production traffic and track score drift over time.
- End-to-end tracing and debugging: Trace prompt flows from initial request to final response for quick root cause analysis and troubleshooting. Gain granular visibility into LLM prompt latencies and model-level metrics. Pinpoint issues in prompts, tokens, or system integrations.
- Build trust, reduce compliance and audit risks: Track every input and output for an audit trail. Query all data in real time and store for future reference. Maintain full data lineage from prompt to response.
By embracing AI observability, organizations improve reliability, trustworthiness, and overall performance, leading to more robust and responsible AI deployments.
Observing Agents and Agentic workloads
Get visibility into Agentic AI workloads: agent execution paths, tool invocations, and inter-agent communication. Monitor and debug Agent interactions such as function calling, LLM calls, tool-use, RAG, and resolve performance, latency, cost, and reliability issues.
Dynatrace integrates with workloads such as OpenAI Agent SDK, LangChain/LangGraph Agents, CrewAI, Amazon Bedrock Agentcore, MCP tools, Google ADK, and many more.
Evaluating agent response quality
Run online, LLM-as-a-judge evaluations against production AI and agent traces and prompts already available in Dynatrace. Each evaluation score is written back as a business event and remains linked to its source trace, so you can investigate failures in their full runtime context.
View the results in the Evaluations tab of the AI Observability app, where you can monitor pass and fail rates, analyze individual evaluation results, and detect score drift over time.
To learn about evaluation concepts such as LLM-as-a-judge, see Terms and concepts about AI Observability and GenAI in Dynatrace. To configure and run evaluations end to end with the open-source dt-evals CLI, see Run LLM-as-a-judge evaluations with dt-evals.
dt-evals includes more than 10 built-in LLM judge evaluators for detecting issues such as:
- User frustration in incoming prompts
- Toxic, harmful, or unsafe responses
- Irrelevant or incomplete answers
- Hallucinations and unsupported claims
- Poor faithfulness to retrieved context
- PII leakage, prompt injection, and harmful bias
In addition to these judge evaluators, dt-evals runs statistical drift detection, comparing recent scores against a rolling baseline of earlier results to surface regressions over time.
Observing model providers and platforms
Dynatrace integrates with providers such as OpenAI, Amazon Bedrock, NVIDIA NIM, Ollama to monitor performance (token consumption, latency, availability, and errors) at scale.
Observing semantic caches and vector databases
Vector databases and semantic caches are central to RAG architectures. Dynatrace monitors solutions like Milvus, Weaviate, and Qdrant to help identify performance bottlenecks and usage anomalies.
Observing orchestration frameworks
Frameworks like LangChain manage data ingestion and prompt engineering for RAG applications. Dynatrace ensures you can track performance, versions, and degradation points in these pipelines.
Observing infrastructure and resources
Monitor infrastructure usage (GPU/TPU metrics, temperature, memory, etc.) for cloud services such as Amazon Elastic Inference and Google TPU, or custom hardware like NVIDIA GPU. This helps optimize resources and supports sustainability initiatives.
Browse the full, categorized list of supported technologies on the AI Observability integrations page, or explore the complete catalog on our Dynatrace Hub page.
AI observability provided by Dynatrace
Dynatrace, a software intelligence company, has implemented its own AI observability solution to monitor, analyze, and visualize the internal states, inputs, and outputs of its own AI models.
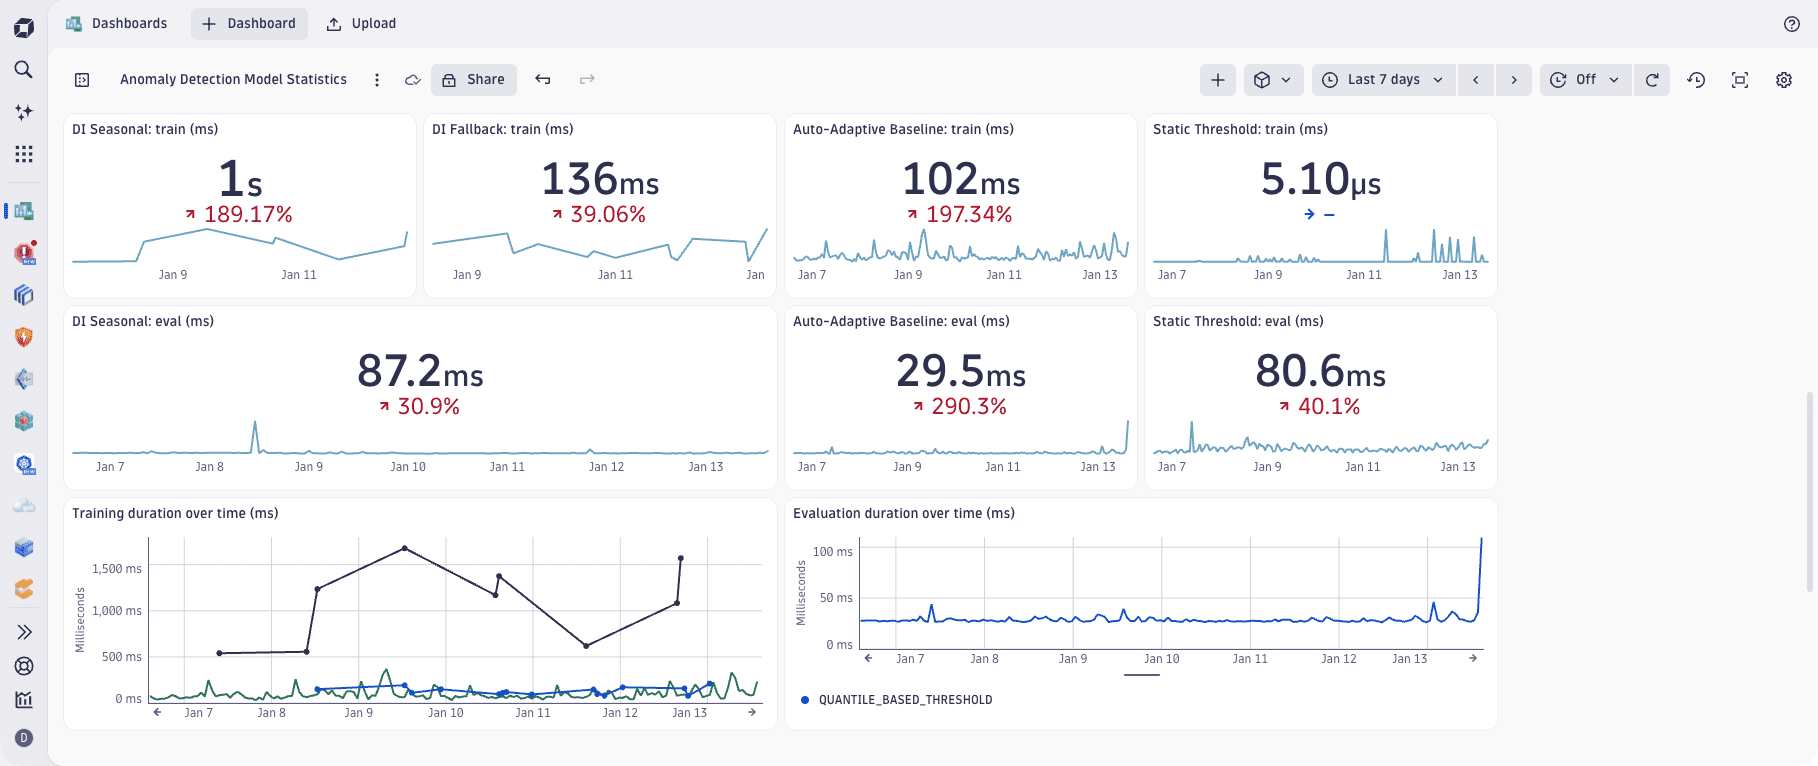
The example below shows one of many self-monitoring dashboards that Dynatrace data scientists use to observe the operation of Dynatrace Intelligence across all monitoring environments.