Auto-adaptive thresholds for anomaly detection
- Latest Dynatrace
- Explanation
- 3-min read
Auto-adaptive thresholds are a dynamic approach to baselining where the reference value for detecting anomalies changes over time. The main advantage over a static threshold is that the reference value dynamically adapts over time, and you don't have to know the threshold upfront. You also don't have to manually adapt multiple static thresholds for metrics whose behavior changes over time.
When an anomaly detection configuration includes multiple entities, each entity receives its own auto-adaptive threshold, and each threshold is evaluated independently. For example, if the scope of the configuration includes five hosts, Dynatrace calculates and evaluates five independent thresholds.
There's a limit of 100 metric event configurations per environment, regardless of how many individual thresholds each configuration has.
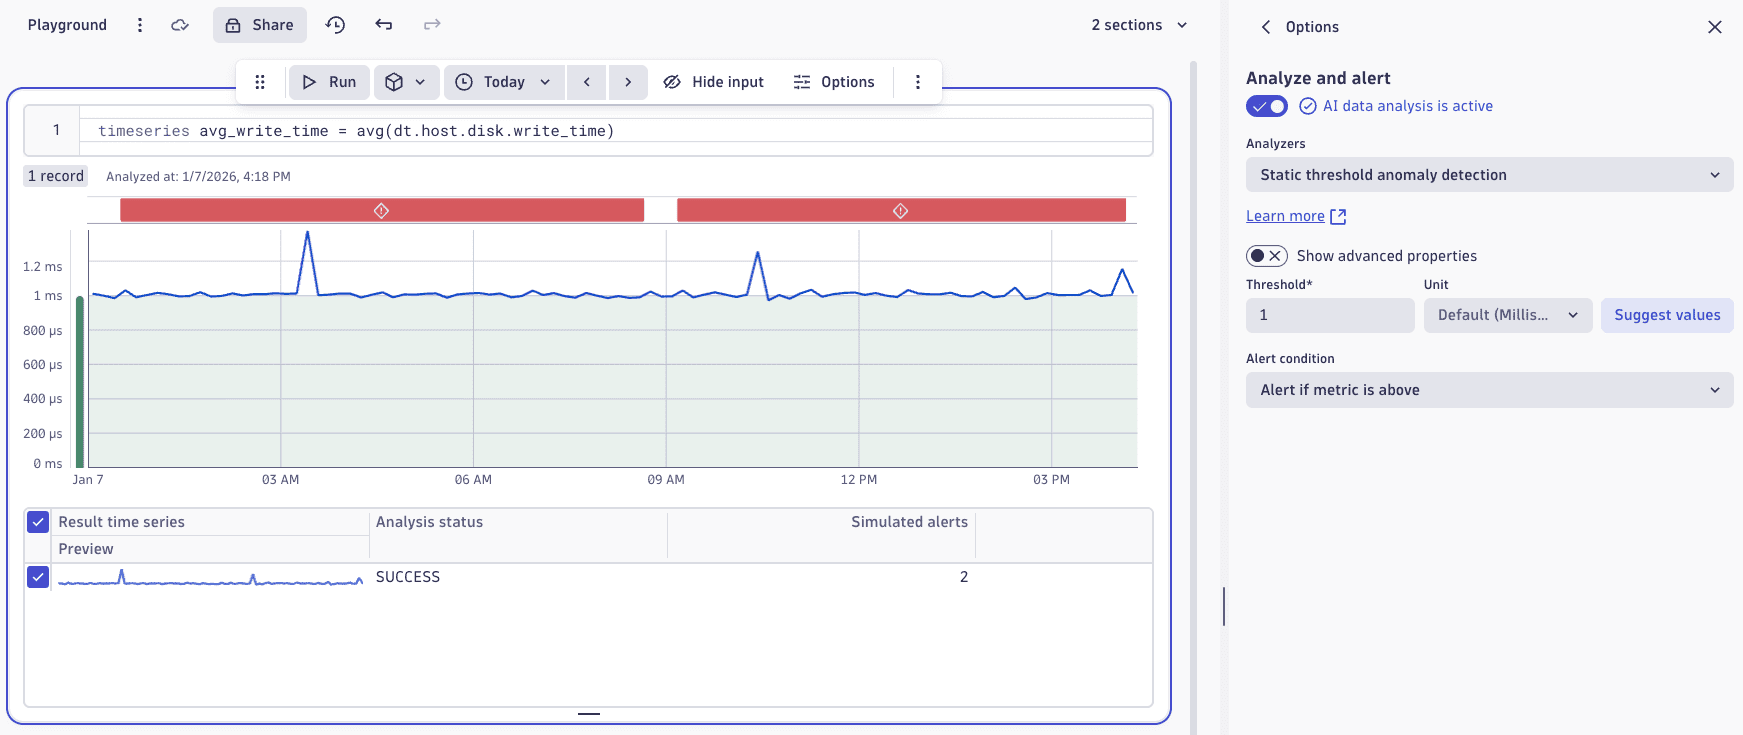
Auto-adaptive vs. static threshold
Let's look at an example where an adaptive threshold has an advantage over a statically defined threshold. The chart below shows a disk's measured write times in milliseconds. This is a volatile metric that spikes depending on the amount of write pressure the disk faces. If we were to define a threshold for each disk within this IT system based on the initial data (beginning of the chart), we'd set the static threshold at 20 milliseconds. However, the usage of the disk will later change to a higher load, so a static threshold thus defined will produce many false-positive alerts. To avoid this, we'd have to define a new threshold and manually adapt the configuration.
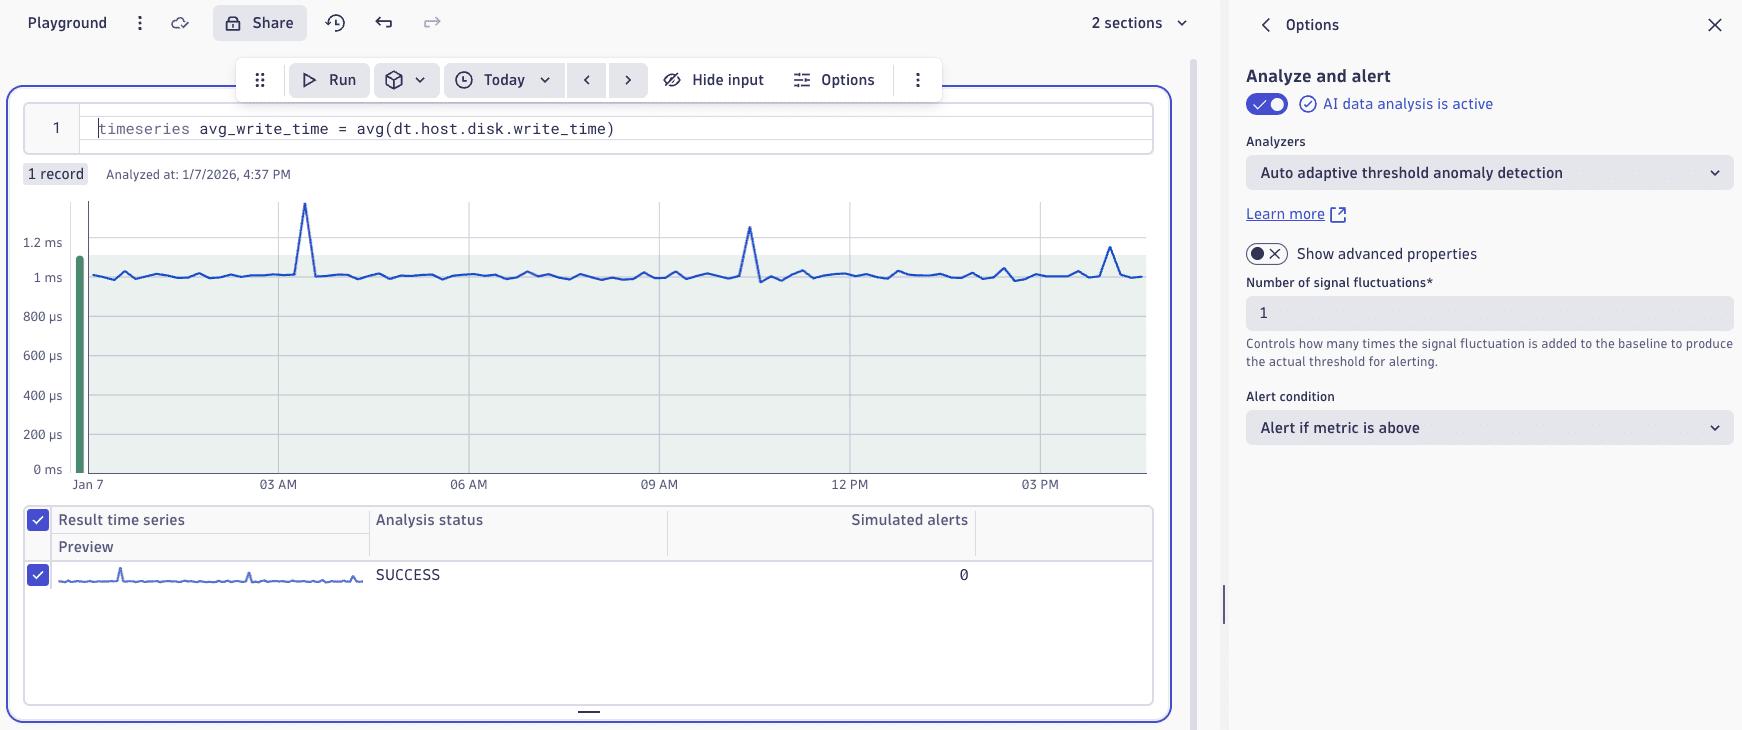
Auto-adaptive thresholds, however, automatically adapt reference thresholds daily based on the measurements of the previous seven days. If a metric changes its behavior, the threshold adapts automatically.
Threshold calculation
The reference values for threshold calculation are the metric data values over the last seven days.
- Measurements for each minute are used to calculate the 99th percentile of all the measurements. This determines the appropriate baseline.
- The interquartile range between the 25th and 75th percentiles is then used as the signal fluctuation, which can be added to the baseline. By using the
number of signal fluctuation(n × signal fluctuation) parameter, you can control how many times the signal fluctuation is added to the baseline to produce the actual threshold for alerting.
Another important parameter for dynamic thresholds is the sliding window that is used to compare current measurements against the calculated threshold. It defines how often the calculated threshold must be violated within a sliding window of time to raise an event (violations don't have to be successive). This approach helps to avoid alerting too aggressively on single violations. You can set the sliding window to a maximum of 60 minutes.
By default, any 3 minutes out of a sliding window of 5 minutes must violate your threshold to raise an event. That is, an event must have 3 violating minutes within any 5-minute sliding window.