Full-stack PHP monitoring
- Latest Dynatrace
- 4-min read
You can monitor PHP on your Windows (IIS/Apache) environments—full-stack monitoring is now available on Windows for Apache mod_php applications and PHP CGI.
Enabling PHP monitoring
To enable PHP monitoring in Dynatrace
- Go to Settings and select Monitoring > Monitored technologies.
- On the Supported technologies tab, find PHP and open it for editing.
- Enable the settings you need for your monitoring:
-
Monitor PHP on every host
This switch enables PHP monitoring on all hosts. To monitor a subset of your hosts, turn this switch off and then enable PHP monitoring on selected hosts. -
Enable FastCGI PHP processes launched by Apache HTTP Server on every host
This setting is permanently enabled starting with OneAgent version 1.191. -
Enable PHP x monitoring on every host
If an Early Adopter release is available, this switch is where you can choose to try it.Verify that your monitoring environment meets the requirements stated under the switch.
-
Running PHP on a web server
The most common ways to run PHP on a web server are:
mod_PHP—The default on vanilla Apache HTTP servers. PHP is run as an Apache module, meaning that a PHP request is run under the Apache process. This makes PHP perform well, but flexibility is limited by the Apache configuration, permissions, restrictions, etc.PHP_FPM—FastCGI Process Manager (FPM) uses pool management to optimize performance. Every pool acts as a standalone PHP instance, enabling you to create an independent configuration per pool, which provides granular control and greater flexibility. This is the fastest-performing method to run PHP.
Monitoring PHP-CLI
Early Adopter
PHP-CLI monitoring enables deep monitoring for your PHP-CLI applications. This provides you with database visibility, threading support, outgoing calls monitoring, and more, so you can:
- Analyze the performance of your PHP-CLI application
- Easily locate bottlenecks in your code
- See why communication with the database takes as long as it does
- Find out whether the application manages memory properly
Full code-level visibility into your PHP-CLI application
With PHP-CLI monitoring, you get:
- Thread-safe and non-thread-safe driven PHP-CLI support for all Dynatrace-supported PHP versions
- All existing OneAgent PHP features and CLI-only features:
pthreadssupport for PHP-CLI thread-safe- Method hotspots using ambient sampling
- Request attributes support
- Deep monitoring (after enabling custom service detection)
Requirements for PHP-CLI monitoring
- OneAgent version 1.181+ installed on all monitored hosts
- PHP NG monitoring enabled
To check or change this setting- Go to Settings and select Monitoring > Monitored technologies.
- Find PHP and open it for editing.
Limitations of PHP-CLI monitoring
- Injection of OneAgent causes slight overhead on process startup. It should not be enabled for short-living processes.
- Instrumentation of
php-cliprocesses with code specified as a command-line argument is not supported. - Instrumentation of
pthreadsis supported from PHP 7.2 to PHP 7.3. Earlier PHP releases are not fully thread-safe and should not be used withpthreads.
Getting started with PHP-CLI monitoring
To enable deep monitoring of your PHP-CLI applications
-
Go to Settings and select Processes and containers > Custom process monitoring rules.
-
Select Add custom rule to start defining a process monitoring rule for PHP-CLI.
You can build a rule based on conditions such as:EXE nameEXE pathPHP scriptPHP working directory
To learn more about process monitoring rules, see:
-
Select Save changes. Your rule is listed on the Custom process monitoring rules page.
-
Add more rules as needed.
-
Restart your PHP application.
Making PHP-CLI monitoring work for you
Gain full PHP insights into database connections and more
On enabling custom service detection, you get deep monitoring, including full PHP insights into database connections, external calls, and pthreads.

You can also observe distributed traces when the application forks with the Swoole framework.
To learn more about custom service detection for PHP, see blog post Introducing custom service detection for PHP.
See whether your application manages memory properly
With the garbage collection and OPcache metrics, you have visibility into how your application manages memory. You also get detailed process metrics, including CPU usage, memory usage, worker processes, and I/O information out-of-the-box.
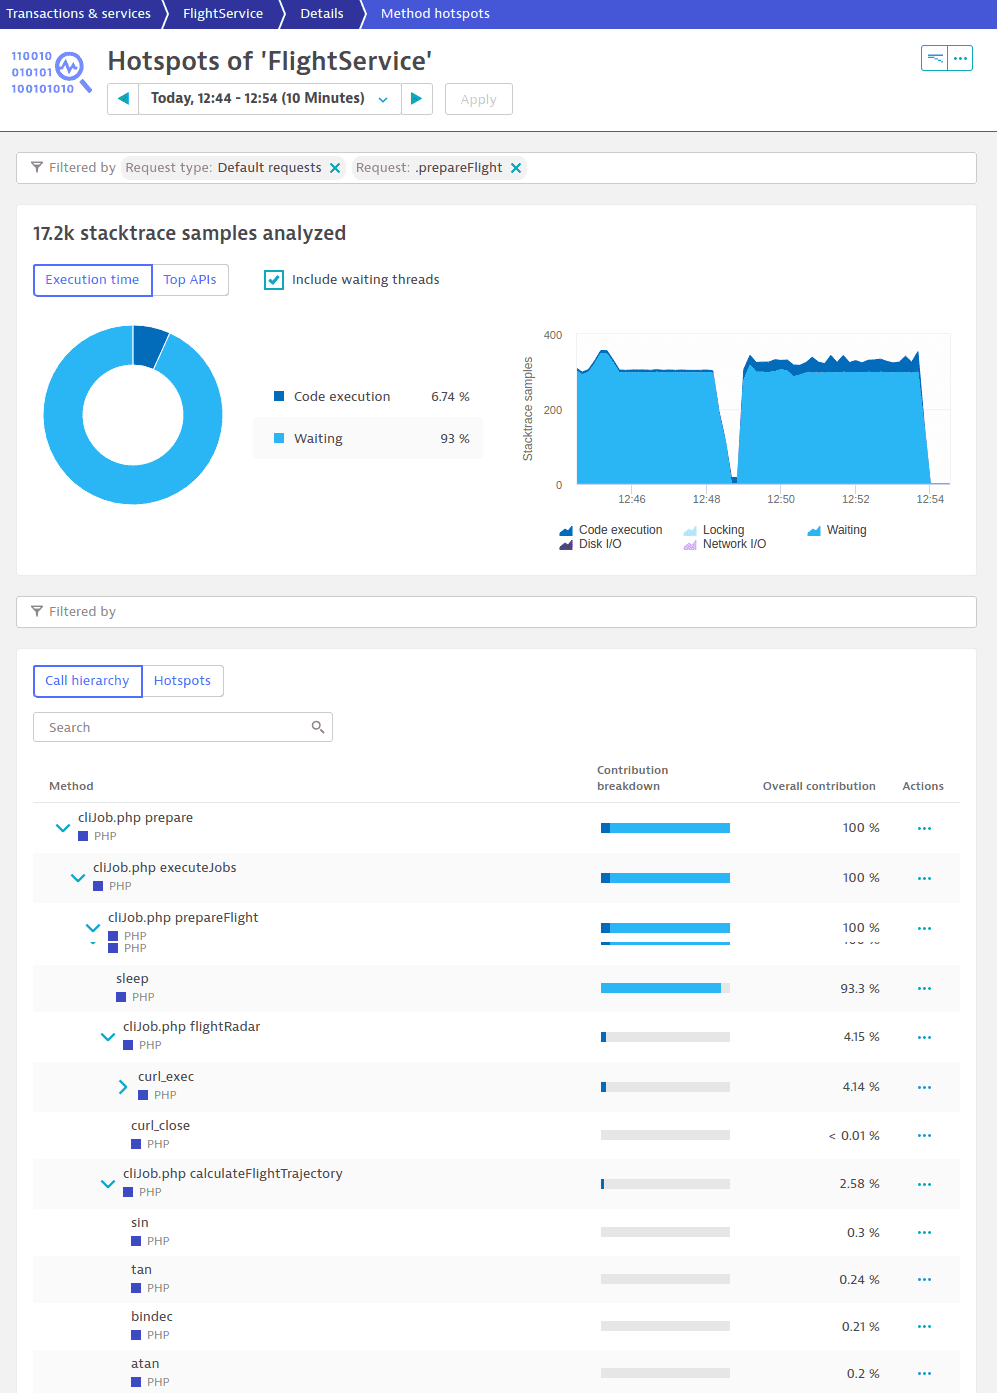
Find the most CPU-consuming methods with method hotspots
You can easily find and fix the most CPU-consuming methods within your PHP code.
