Speed up incident response with Dynatrace Investigations reference time
- Latest Dynatrace
- Tutorial
- Published May 13, 2025
Effective incident response and root cause analysis rely on accurate timing and context. With  Investigations's reference time, you can enhance data-driven investigations by gaining deeper insight into the sequence of events.
This article explores how you can maximize the benefits of timestamp reference within Investigations.
Investigations's reference time, you can enhance data-driven investigations by gaining deeper insight into the sequence of events.
This article explores how you can maximize the benefits of timestamp reference within Investigations.
Target audience
This article is intended for Security and Site Reliability Engineers who participate in incident response, root cause analysis, and threat-hunting endeavors that involve data-driven forensic investigations.
Scenario
You get a notification that your production environment has a high load of HTTP 503 errors. You now have to quickly find out what has caused these errors. You log in to your Dynatrace environment and start the investigation. Fortunately, your colleagues have already started the investigation, and some initial steps have already been taken.
Before you begin
- Open the read-only shared investigation in Dynatrace Playground.
- Duplicate the investigation to continue the investigation scenario and be able to execute queries. For instructions, see Duplicate investigations.
Get started
The following steps guide you through the flow of a root cause analysis using the reference time as one of the tools in Investigations.
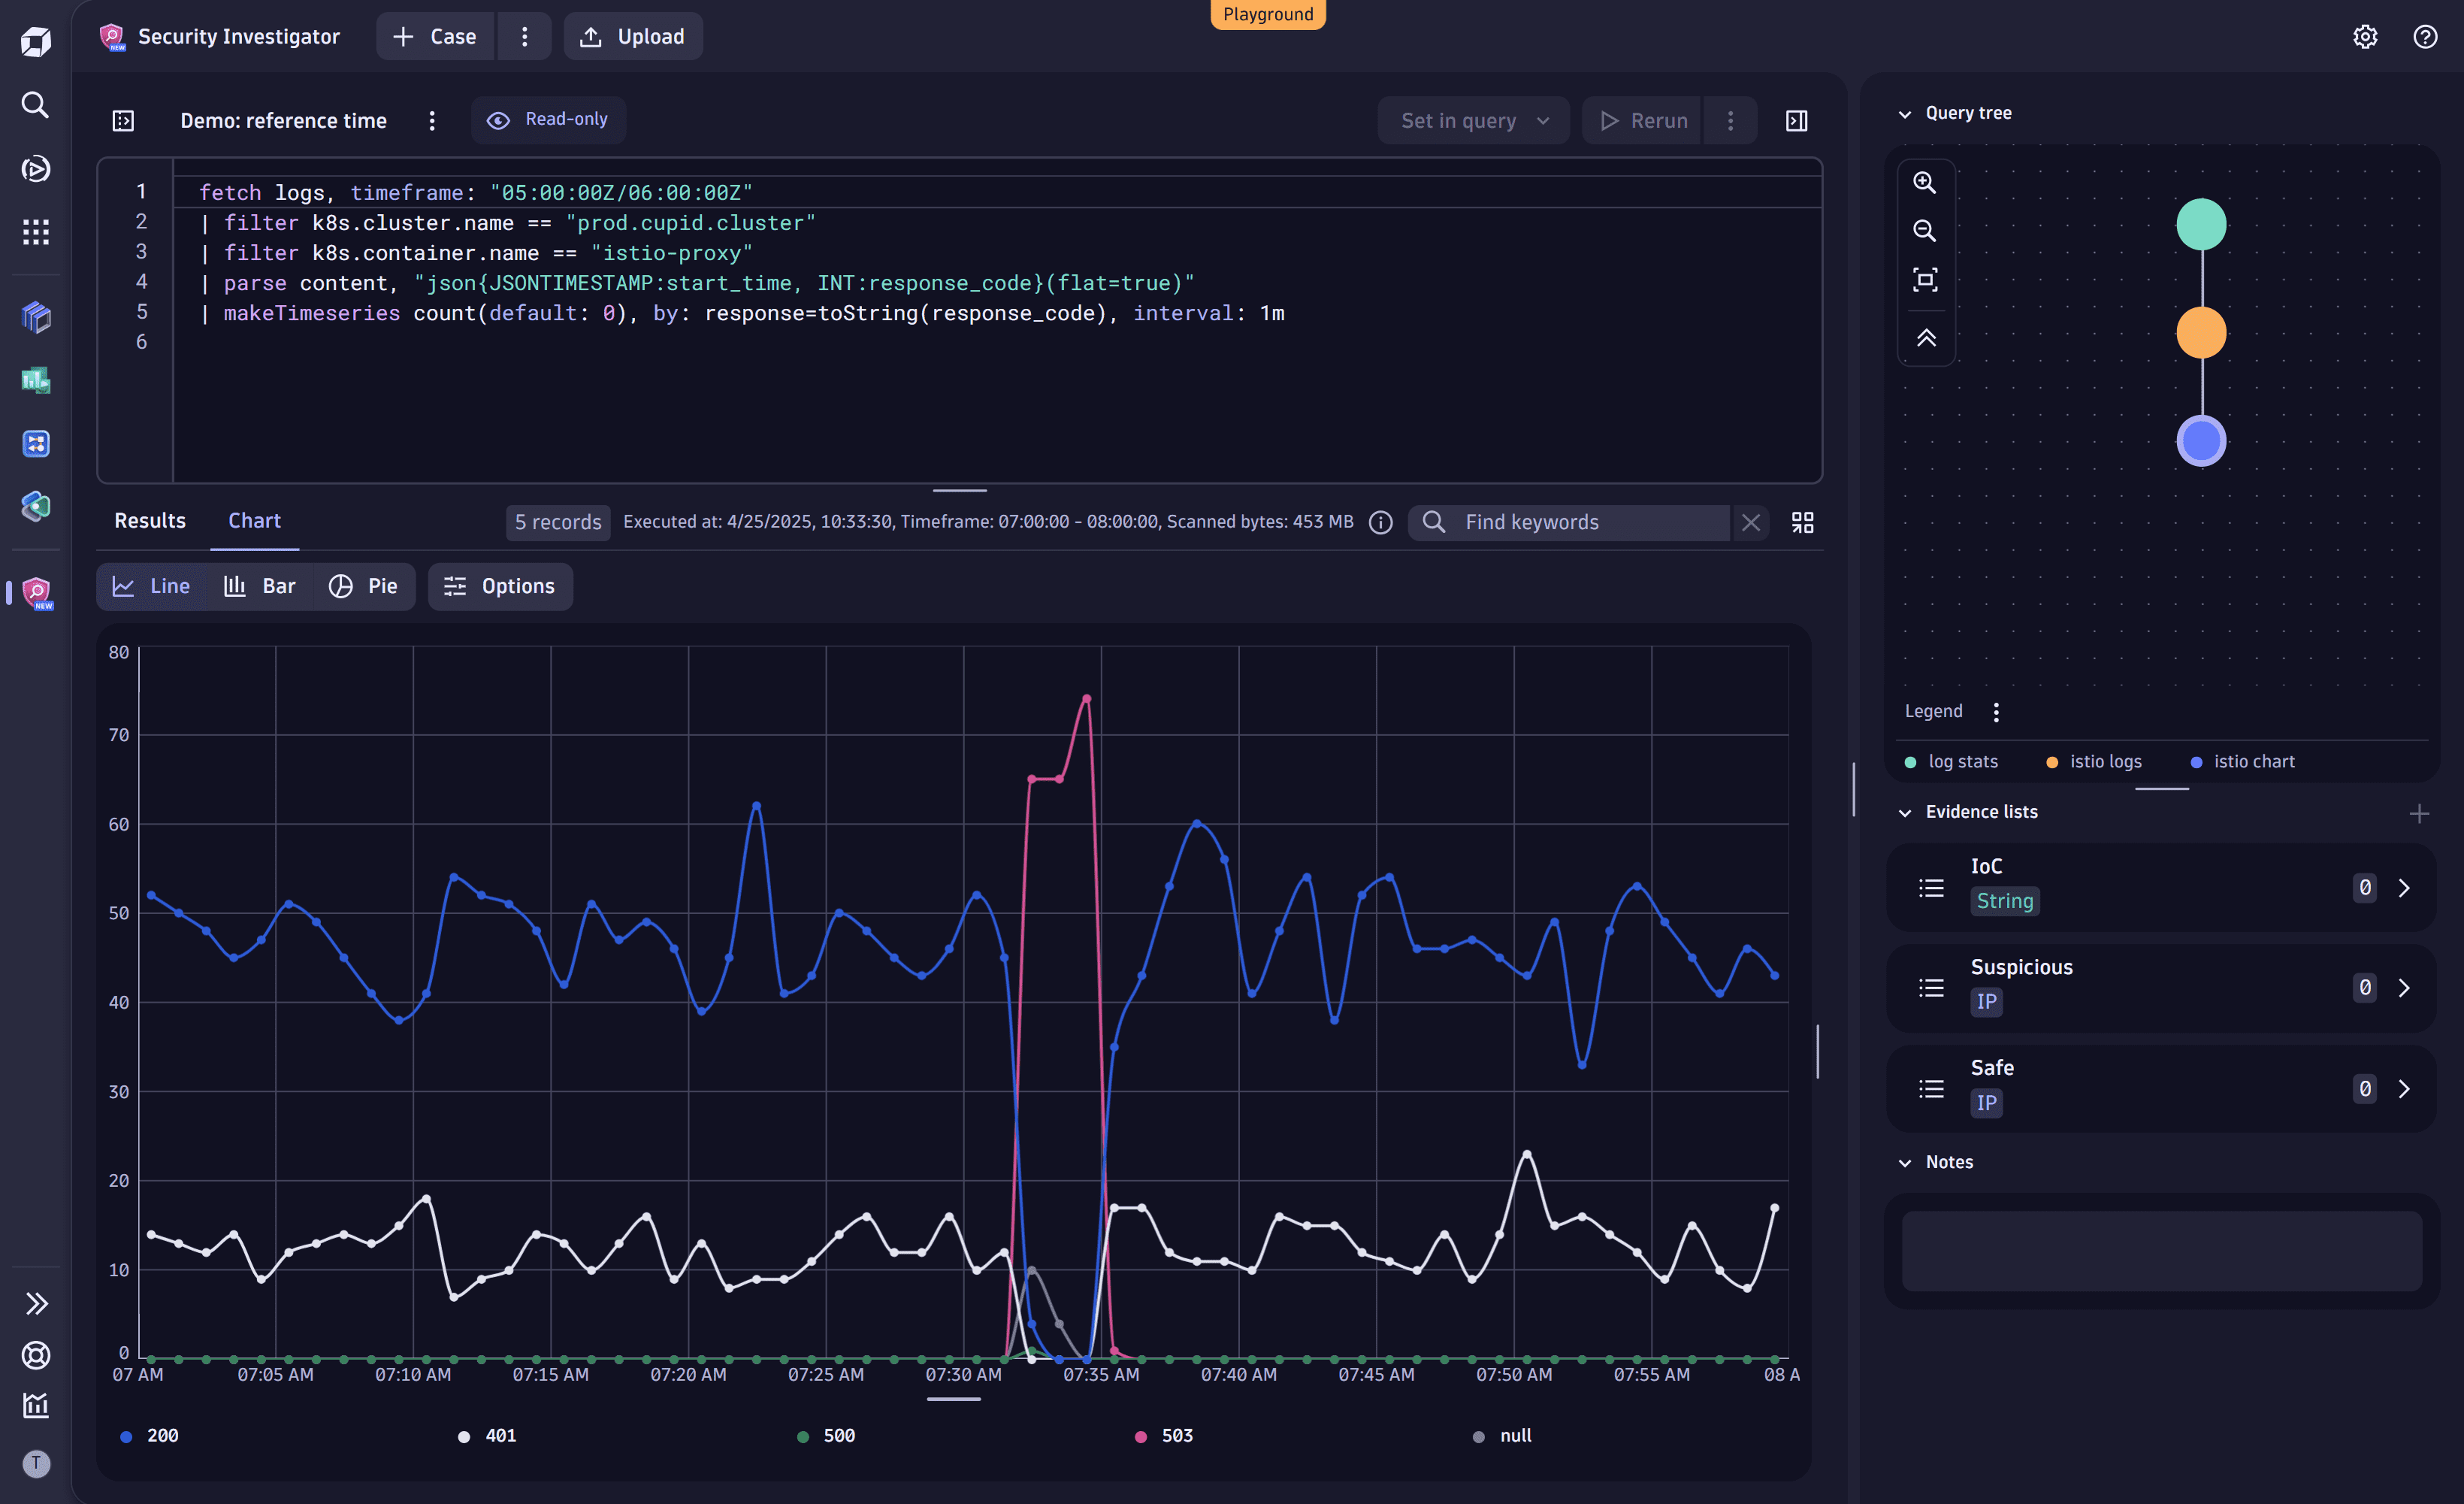
1. Analyze the response chart
Open the duplicated investigation and select the blue node to view the chart representation of the response code distribution over time.
You can see the response code 503 spike for a while before returning to a normal state.
2. Look for the first occurrence of the error
As written in RFC7231, the response code 503 (Service Unavailable) indicates that the server is currently unable to handle the request due to a temporary overload or scheduled maintenance, which will likely be alleviated after some delay. In other words, a request that results in a response 503 is not the cause of the problem but only an indication that something has already broken the service.
To find out what caused the service problems, let's examine the events that occurred before the first request, which received a response of 503.
-
In the query input for the blue node, remove the last line containing the
makeTimeseriescommand. -
Add the following
filtercommand to retrieve only requests resulting in the503response code:| filter response_code == 503 -
Add the following
summarizecommand to take the minimum timestamp value from all results:| summarize min(timestamp) -
Run the query.
This creates a new node with a single value in the timestamp field.
-
Right-click on the timestamp in the results table and select Set as reference time to define it as a reference.
You notice a reference time box on top of the page and a new virtual column called timestamp_diff representing the offset between the timestamp value and your reference time. The reference time is
00:00:00.000since the value in the timestamp field and the reference time are the same.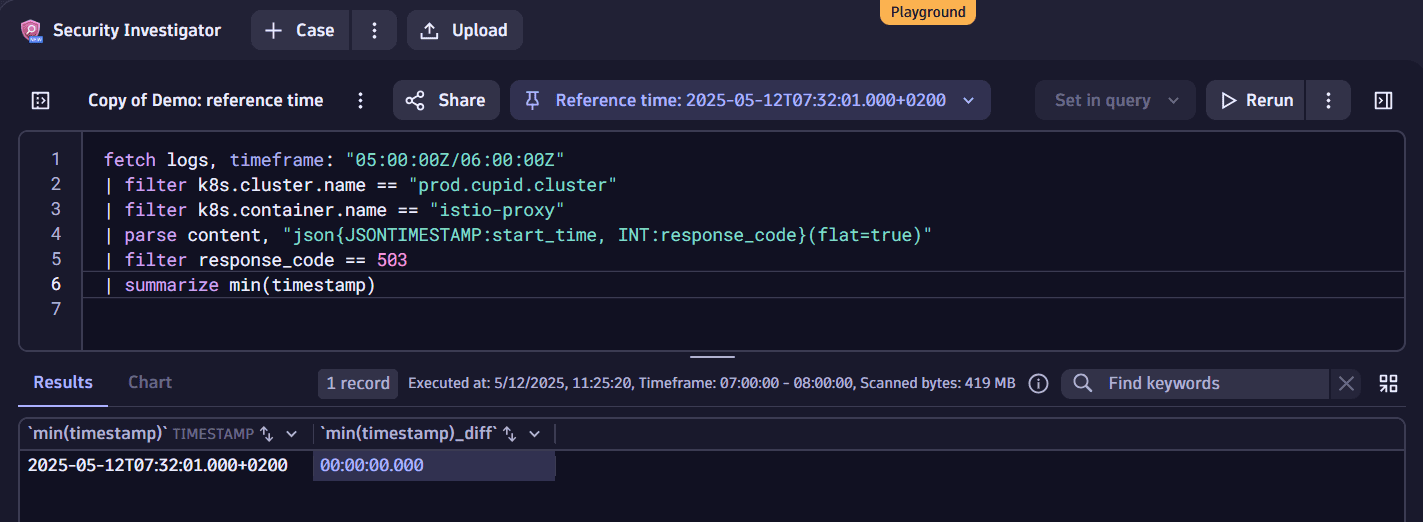 reference-time
Multiple virtual offset fields can be in one result set; you can create a virtual field for any
timestamptype.
3. Find a preceding error message
Using the reference time, let's look for the request that led to our service being unresponsive.
-
Navigate to the second (orange) node to see the Istio logs. You notice that the reference time offset field is present in this results table as well.
-
In the menu of the reference time box, select Earlier than. This creates a timestamp filter to fetch logs written before the time of the reference timestamp value.
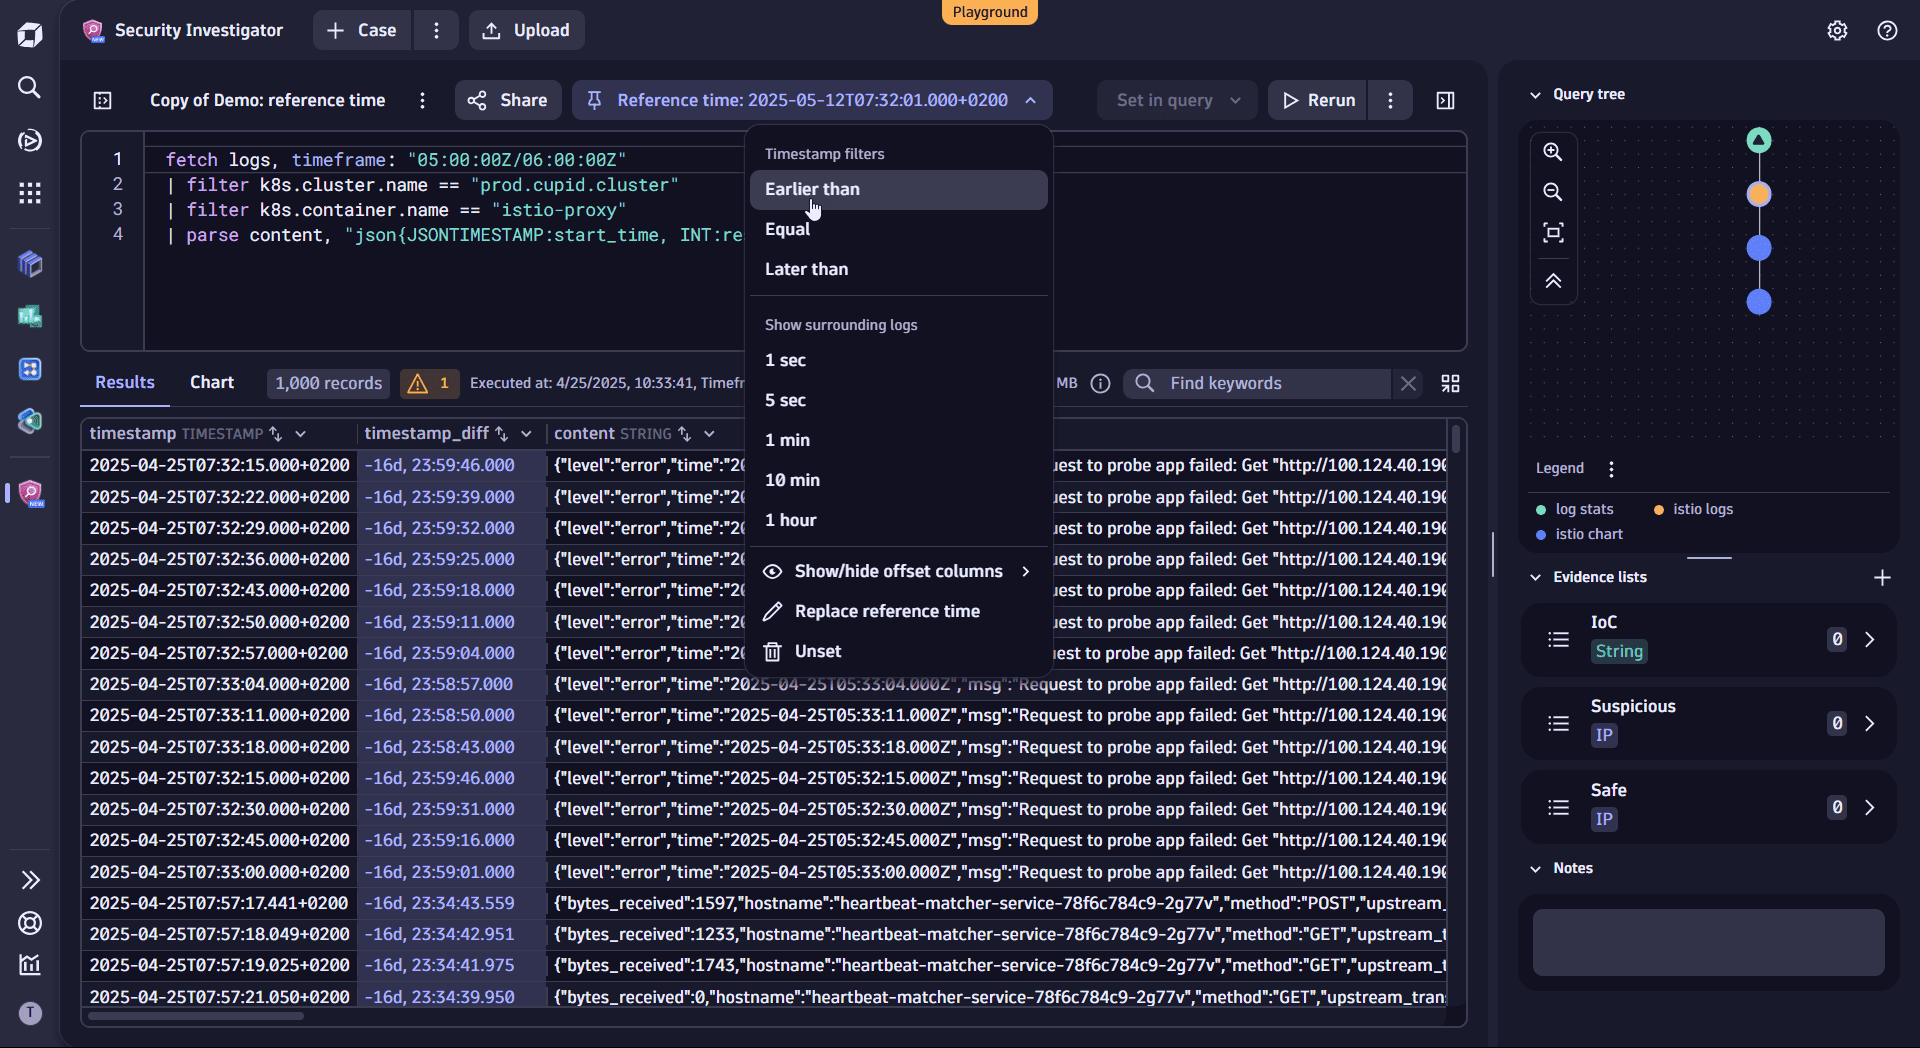 timestamp filter
 -
Rename
timestamptostart_timein the timestamp filter command.Reason: When creating a reference time, the first timestamp field is used for filtering. In this case, the
timestampfield is used. For Istio logs, we need to use thestart_timefield; this means you need to manually modify the filter and renametimestamptostart_timein the filter statement. -
Add the
sortcommand to sort results chronologically.Your DQL query should look similar to this:
fetch logs, timeframe: "05:00:00Z/06:00:00Z"| filter k8s.cluster.name == "prod.cupid.cluster"| filter k8s.container.name == "istio-proxy"| parse content, "json{JSONTIMESTAMP:start_time, INT:response_code}(flat=true)"| filter start_time < toTimestamp("2025-05-12T05:32:01.000Z")| sort timestamp desc -
Run the query.
The first record in the results table contains an HTTP 500 response, which can indicate the request that might have caused the error in your system.
 response code 500
 -
Right-click on the record's timestamp and select Replace as reference time to replace the current reference time with the value from the suspicious request.
4. Analyze application logs
You found the request that resulted in an HTTP 500 error in the Istio logs. However, to understand what happened to your application, you need to dig into the application logs.
-
Go to the first node of the query tree. Here, you can see all the containers and processes you have logs for.
-
In the query input, remove the
summarizecommand. -
Right-click on the
heartbeat-matcher-servicevalue in thek8s.container.namecolumn, select Filter, and run the query.The results show all the application logs and their relative distance from when the error occurred (that is, the offset to our reference time).
-
In the reference time box menu, select
1 minin the Show surrounding logs section, and then run the query.This allows you to look closely at the relevant events and filter to only those around your reference time.
-
In the timestamp column header, select Sort ascending to sort the results chronologically.
When looking at the results, you can see all the requests and logged information about the incident time. Scrolling further down, you discover that a stack trace has been written to the logs at the exact moment of the reference time.
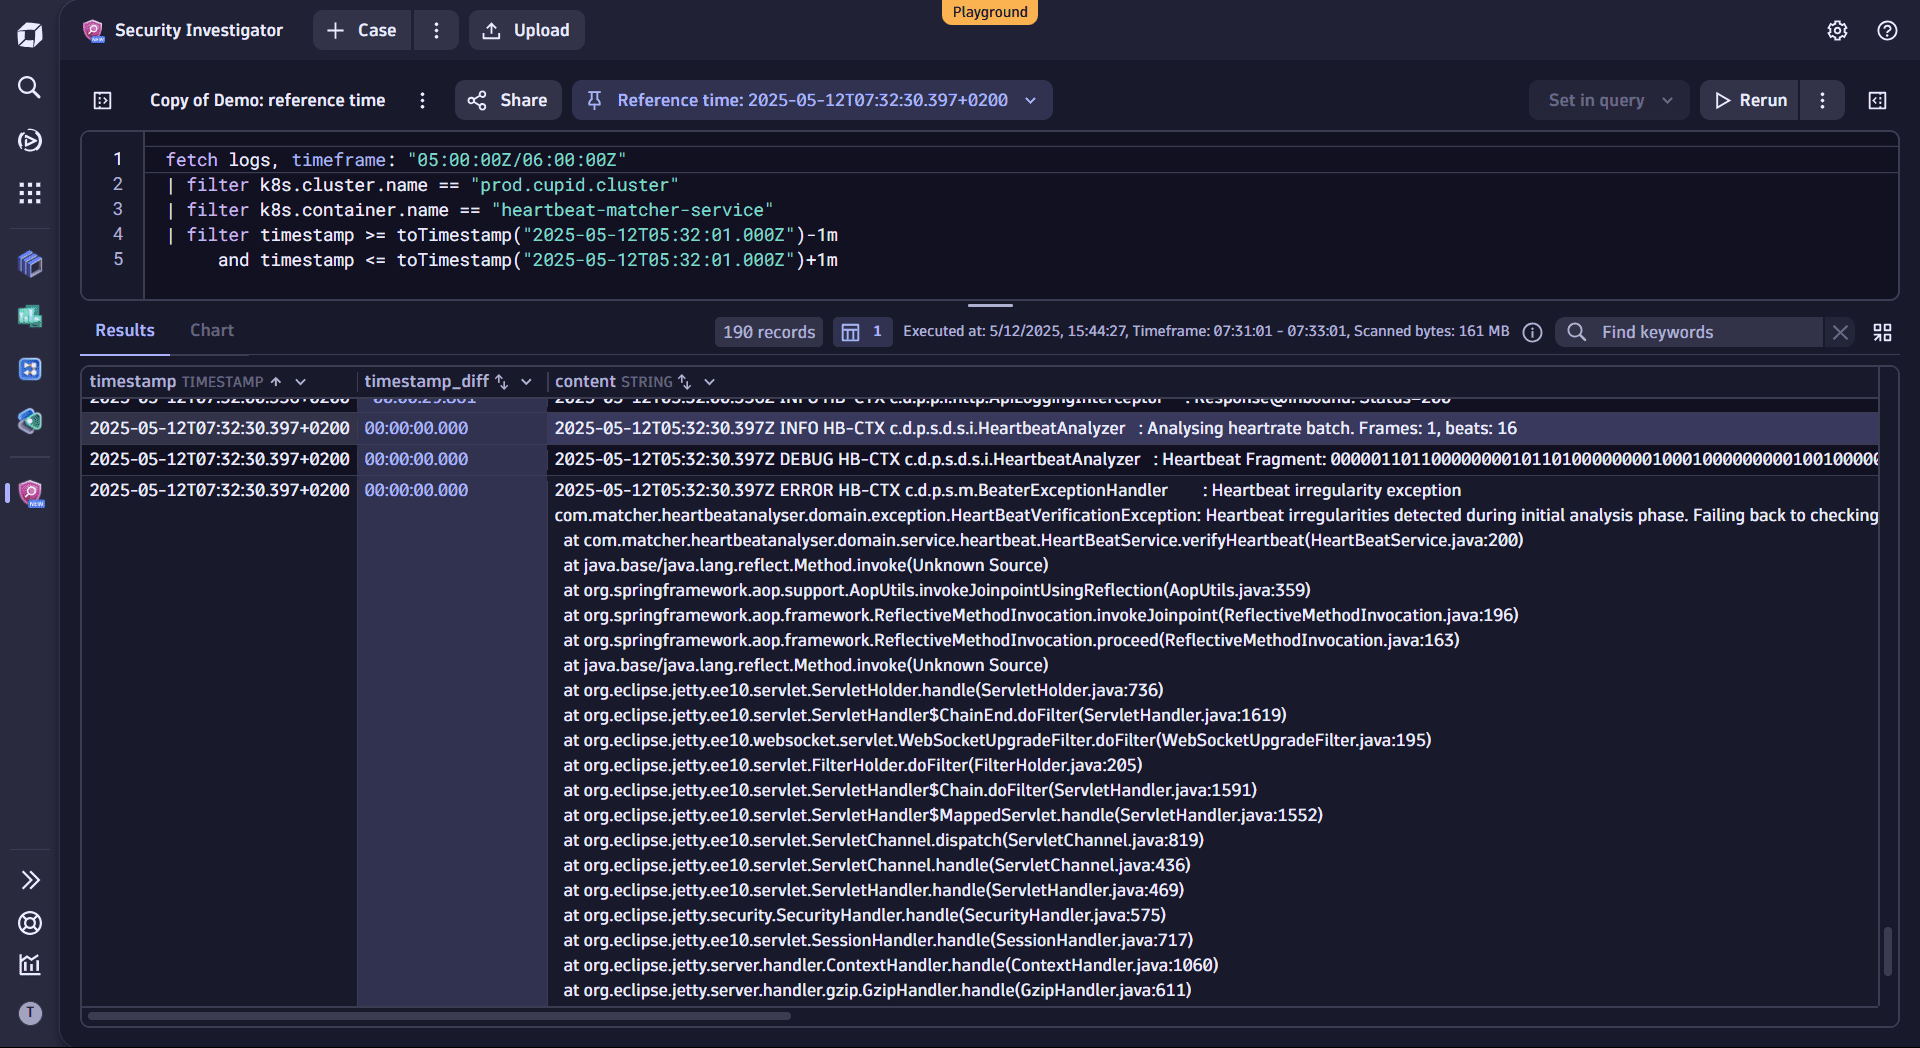 stack trace
Conclusion
With reference time, you can efficiently navigate logs while maintaining the incident's time context. It helps you track the time offset between events you’re analyzing and when the incident occurred. This allows you to uncover relevant threads and evidence—even from logs and events that may initially seem unrelated.
Reference time integrates diverse information, ensuring a consistent incident context across all data points.