Manage results
- Latest Dynatrace
- How-to guide
In the following, you'll learn how to manage results on the detection findings page of  Threats & Exploits. You can
- Filter: Select which information to display in the table
- Format: Select which columns to display in the table
- Group: Organize findings into clusters based on selected attributes
- Sort: Select the order in which to display table results
- Visualize: Chart information based on selected criteria
- Enrich: Add external reputation data to IP addresses
Filter findings
You have several options to filter findings:
See below for details.
Filter by timeframe
With the timeframe filter, you can define the period from which your data is being queried. If you don't specify the timeframe, the default Last 2 hours is applied, meaning that the data being fetched is from the last two hours.
To apply a timeframe filter
- In the timeframe section, select one of the preset options or select the calendar for customization.
- Select Apply.
Filter by segments
Segments provide quick access to predefined logical filters. The segment selector allows you to filter results based on these predefined logical filters.
See below for instructions.
1. Define segments
If you already have segments defined, you can skip this step.
Open the Segments  app and create segments for your environment. For more information, see Include data in Dynatrace segments.
2. Filter by segments
- Open the segment selector .
- In Filter by segments, select a segment.
- Optional To add more segments, select Segments; if available, you can select a value for the selected segment.
- When you're happy with the selection, select Apply.
Selecting one or multiple segments results in fewer findings.
For more information on segments and how they work, see Segments.
Filter by expressions
In the filter field, you can use complex filter expressions to select which information is to be displayed, such as:
-
Add multiple filters on the same filter key
-
Use
ANDandORoperators -
Use the wildcard (
*) to search for patterns -
Filter numbers with
>and<
To filter by expressions, you have two options:
- Option 1: Manually type the expression in the filter field
- Option 2: Filter by field values in the results table (hover over a cell and select a filter from the context menu )
To reset the filters to the default mode, select  on the right of the filter field.
If the selected filter doesn't show in the table, go to the column settings  and make sure to add the corresponding column to the table.
Format table
You can choose between two preset views of the results:
- The Overview tab displays basic information about the findings
- The Detailed tab includes more detailed information
You can easily switch between the two views and customize them (add or remove columns) according to your needs. Customization persists until modified.
To select which columns are to be displayed
- Select the view you want to modify (Overview or Detailed).
- On the upper-right of the table, select the column settings .
- Select the desired columns and order them as you see fit using the up and down arrows.
- When you're done, select Confirm.
A pencil icon attached to a tab means the default view has been modified. Select the tab to see your changes.
To reset the views, select Reset to default in column settings .
Group findings
Grouping allows you to organize findings into logical clusters, helping you identify patterns, reduce noise, and focus on the most relevant areas.
To group findings
-
Select Group by, located next to the Overview and Detailed tabs.
-
In the drop-down menu, choose among the available options. The menu offers several grouping categories:
-
Core: Commonly used grouping options such as actor IP, severity, affected object, or type.
-
Extended: Additional attributes for more granular organization.
-
Kubernetes, AWS, Azure, GCP: Platform‑specific attributes.
You can select up to three groupers to further cluster the findings.
-
-
To apply your selection, click anywhere outside the menu.
To remove grouping, clear the selected groupers in the Group by menu.
When results are grouped, each group appears as a collapsible row.
- Expand a group to view all findings within that category.
- Select any finding to open its details in the side panel.
Sort columns
You can sort the order of columns and of results.
To select the order of columns, you have two options:
- Option 1: From the column settings (select the column settings , then use the up and down arrows and select Confirm)
- Option 2: From the results table (select a column title, then select Move left or Move right)
To select the order in which results in a column should be displayed:
- Select a column title.
- Select Sort ascending or Sort descending.
Visualize results
The chart allows you to visualize results based on your selected criteria.
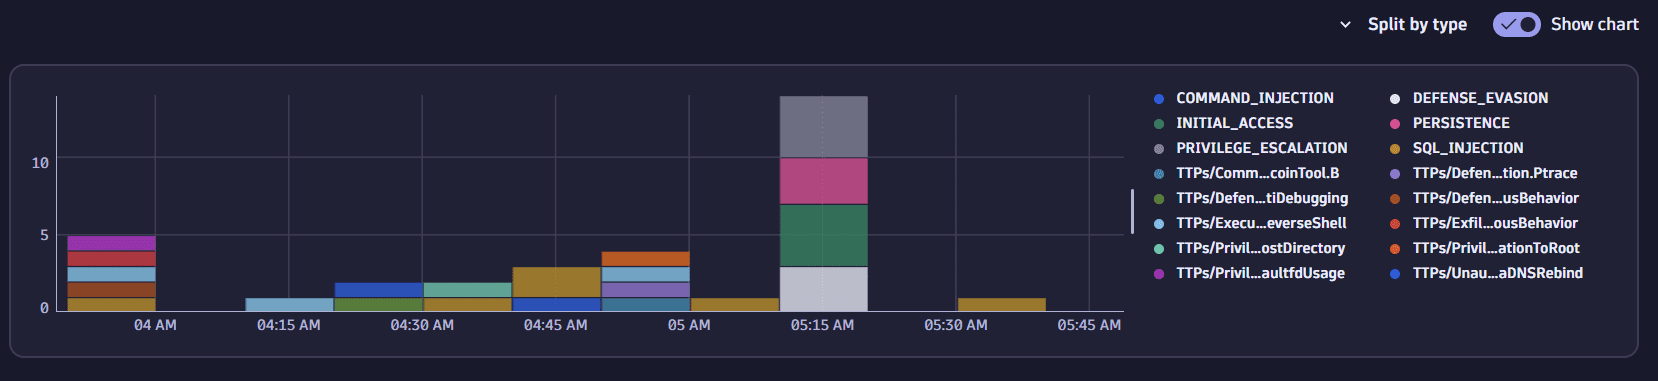
The X-axis displays the time when the findings were detected.
The Y-axis displays the count of the detected findings.
Select different dimensions using the Split by options in the drop-down list:
-
Split by action: Displays findings categorized by the actions taken by the monitoring authority, showing findings that were blocked, allowed, or on which no action has been taken. This helps you evaluate the effectiveness of your security measures.
-
Split by actor IP: Identifies the number of findings originating from specific IP addresses, enabling you to track and analyze patterns of malicious activity from particular sources.
-
Split by provider: Shows findings based on the source generating the event, such as Dynatrace, AWS, or other service providers. This allows you to assess the reliability and security of different providers.
-
Split by affected object: Indicates the number of findings targeting specific objects within your environment, helping you identify which assets are most frequently attacked and require additional protection.
-
Split by severity: Displays the distribution of findings based on their severity levels (low, medium, high, critical), allowing you to prioritize responses based on the potential impact of each threat.
-
Split by type: Groups findings by their types, such as SQL injection, command injection, JNDI injection, SSRF, or any other identified exploit type. This helps you understand the nature of the threats and develop targeted mitigation strategies.
These options provide insights into various aspects of the threats and exploits affecting your applications, enabling informed decisions and enhanced security measures.
Enrich IP addresses
You can enhance detection findings by adding external reputation data to associated IP addresses.
Enriched example:
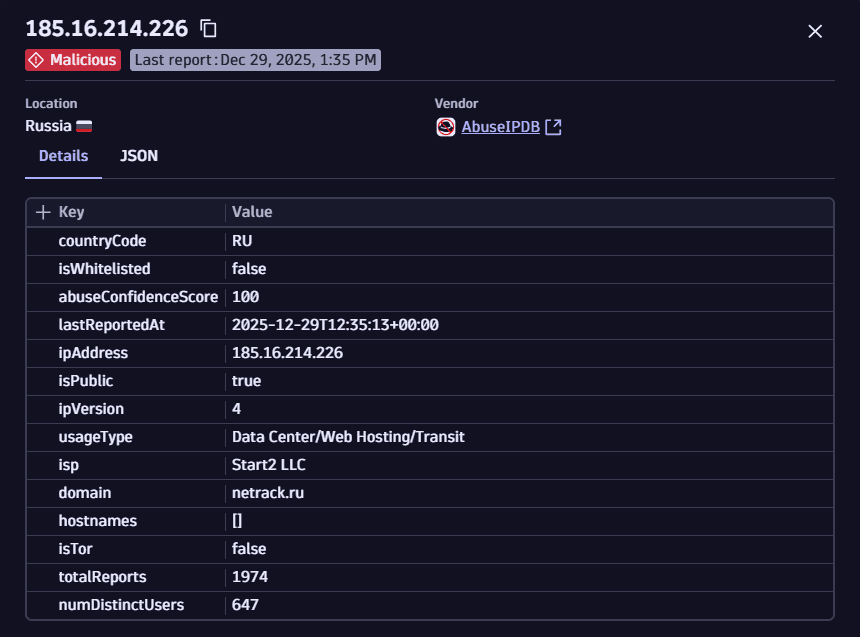
Before you begin, configure an enrichment connection (for example, AbuseIPDB, VirusTotal, or any custom HTTP‑based threat‑intelligence API).
Once configured, you can enrich individual IP addresses.
- Open Threats & Exploits and select a finding.
- In the details pane, under Actor, select Enrich IP.
- If multiple enrichment sources are available, select the one you prefer.
To switch to another source later, use Refresh data from the menu next to the IP.