Collaborate with other apps and share insights
- Latest Dynatrace
- How-to guide
For additional insights, Dynatrace offers you the flexibility to
- Interact with other apps: You have multiple options to navigate to other apps
- Share insights with stakeholders: You can download findings as CSV files
Navigate to other apps
Key use cases include:
-
Examine log results for deeper insights in Logs

-
Examine the targeted code-level vulnerabilities in
 Vulnerabilities
 -
Examine affected processes in
 Infrastructure & Operations
 -
Examine findings' trace and span IDs in
 Distributed Tracing
 -
Start an investigation scenario based on findings in
 Investigations
 -
Automate findings with
 Workflows
 -
Incorporate findings in
 Dashboards
 -
Create data-rich reports in
 Notebooks
To navigate to the desired app, you have multiple options. See below for examples.
Explore multiple findings
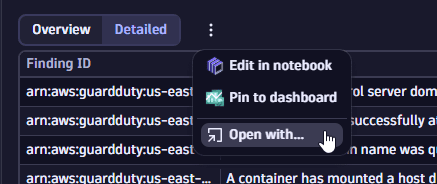
On the detection findings page, select any of the available options from the context menu on top left of the results table.
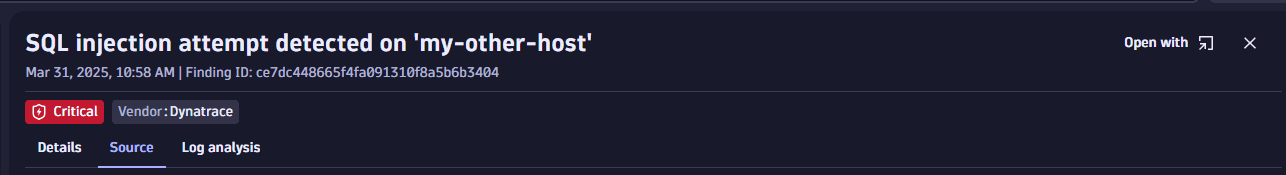
Explore individual findings
Select a finding, then select Open with at the right of the finding's name.
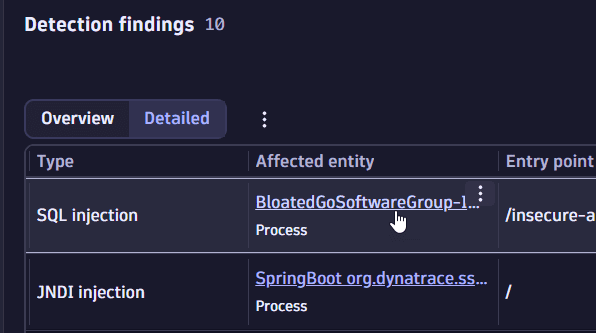
Explore affected objects
You have two options:
-
Option 1: On the detection findings page, select a process in the Affected entity column of the results table.
This option is only available for Dynatrace-vendor–findings.
 affected entity - in table
 -
Option 2: In the Details tab of a finding, select Open with from the context menu of an affected object.
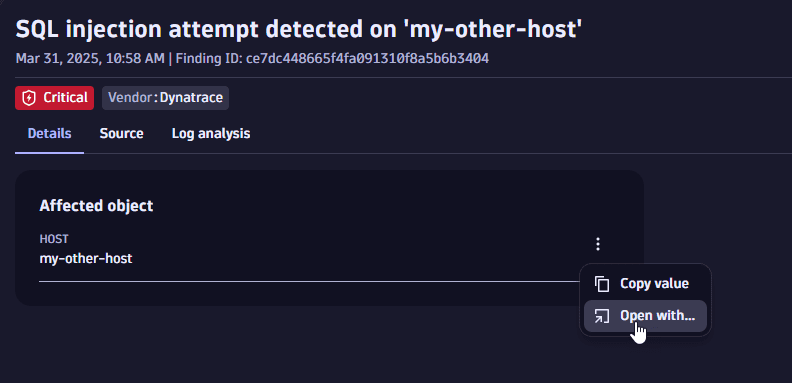 affected object details
Explore vulnerabilities
This option is available only for findings from your Dynatrace-monitored environment, where Runtime Application Protection and Runtime Vulnerability Analytics are enabled.
To navigate to Vulnerabilities filtered by a specific vulnerability, you have two options:
-
Option 1: On the detection findings page, select a vulnerability in the Vulnerability column of the results table.
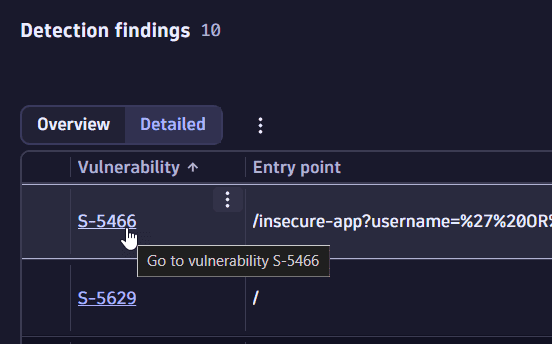 vulnerability-in table
 -
Option 2: In the Details tab of a finding, select the vulnerability name in the Vulnerability section.
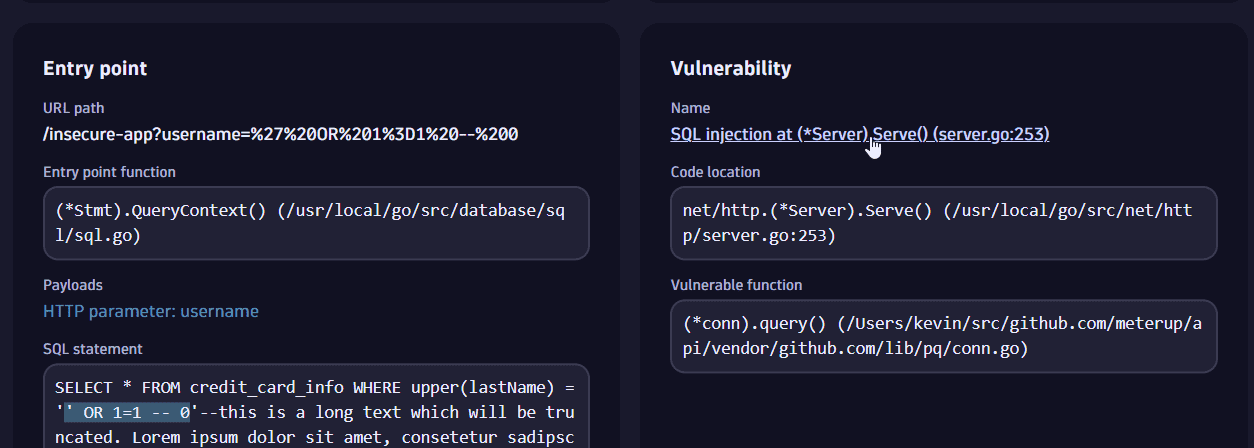 vulnerability - in details
Explore source values
-
In the Source tab of a finding, select Open with from the context menu of a listed value.
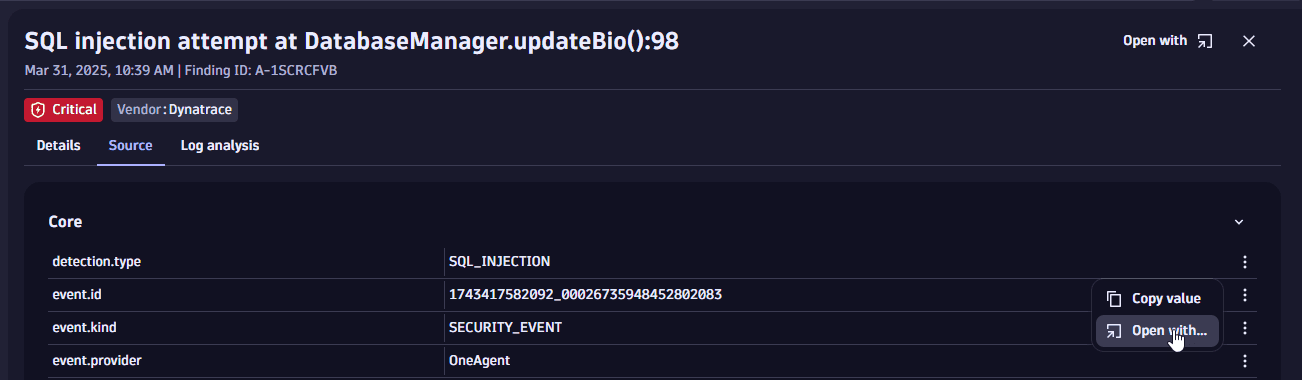 source values
Explore logs with investigation guidance
Use Investigation guidance in the details of a finding to trigger tailored investigations in the Investigations app.
For details, see Trigger investigation.
Download as CSV
You can download results as a CSV file to share it with others.
- Optional On the detection findings page, use the filter bar to select the results you want to include.
- From the menu in the upper-right corner of the page, select Download table.