Ingest Microsoft Sentinel security events
- Latest Dynatrace
- How-to guide
Correlate Sentinel findings with runtime context for faster investigations.
Get started
Overview
Dynatrace integration with Microsoft Sentinel, a cloud-native security information and event management (SIEM), allows users to unify and contextualize security findings across DevSecOps tools and products, enabling central prioritization, visualization, and automation of security findings.
The integration ingests security alerts originated from various connectors, including Microsoft products, such as Microsoft Defender for Cloud, as well as external product connectors.
Use cases
-
Visualize and report your current security posture and trends around security findings across environments with
 Dashboards.
 -
Analyze and prioritize security findings across multiple tools and products uniformly with
 Notebooks.
 -
Create notifications and tickets for critical security findings with
 Workflows.
 -
Use security findings as an additional dimension for threat hunting and incident forensics using
 Investigations.
Requirements
See below for the Microsoft Sentinel and Dynatrace requirements.
Microsoft Sentinel
- Install the Azure CLI.
Dynatrace requirements
-
Permissions:
- To query ingested data:
storage:security.events:read.
- To query ingested data:
-
Tokens:
- Generate an access token with the
openpipeline.events_securityscope and save it for later. For details, see Dynatrace API - Tokens and authentication.
- Generate an access token with the
Activation and setup
-
In Dynatrace, open Hub.
-
Look for Microsoft Sentinel and select Install.
-
Select Set up, then select Configure new connection.
-
Follow the on-screen instructions to set up the ingestion.
-
Verify configuration by running the following query in
Notebooks:fetch security.events| filter dt.system.bucket == "default_securityevents"| filter event.provider=="Microsoft Sentinel"
Details
How it works
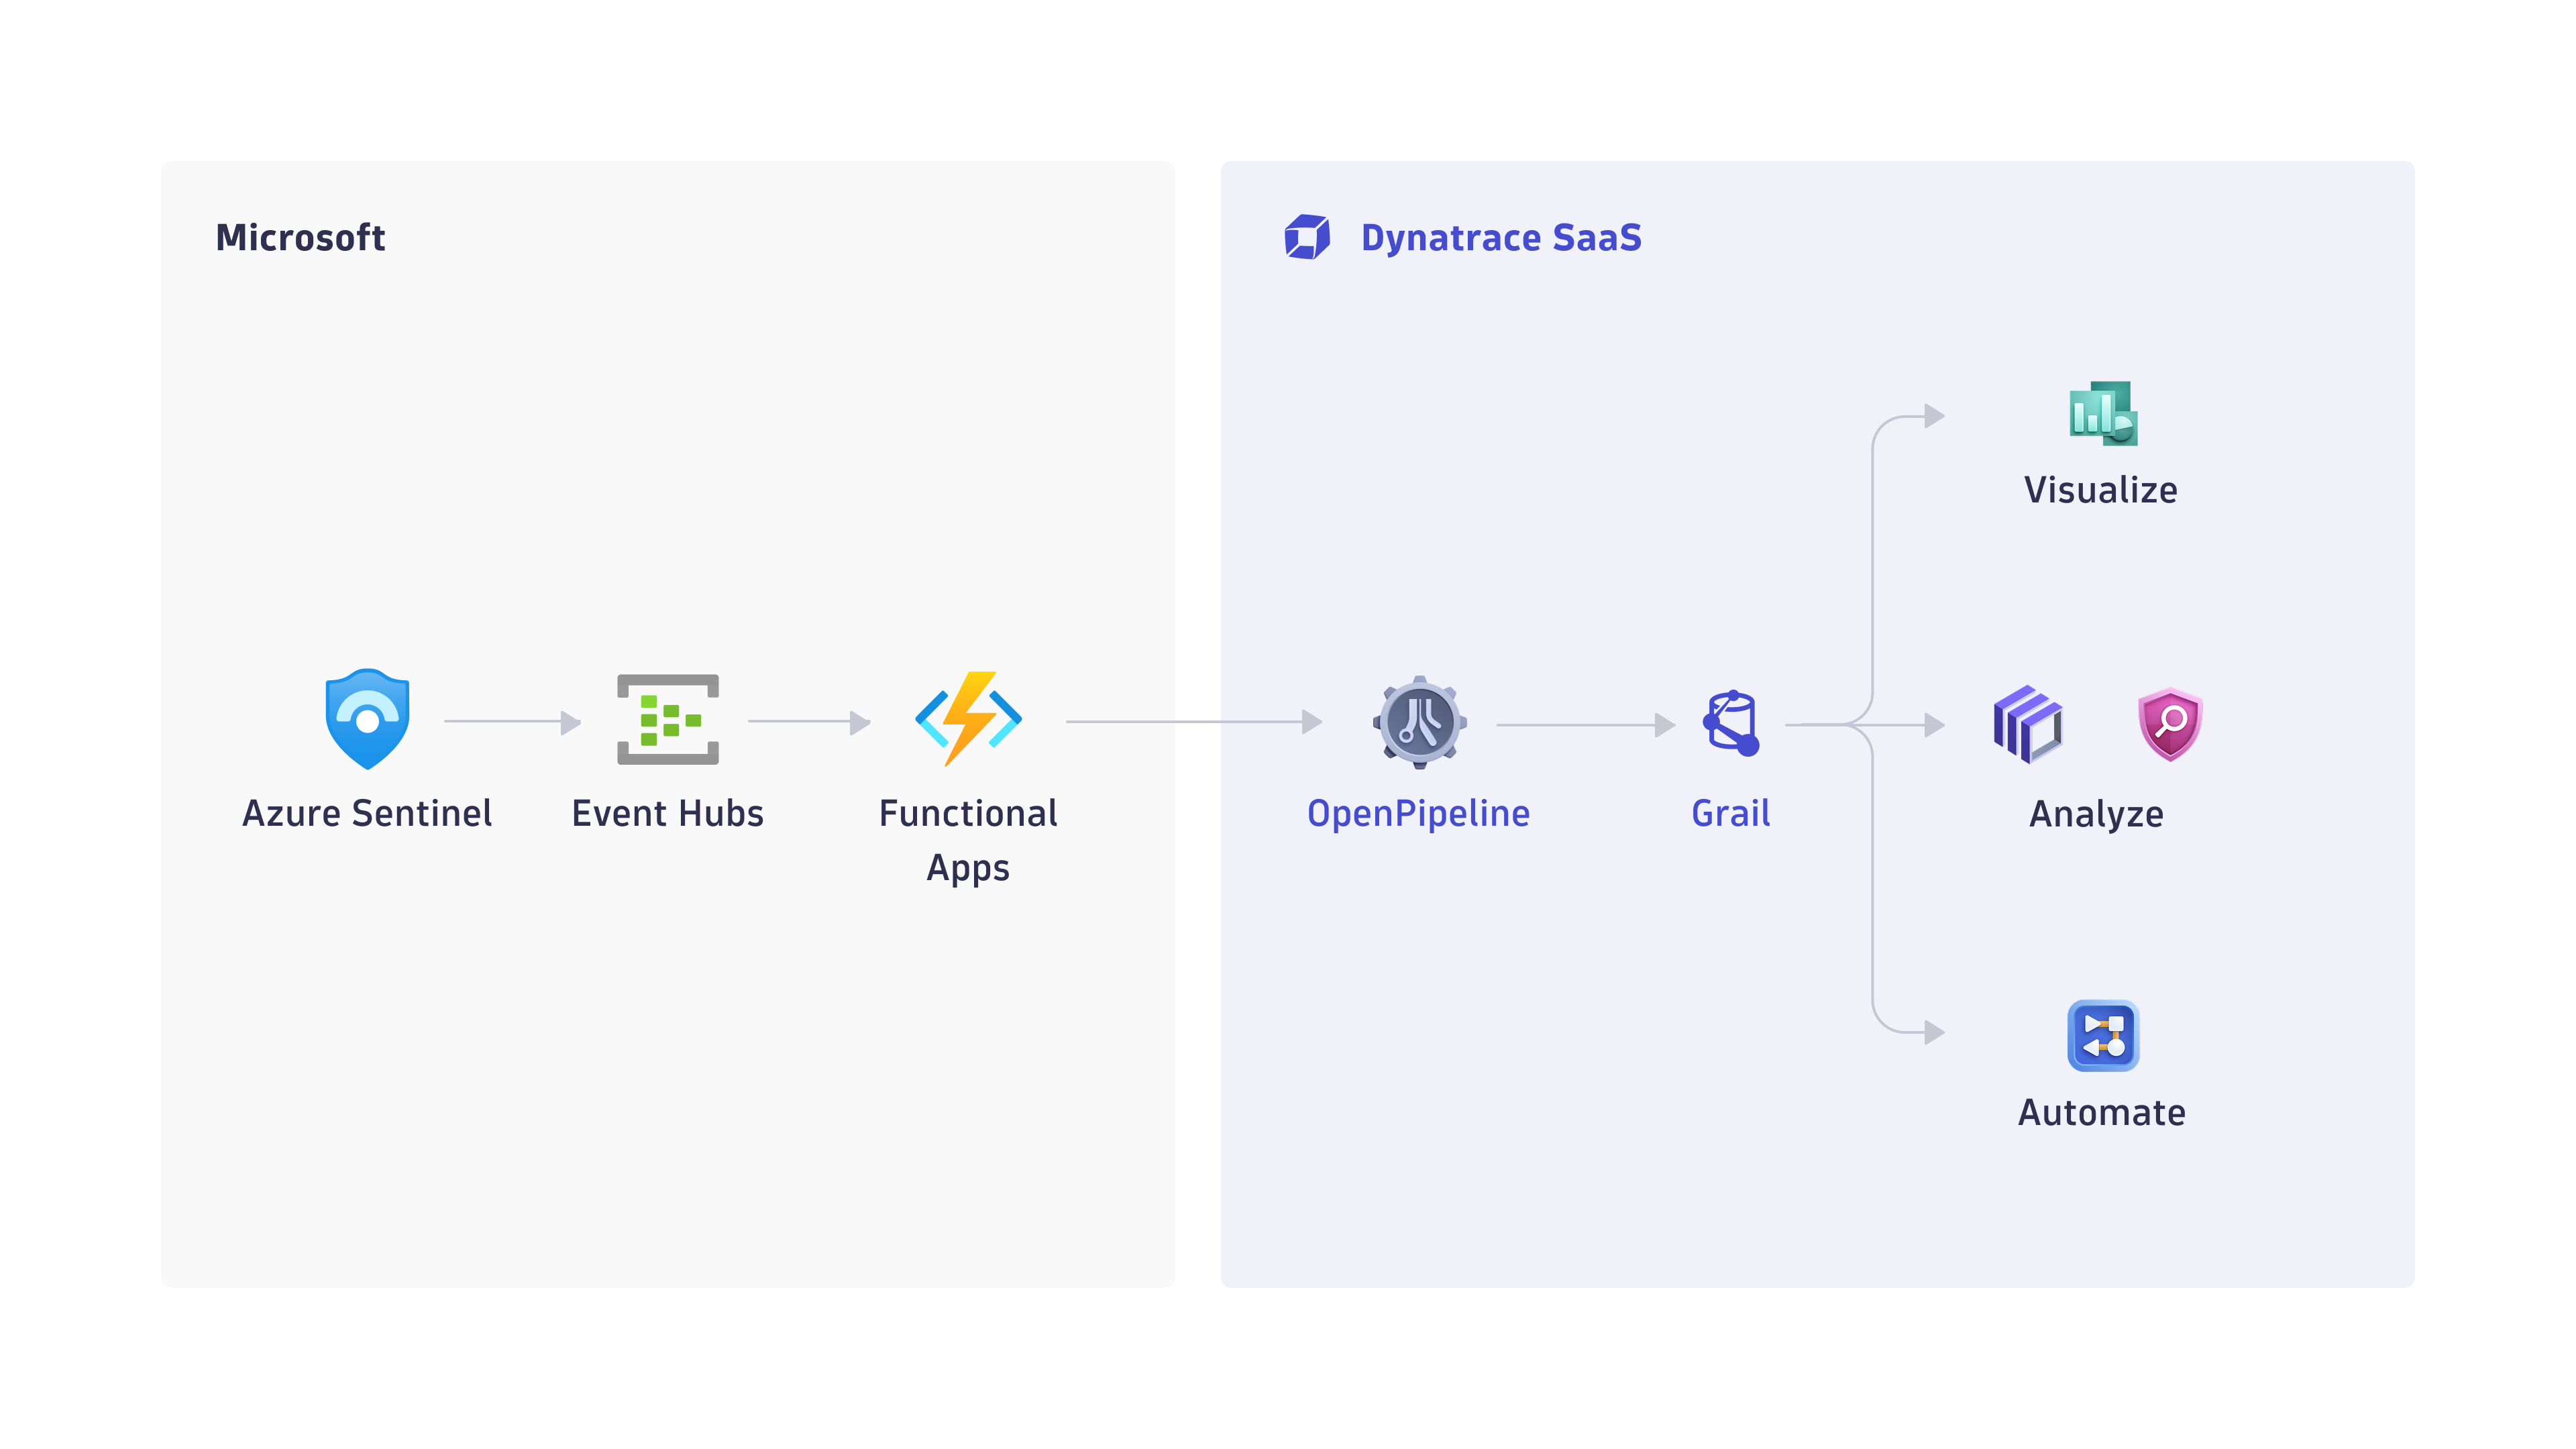
1. Events are ingested into Dynatrace
-
Microsoft Sentinel exports security findings to Azure Event Hubs.
-
An Azure Function app pre-processes the events and sends them to Dynatrace, taking advantage of the OpenPipeline dedicated security events ingest endpoint.
2. Security findings are processed and stored in Grail
-
The fetched data is mapped to the Dynatrace Semantic Dictionary.
-
Data is stored in Grail in a unified format, in a default bucket called
default_securityevents. For details, see Built-in Grail buckets.
Monitor data
Once you ingest your Microsoft Sentinel data into Grail, you can monitor your data in the app (in Dynatrace, go to Settings, then search for and select Microsoft Sentinel).
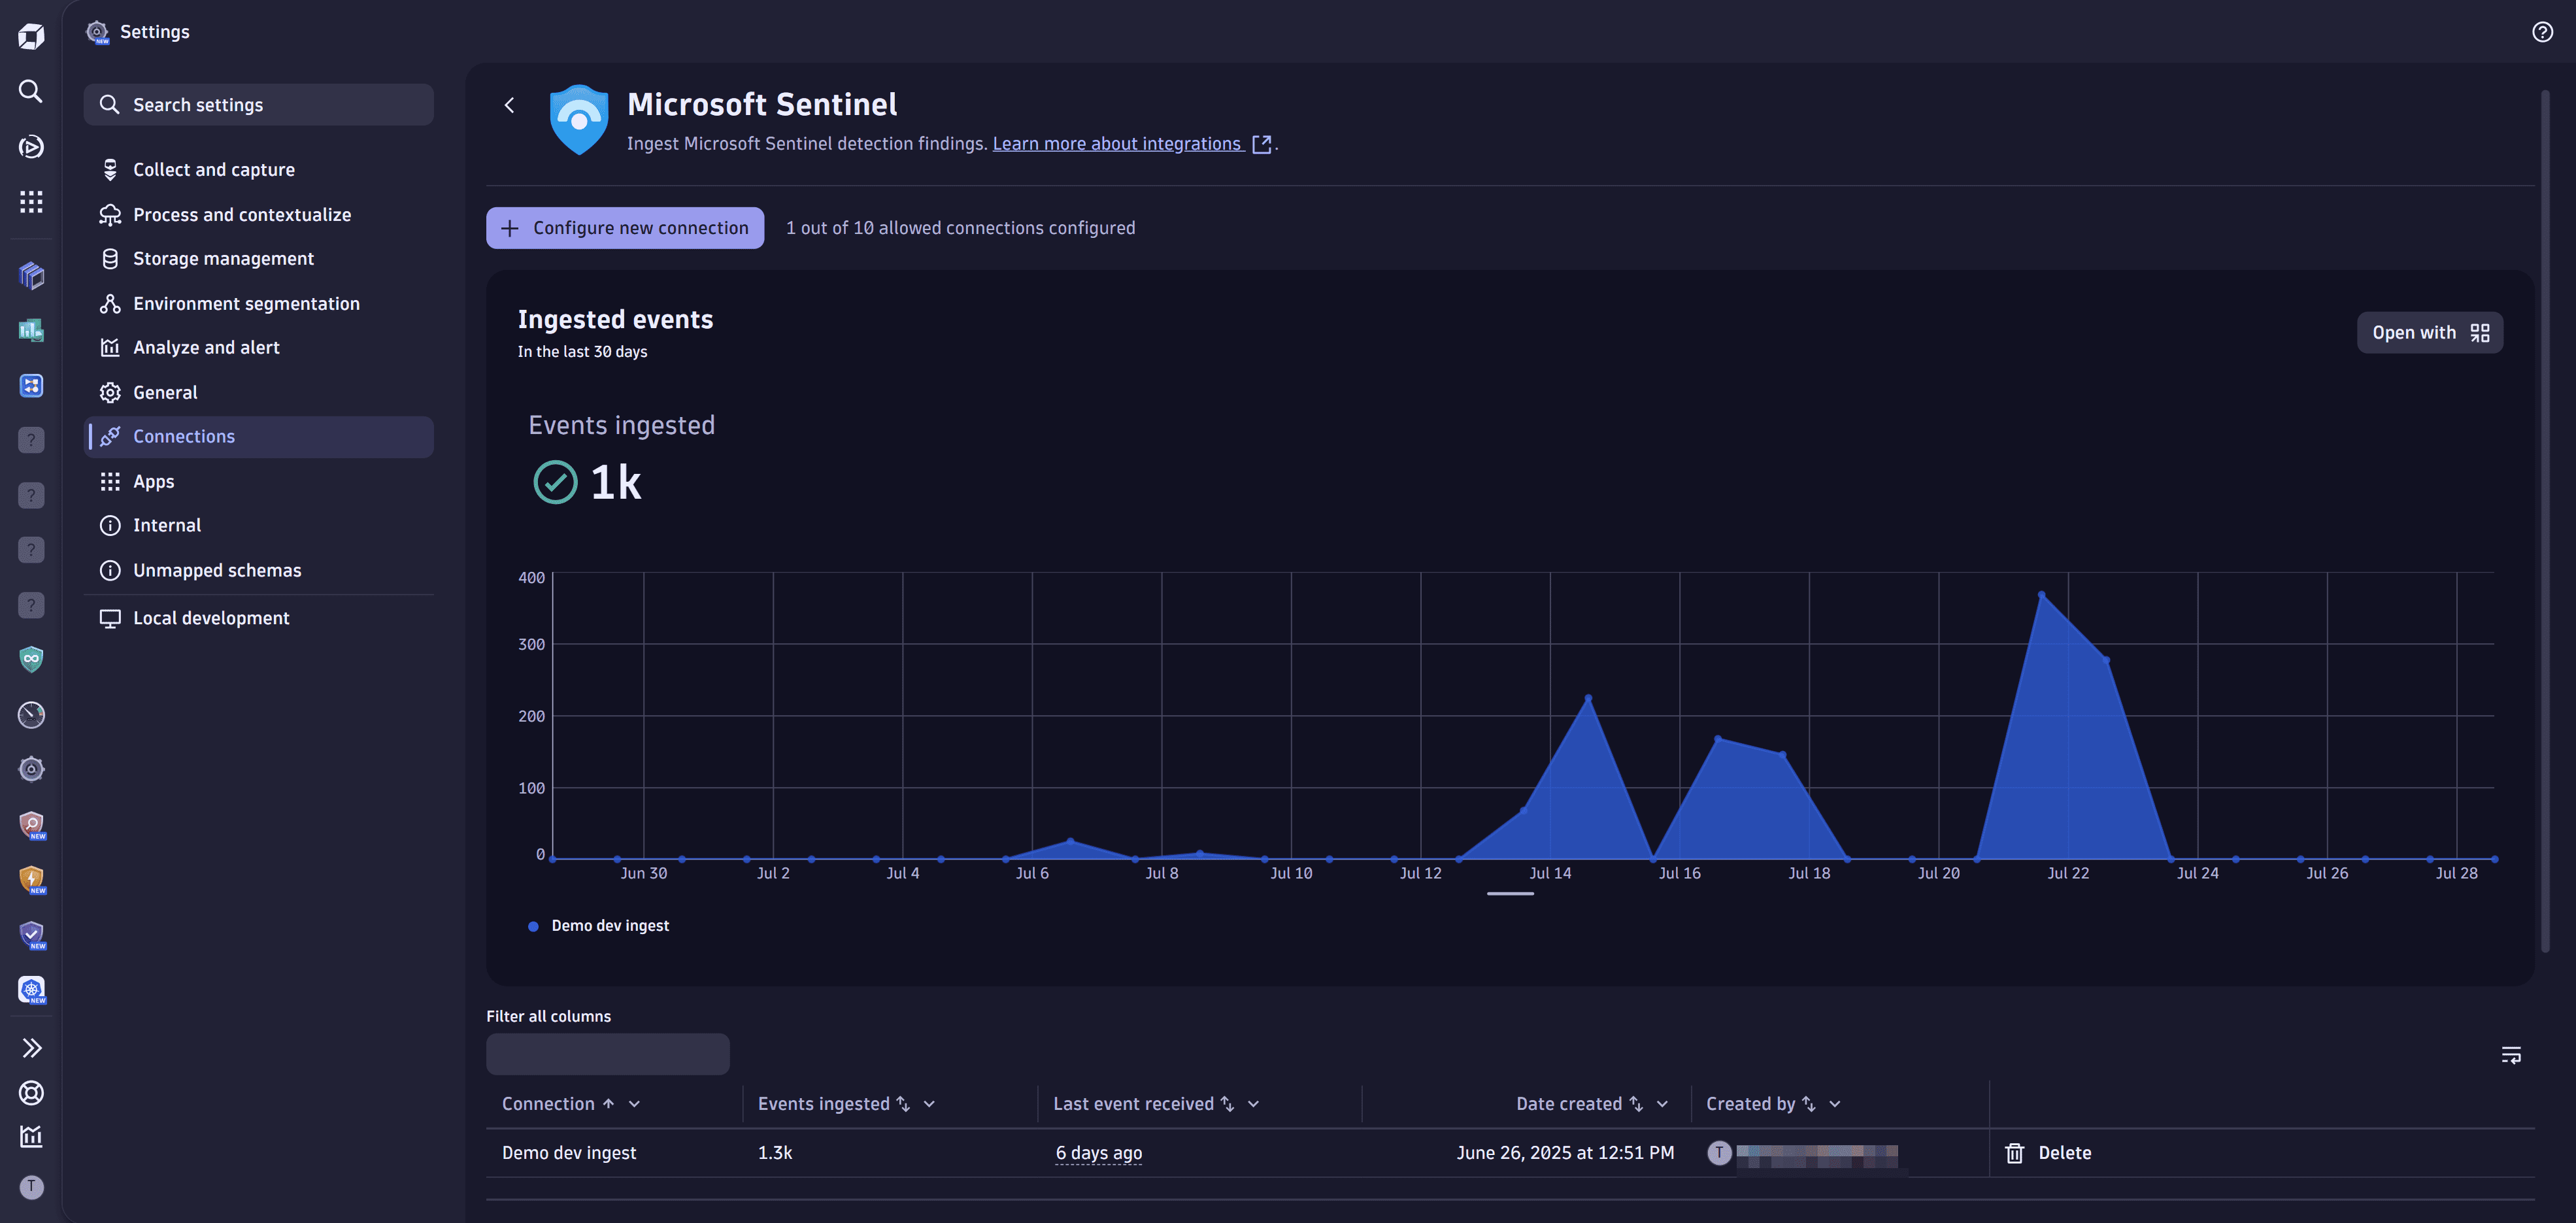
You can view
-
A chart of ingested data from all existing connections over time
- Available actions: Query ingested data
-
A table with information about your connections
- Available actions: Delete connection
Visualize and analyze findings
You can create your own dashboards or use our templates to visualize and analyze container vulnerability findings.
- In Settings, open Microsoft Sentinel.
- In the Try our templates section, select the desired dashboard template.
Automate and orchestrate findings
You can create your own workflows or use our templates to automate and orchestrate container vulnerability findings.
- In Settings, open Microsoft Sentinel.
- In the Try our templates section, select the desired workflow template.
Query ingested data
You can query ingested data in Notebooks or Investigations, using the data format in Semantic Dictionary.
- In Settings, open Microsoft Sentinel.
- Select Open with .
- Select Investigations or Notebooks.
Evaluate, triage, and investigate detection findings
You can evaluate, triage, and investigate detection findings with  Threats & Exploits.
- Open Threats & Exploits.
- Filter for Provider > Microsoft Sentinel.
Delete connections
To stop sending events to Dynatrace
- In Settings, open Microsoft Sentinel.
- For the connection you want to delete, select Delete.
- Follow the on-screen instructions to delete the resources. If you used values different from those specified in the setup dialog, adjust them accordingly.
This removes the Dynatrace resources created for this integration.
Licensing and costs
For billing information, see Events powered by Grail.
FAQ
Which data model is used for the security logs and events coming from Microsoft Sentinel?
Detection finding events store the individual detection findings per affected object represented by an affected Azure resource.
Which extension fields are added on top of the core fields of the events ingested from Microsoft Sentinel?
-
The
actornamespace is added to store all the actor-related fields if present in an alert:-
actor.ipsrepresents the list of IPs of the suspicious actor -
actor.fqdnsrepresents the list of FQDNs of the suspicious actor -
actor.geo.country.namerepresents the country name of the suspicious actor -
actor.geo.city.namerepresents the city name of the suspicious actor
-
-
The
azurenamespace is added to store Azure-related fields in an alert:-
azure.tenant.idrepresents the ID of the Azure tenant -
azure.subscriptionrepresents the ID of the Azure subscription -
azure.resource.idrepresents the ID of the affect Azure resource -
azure.resource.grouprepresents the name of the Azure resource group -
azure.resource.typerepresents the name of the Azure resource type -
azure.resource.namerepresents the name of the Azure resource
-
How do we normalize the risk score for Microsoft Sentinel findings?
Dynatrace normalizes severity and risk scores for all findings ingested through the current integration. This helps you to prioritize findings consistently, regardless of their source.
For details on how normalization works, see Severity and score normalization.
-
dt.security.risk.levelis mapped directly from the severity level (AlertSeverity) set by Microsoft Sentinel. -
dt.security.risk.scoreis mapped directly from the severity level (AlertSeverity) set by Microsoft Sentinel.
dt.security.risk.level (mapped from AlertSeverity) | dt.security.risk.score (mapped from AlertSeverity) |
|---|---|
High -> HIGH | High -> 8.9 |
Medium -> MEDIUM | Medium -> 6.9 |
Low -> LOW | Low -> 3.9 |
Informational -> NONE | 0.0 |
